
Series: Performance Dashboards
Add and edit Performance Dashboards
The following permissions:
- Analytics > Conversation Aggregate > View
- Analytics > User Aggregate > View
- Analytics > Queue Observation > View
- Analytics > Dashboard Configurations > Edit
- Analytics > Dashboard Configurations > View
- Analytics > flowObservation > View
- Analytics > flowAggregate > View
- Directory > User > View
- Routing > Queue > View
- Routing > Queue > Search
- Routing > Wrap-up Code > View
- Architect > flowOutcome > View
- Architect > flow > View
- To view the real-time adherence metrics: Workforce Management > Real-Time Adherence > View
- To make a dashboard public: Analytics > Dashboard Configurations > Publish
- To delete the dashboards of active users in the organization: Analytics > Dashboard Configurations > Delete Active
- To delete the dashboards of inactive users in the organization: Analytics > Dashboard Configurations > Delete Inactive
Notes:
- Users with Analytics > Dashboard Configurations > Edit or Analytics > Dashboard Configurations > View permissions can see all public dashboards.
- The system evaluates a user’s individual permissions to determine how much of a public dashboard they are able to see. Depending on the permission limitations, you cannot open the dashboard or receive a notification at the top of the dashboard on which you are only seeing partial data.
To display the performance metrics that you want to see for the queues, users, wrap-up codes, flows, or flow outcomes that are important to you, create dashboards. You can also create a dashboard to view web content such as streaming videos, real-time charts, news feeds, and social media. You can see a preview of your dashboards and open dashboards to edit or view from Performance > Workspace > Dashboards > Dashboards. Create a display for your contact center by viewing your dashboard in full-screen mode.
Widgets display metrics and visual information on your dashboard. For Metric and Chart widgets, select which queues, users, wrap-up codes, flows, or flow outcomes to use for the widget. Then select the metrics, date span, and media types you want to see in the dashboard. You can add color-changing warnings to let you know when metrics are above or below a specified level. To bring interactive content into your dashboard, add a Web Content widget and specify a URL.
- You can only edit the dashboards that you create and own.
- Only the user that creates and owns the dashboard can make it public or private.
- For the old dashboards, the Share option, which allows sharing with work teams and/or individuals is not available. The functionality to make these dashboards public or private remains unaffected. The dashboards created in the new responsive UI or converted to the new responsive UI can be shared with selected users or work teams.
- Click Performance > Workspace > Dashboards > Dashboards.
- Click New Dashboard. The New Dashboard dialog box appears.
- In the Title, enter a name for the dashboard, and then click Save. The dashboard appears in the default state without any widgets. To add a widget, refer to Add widgets to a dashboard section in this article.
- Each user can create up to 20 dashboards.
- The number of public dashboards that you can access is unlimited.
- Click Performance > Workspace > Dashboards > Dashboards. The dashboard summary page appears.
- Click the more icon corresponding to the dashboard and click Duplicate. A copy of the dashboard appears below the original dashboard.
To rename a dashboard from the Performance Dashboard summary page:
- Click Performance > Workspace > Dashboards > Dashboards. The dashboard summary page appears.
- Click the more icon corresponding to the dashboard and click Rename. The Rename Dashboard dialog box appears.
- In the Title, enter a name for the dashboard.
- Click Save.
To rename a dashboard from the Performance Dashboard detail page:
- Click Performance > Workspace > Dashboards > Dashboards. The dashboard summary page appears.
- Click the corresponding dashboard to rename. The edit dashboard page appears.
- Click the more icon next to the dashboard name and click Rename. The Rename Dashboard dialog box appears.
- In the Title, enter a name for the dashboard.
- Click Save.
- Click Performance > Workspace > Dashboards > Dashboards. The dashboard summary page appears.
- Click the corresponding dashboard for editing. The edit dashboard page appears.
When you edit the old dashboard, the Preview Dashboard option appears at the lower right corner of the edit dashboard page.
To permanently view your old dashboard in the new dashboard format:
- In the edit dashboard page, click Preview Dashboard. Your old dashboard appears in the new dashboard format.
- Click Stay Here at the lower right corner of the new dashboard format page. Your dashboard permanently changes to the new dashboard format. Note: You cannot change the dashboard view to the old format after clicking Stay Here. To continue viewing your dashboard in the old dashboard format, click Go Back at the lower right corner of the new dashboard format page.
To continue using the old dashboard format, in the edit dashboard page, click Remind Me Later at the lower right corner of the page.
Administrators can access and manage public, private, and shared dashboards created by all users in an organization. The dashboard summary page lists all the users in the organization who have dashboards. The administrators can bulk delete dashboards of a single user or multiple users to control the total number of dashboards within the organization. The administrators can delete up to 100 dashboards at a time.
To delete multiple dashboards from the Performance Dashboard summary page:
- Click Performance > Workspace > Dashboards > Dashboards. The dashboard summary page appears.
- Select the required dashboards.
- Click Delete dashboards to delete all the selected dashboards.
To delete a single dashboard from the Performance Dashboard summary page:
- Click Performance > Workspace > Dashboards > Dashboards. The dashboard summary page appears.
- Click the more icon corresponding to the dashboard and click Delete.
To delete a dashboard from the Performance Dashboard detail page:
- Click Performance > Workspace > Dashboards > Dashboards. The dashboard summary page appears.
- Click the corresponding dashboard to delete. The edit dashboard page appears.
- Click the more icon next to the dashboard name and click Delete. The Delete dashboards dialog box appears.
- Click Delete.
You can also bulk delete dashboards from the Dashboard owners page. For more information, see Performance dashboard owners.
Widgets display metrics and visual information about the queues, users, wrap-up codes, flows, and flow outcomes that you choose. You can add up to seven rows of widgets, and each row can include up to seven single-cell widgets or one full-width widget. For more information about adding more rows of single-cell or full-width widgets to your dashboard, see the Edit layout section in this article.
When you work with widgets, you can click the following to drill down to its corresponding performance view.
- Queue Name – Opens the Queue Performance Detail view for the specific queue and the selected time period.
- Agent name – Opens the Agent performance tab associated with the selected agent.
- Wrap-up code – Opens the Wrap-up performance summary. For this view, the wrap-up code filter applies.
- Flow – Opens the Flow performance view associated with the selected flow.
- Flow outcome – Opens the Flow outcome performance summary view. For this view, the flow outcome filter applies.
Add a widget to the dashboard
- Click Performance > Workspace > Dashboards > Dashboards. The dashboard summary page appears.
- Click the corresponding dashboard to edit. The edit dashboard page appears.
- Click Add Widget. Note: To edit old dashboards, click Toggle edit mode on the upper right corner and then click No widgets added yet.
- In the Widget Title, enter the name of the widget.
- Select the type of widget that you want to create.
- Configure the widget. For more information, see the Configure the widget section in this article.
- Click Save.
- To add a single-cell or full-width widget, select Metric, Text, Chart, Web Content, or Agent Status.
- If you do not enter a name for a Metric or Chart widget, the widget name defaults to the metric you first select as you configure the widget. If you select a different metric, then the widget’s name does not update.
Configure the widget
This section describes how to configure and add filters to metric or chart widgets, web content, and agent status widgets.
Configure a metric widget
To configure a metric widget:
- Click Add Widget.
- In the Widget Title, enter the name of the widget.
- Select the Widget Type as Metric.
- Under Filter By, click Add.
- Select one of the following:
- Queue, and in the Select field, type the queue’s name and select one or more queues from the list that appears.
- User, and in the Add users by criteria field, choose one of the following:
- Individual users to view the list of users, and in the Select field, type the user’s name and select one or more users from the list that appears. Note: To include inactive users, choose Include inactive users. To include deleted users, choose Include deleted users.
- Users of a specific work team to view the list of users reporting to a specific work team, and in the Work Team field, type the work team’s name and select the required work team from the list that appears.
- Users who report to a specific user to view the list of users reporting to a specific user, and in the Reports to field, type the user’s name and select the required user from the list that appears.
- Individual users to view the list of users, and in the Select field, type the user’s name and select one or more users from the list that appears.
- Work Team, and in the Select field, type the work team’s name and select one or more work teams from the list that appears.
- Wrap-up, and in the Select field, type the wrap-up’s name and select one or more wrap-ups from the list that appears.
- Flow, and in the Select field, type the flow’s name and select one or more flows from the list that appears.
- Flow outcome, and in the Select field, type the flow outcome’s name and select one or more flow outcomes from the list that appears. Note: You can select up to 100 queues to filter by in a widget. A message displays upon reaching the limit.
- Click Add.
- Under Metric(s), click Add.
- Select Count-based, Percentage-based, or Time-based metrics. You can add up to five metrics of the same type to the Metric and Chart widgets.
- Under Time Period, select the date span interval for the specific widget, or click Compare two time periods and select two date spans. Note: For the chart widgets, only one date span is available.
- Choose the required Options. Note: For old dashboards, perform the following steps: To change a metric’s color when it is above or below a certain number, click More and from the menu that appears, select Warnings. Click Add warning . Specify above or below, the number, and the color that you want the metric to turn when it meets those criteria. To add warnings to a newly created metric or chart widget, see Add a warning to a metric or chart widget section in this article.
- Choose the required Media Type as Voice, Callback, Chat, Email, and Message.
- Click Save.
-
- For chart widgets, under Options, select Split filters to display each queue, user, wrap-up code, flow, or flow outcome separately instead of together as one bar. For metric widgets, under Options, select Split filters to display each queue, user, wrap-up code, flow, or flow outcome as its own row in the widget.
- If you do not select any media types, the widget displays information for all media types.
- Date Span intervals for Metric and Chart widgets are: Today, Yesterday, This week, Last week, This month, Last month, Past 7 days to date, Past 30 days to date. Metric widgets also have the Date Span interval Current interval.
- For Metric widgets, you can select up to two Date Span intervals to display in your dashboard.
- Depending on the metric you select when configuring the widget, the following options are available: Split by media type, Show aggregates, and Show profile picture. Selecting multiple queues as filters disables show aggregates. Selecting multiple metrics as filters disables the Split Filter option.
- If you select the Waiting or Interactions metric, the following options are available: Display as table, and Show longest. When you select Display as table, the table only shows the top 10 interactions.
- When you choose two Date Span options, you can select Show percentage change to display the percentage change between the two intervals.
Configure a chart widget
To configure a chart widget:
- Click Add Widget.
- In the Widget Title, enter the name of the widget.
- Select the Widget Type as Chart.
- Under Filter By, click Add.
- Select either the queues, users, wrap-up, flows, or flow outcomes. Note: To include inactive users, choose Include inactive users. To include deleted users, choose Include deleted users.
- In the Select field, begin typing the name of the queues, users, wrap-up, flows, or flow outcomes you want to add. Select one or more from the list that appears.
Note: You can select up to 100 queues to filter by in a widget. A message displays upon reaching the limit. - Click Add.
- Under Metric(s), click Add.
- Select Count-based, Percentage-based, or Time-based metrics. You can add up to five metrics of the same type to the Metric and Chart widgets.
- Under Time Period, select the date span interval for the specific widget, or click Compare two time periods and select two date spans. Note: For the chart widgets, only one date span is available.
- Choose the required Options. Note: For old dashboards, perform the following steps: To change a metric’s color when it is above or below a certain number, click More and from the menu that appears, select Warnings. Click Add warning . Specify above or below, the number, and the color that you want the metric to turn when it meets those criteria. To add warnings to a newly created metric or chart widget, see Add a warning to a metric or chart widget section in this article.
- Choose the required Media Type as Voice, Callback, Chat, Email, and Message.
- Click Save.
-
- For chart widgets, under Options, select Split filters to display each queue, user, wrap-up code, flow, or flow outcome separately instead of together as one bar. For metric widgets, under Options, select Split filters to display each queue, user, wrap-up code, flow, or flow outcome as its own row in the widget.
- If you do not select any media types, the widget displays information for all media types.
- Date Span intervals for Metric and Chart widgets are: Today, Yesterday, This week, Last week, This month, Last month, Past 7 days to date, Past 30 days to date. Metric widgets also have the Date Span interval Current interval.
- For Metric widgets, you can select up to two Date Span intervals to display in your dashboard.
- Depending on the metric you select when configuring the widget, the following options are available: Split by media type, Show aggregates, and Show profile picture. Selecting multiple queues as filters disables show aggregates. Selecting multiple metrics as filters disables the Split Filter option.
- If you select the Waiting or Interactions metric, the following options are available: Display as table, and Show longest. When you select Display as table, the table only shows the top 10 interactions.
- When you choose two Date Span options, you can select Show percentage change to display the percentage change between the two intervals.
Add a warning to a metric or chart widget
To add warnings to a metric or chart widget:
- Click the more icon to the corresponding widget to add warnings.
- Click Warnings. The add warning dialog box appears.
- Click Add Warning.
- Specify above or below, the number, and the color that you want the metric to turn when it meets those criteria. Note: For the chart widget, the color of the target line is set based on the threshold definition.
- Click Save.
Configure a text widget
To configure a text widget:
- Click Add Widget.
- In the Widget Title, enter the name of the widget.
- Select the Widget Type as Text.
- From the Default drop-down menu, choose the required color.
- In Display Text, enter the required text.
- Click Save.
Configure a web content widget
To configure a Web Content widget:
- Click Add Widget.
- In the Widget Title, enter the name of the widget.
- Select the Widget Type as Web Content.
- In the URL, enter the Web content URL. Note: Use a secure (HTTPS) URL, and the URL that your reference must support and allow being iFramed.
- Click Save.
Configure an agent status widget
To configure an agent status widget:
- Click Add Widget.
- In the field provided, enter a Widget Title.
- Select the Widget Type as Agent Status.
- Under Filter By, click Add.
- Select Queue or User. Note: On selecting the users, choose Include inactive users to include the inactive users to the user list or Include deleted users to include the deleted users to the user list.
- In the Select field, begin typing the name of the queues or user. Select one or more from the list that appears.
- Click Add.Note: If you filter for users, you cannot filter for queues, and vice versa.
- Select Queue or User.
- From the Statuses list, select the relevant statuses, or click Select All to add all statuses.
- To sort the agent interactions from shortest interaction duration to longest interaction duration, then from the Sort agent interactions by list, select Shortest to longest. To sort the agent interactions from longest interaction duration to shortest interaction duration, select Longest to shortest. Note: This option applies to agents with active interactions.
- Under Options, select one or more of the following options:
- Display as table – Displays the agent status widget data in a table.
- Show offline agents – Includes agents that are offline from the table.
- Show time in status – Includes the Time in column from the table.
- Click Save.
To edit previously created widgets:
- Click Performance > Workspace > Dashboards > Dashboards. The dashboard summary page appears.
- Click the corresponding dashboard for editing. The edit dashboard page appears. Note: For old dashboards, hover over a dashboard and click Edit dashboard .
- Click the more icon corresponding to the widget to edit.
- Click Edit. The edit widget appears.
- New dashboard:
- In the Agent status widget, under the Duration column, the interaction with the shortest duration is displayed at the top by default.
- To see all the interactions handled by the agent, click View All under Duration of the respective agent. You can click the respective interaction to navigate to the interaction detail view to explore the cause of the longest or shortest interaction duration.
- To sort the time in status of the agents, click the arrow next to the Duration column.
- Old dashboard:
- In the Agent status widget, under the Duration column, the interaction with the longest duration is displayed at the top by default.
- To sort the time in status of the agents, click the arrow next to the Time in Status column.
Add a new widget that has the same settings as another widget. For example, if you want to add a widget with the same users, media types, and date span as a current widget but with a different metric, you can copy the widget and change the metric.
- Click Performance > Workspace > Dashboards > Dashboards. The dashboard summary page appears.
- Click the corresponding dashboard for editing. The edit dashboard page appears. Note: For old dashboards, hover over a dashboard and click Edit dashboard .
- Click the more icon corresponding to the widget to copy.
- Click Duplicate.
If the number of visible widgets reaches the grid size limit, Duplicate is not available. For more information about adding more rows to your dashboard, see the Edit layout section in this article.
To move and organize widgets on your dashboard.
- Click Performance > Workspace > Dashboards > Dashboards. The dashboard summary page appears.
- Click the corresponding dashboard for editing. The edit dashboard page appears. Note: For old dashboards, hover over a dashboard and click Edit dashboard .
- To move widgets around on your dashboard, click the top bar on the widget and drag and drop it.
You can move up to seven single-cell widgets to a row, or one full-width widget to a row. To change the grid size to fit more single-cell widgets in a row, see the Edit layout section in this article.
Change the grid size to choose the number of single-cell or full-width widgets to display on a dashboard. By default, the grid size is 3 x 4, which allows you to have four rows of up to three single-cell widgets or one full-width widget per row. You can display up to seven rows and seven single-cell widgets or one full-width widget in each row.
To edit the layout:
- Click Performance > Workspace > Dashboards > Dashboards. The dashboard summary page appears.
- Click the corresponding dashboard for editing. The edit dashboard page appears. Note: For old dashboards, hover over a dashboard and click Edit dashboard .
- Click Edit Layout and then select the layout that you want. Note: To change the grid size of the old dashboards, click Grid Size . Then select the grid size that you want.
You cannot select a grid size smaller than the current grid size that you are using. In the grid size selector, squares with a circle indicate which sections of the dashboard grid already have a widget.
Public access is sharing the permission organizationally wide. Only if a person is given permission, that person accesses the widgets. A person who does not have access to the specified permission and division cannot view the widgets in a dashboard. A dashboard can have users, queues, flows, flow outcomes, and wrap-ups. Each dashboard item has permission and division requirements. For example, Jane Doe added a metric widget belonging to Division 1. James added a metric widget belonging to Division 2. If James makes his dashboard public and does not give access to Jane to view the widgets in Division 2, then Jane cannot view James’s dashboard.
You can only make the old dashboards public. The supervisors can share the performance dashboards with anyone within their organization, specific work teams, or users. For more information about performance dashboard sharing, see Share Performance dashboards.
You can add filters to restrict the person from accessing the dashboard. A yellow banner at the top of the view indicates limited access to the dashboard. If the person has no access to any widget in the dashboard, the dashboard is not visible to that person.
To make your dashboard visible to other users:
- Click Performance > Workspace > Dashboards > Dashboards.
- Hover over a dashboard and click Edit dashboard .
- Click Make dashboard public .
The public dashboard icon appears.
In the dashboard summary page, you can filter your dashboards to display the All, Public, Private, Shared, and Favorites dashboards. You can filter your dashboards based on dashboard ownership. To display only the dashboards that you own, choose the Owned by me filter. To display all the dashboards that you and others own or share, choose the Owned by anyone filter. To display the dashboards that others own and share, choose the Not owned by me filter.
To filter the dashboards by private, public, shared, and favorites:
- Click Performance > Workspace > Dashboards > Dashboards. The dashboard summary page appears.
- Click All filter.
- From the drop-down, select Public, Private, Shared, or Favorites.
To filter the dashboards based on ownership:
- Click Performance > Workspace > Dashboards > Dashboards. The dashboard summary page appears.
- Click Owned by anyone filter.
- From the drop-down, select the required ownership type as Owned by anyone, Owned by me, or Not owned by me.
To view your dashboard in full-screen mode:
- Click Performance > Workspace > Dashboards > Dashboards. The dashboard summary page appears.
- Click the dashboard that you want to view in full-screen mode. The edit dashboard page appears.
- In the upper right corner, click the Fullscreen button. The dashboard appears in full screen mode.
- To exit full-screen mode, press Escape.
Available Metrics
| Metric | Description |
|---|---|
| Metric | Description |
| Abandon | The number of times an end user abandoned an interaction in a queue. For example, the customer hangs up before an agent answers, or the system disconnects the interaction. |
| Abandon % | The percentage of offered interactions in which the customer disconnected before connecting with an agent. The abandon rate can identify queues that require extra staff to handle interactions in a timely manner. Calculated by: (Abandoned Count / Offered Count) * 100 |
| Alerting | The total number of alerting conversations. |
| Answer | A measurement of the number of assigned ACD interactions answered by an agent in a given period. Answered increments when the agent is the first to connect to the interaction. |
| Answer % | The percentage of offered interactions that an agent answered. Calculated by: (Answered / Offered) * 100 |
| ASA | The average amount of time an interaction waits in queue before an agent answers it. This metric does not include interactions that agents do not answer. ASA is directly associated with the service level and provides insight into the customer service your company provides. ASA is recorded in the interval in which the agent answered the interaction. Calculated by: Total Answered (tAnswered Sum) / Answered Count (tAnswered Count) Note: Raw values are provided in milliseconds. |
| Park | The number of emails parked by an agent. |
| Avg Park | The average amount of time an email was parked by an agent. |
| Max Park | The maximum amount of time an email was parked by an agent. |
| Min Park | The minimum amount of time an email was parked by an agent. |
| Total Park | The total amount of time an email was parked by an agent. |
| Avg ACW | The average amount of time agents spent completing after-call work. Calculated by: Total ACW / Interactions with ACW |
| Avg Handle | The average amount of time agents spent handling interactions. This calculation includes talk time, hold time, and after-call work. For outbound calls it also includes dialing and contacting time. Calculated by: (cumulative talk time + cumulative hold time + cumulative after-call work + cumulative dialing time + cumulative contacting time) / Number of interactions handled Note: The interactions can span multiple time intervals. For example, a 45-minute call spans two 30-minute intervals. However, metrics are assigned a single timestamp and reported in the interval into which this timestamp falls. The timestamps are assigned based on when the metric calculation is complete.
For instance, handle time will use the timestamp of after call work completion. In the example of a 45-minute call, the handle time falls in the second 30-minute interval because the handle time was calculated at the end of the call when ACW was submitted. |
| Avg Hold | The average number of seconds that interactions were placed on hold. Calculated by: Total Hold Time / Count of interactions with holds |
| Avg Talk | The average number of seconds spent interacting on a media type. Calculated by: Total Talk time / Count of interactions with Talk time |
| Avg Wait | The average amount of time an interaction is in a queue before an agent answers it, before the interaction moves out of the queue, or before the customer abandons the interaction. Calculated by: Total Wait Time / Interactions |
| Flow-Out | Flow-outs are interactions that enter and leave a queue without getting answered by an agent and without getting disconnected. Flow-outs are an indication of customer service level and queue productivity. High numbers of flow-outs can indicate staffing issues or ineffective agents when used with high handle times (bullseye matching metrics). Flow-outs can include transfers to voicemail, callbacks, and any system-driven events such as in-queue flows that transfer to another queue or external party after a certain amount of time. Flow-outs can also occur if the caller opts to exit out of the queue and return to the IVR. Offered interactions are either flow-out, answered, or abandoned interactions. |
| Flow-Out % | The percentage of offered interactions that enter and leave a queue without getting answered by an agent or disconnected. Calculated by: (Flow-Out Count / Offered Count) * 100 |
| Handle | The total number of ACD and non-ACD interactions that agents were involved in for the selected media type. Handle increments in the interval in which the interaction ends, after the agent completes any after call work and completes the interaction. |
| Hold | The number of interactions with holds. |
| Interactions | The number of interactions assigned to the queue that agents are currently interacting with. |
| Longest Interaction | The amount of time that the longest current active interaction in the queue has been interacting. |
| Offered | The number of interactions routed into the queue for an agent to answer. Offered interactions are either answered, abandoned, or flow-out interactions. |
|
Online Agents |
The number of agents that are online. |
| Outbound | This metric represents the number of outbound interactions placed on behalf of queue. |
| Service Level % | Service level target is a contact center performance statistic expressed as “X percent of conversations answered in Y seconds.” For example, a goal of answering 80% of voice calls within 20 seconds provides a service level target of 80/20. You can set the service level target for each media type in a queue. Analytics uses this service level target to calculate whether you are within the service level % defined by your service level agreement (SLA). For more information about setting the service level target, see Create queues or Edit or delete queues. Note: In the performance views that are not queue-specific, the Service Level % is calculated by queue and displayed as a – on the aggregated group row since SLA targets vary by queue. The affected views are DNIS Performance Summary and Skills Performance views. To view individual queue service level %, click the + to expand the row.
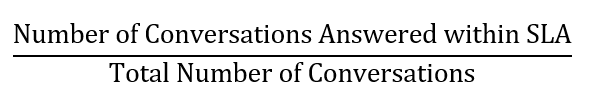
The service level % is the percentage of interactions that meet your contact center's service level target. The formula to calculate the service level % is:
Number of Conversations Answered within SLA The numerator is calculated by taking the total answered conversations and subtracting the conversations that were not answered within the SLA threshold. Calculated by: (Answered Count – SLA Violation Count) Total Number of Conversations The Service Level Options configuration determines the denominator. With all the options below unchecked, the denominator is the count of answered conversations.
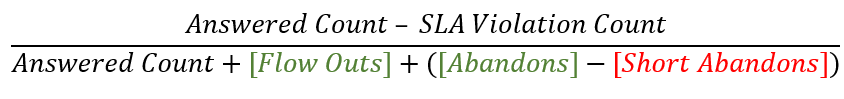
As the service level calculation depends on an organization’s configured options, the final formula to calculate the service level is:
Note: With the Flowouts and Abandons enabled, the Flowouts and the Abandons are added into the denominator when calculating the service level. With the Short Abandons disabled, the Short Abandons are subtracted from the Abandons when calculating the service level. |
| Total ACW | The cumulative time spent in after-call work (ACW) on all interactions. After-call work is the work that an agent performs immediately following an interaction. Work may involve keying activity codes, updating customer databases, filling out forms, or initiating outbound contact. As a metric, it indicates the total time an agent takes to finish working on a call. If an agent must complete work before the agent can handle the next contact, then ACW is factored into the average handle time. |
| Total Handle | The total amount of time agents spend on an interaction including time spent contacting, time spent dialing, talk time, hold time, and after call work. |
| Total Hold | The cumulative hold time for all interactions. |
| Total Talk | The total amount of time spent interacting on all the conversations by the agent, within an interval. For example, in an interaction, where an agent accepts an interaction, talks to the customer for two minutes, places the customer on hold for one minute, and then talks to the customer again for two minutes, the Total Talk equals 4 minutes. |
| Transferred | A measurement of the number of interactions an agent answered in one queue and then transferred. A transfer counts for the queue in which an agent answers the interaction. This measurement is calculated by the number of interactions blind transferred or consult transferred. |
| Waiting | The number of interactions that waited in the queue. |
| Longest Waiting | The amount of time that the longest-waiting interaction has been waiting in queue. |
| Available Agents | The number of agents off queue and in the Available status. |
| Away Agents | The number of agents off queue and in the Away status. |
| Break Agents | The number of agents off queue and in the Break status. |
| Meal Agents | The number of agents off queue and in the Meal status. |
| Training Agents | The number of agents off queue and in the Training status. |
| Busy Agents | The number of agents off queue and in the Busy status. |
| Meeting Agents | The number of agents off queue and in the Meeting status. |
| On Queue Agents | The On Queue metric represents the number of agents that are on queue for a specific queue. |
| Off Queue Agents | Off Queue represents the number of agents that are off queue for a specific queue. These agents are in another status, such as Available, Busy, or Meeting. Agents in the Out of Office and Offline statuses are not included in this number. |
| Communicating Agents | The agent is on a non-ACD call, and, in relation to agent utilization and call routing, Genesys Cloud treats the non-ACD call like an ACD call. For example, administrators could configure agent utilization so Genesys Cloud does not route new interactions to agents while they are on an ACD or non-ACD call. This status only appears if administrators have selected “Count non-ACD calls in utilization capacity” within the agent utilization configuration. |
| Idle Agents | The number of agents who are on queue and available to take interactions but who are not working with interactions. |
| Interacting Agents | The number of agents working with interactions. This number includes agents completing after call work. |
| Not Responding Agents | An agent was On Queue or Interacting and did not answer an offered interaction. The agent could still be handling and completing other previous interactions. While Not Responding, the agent does not receive new interactions. |
| Offline Agents | The number of agents off queue and offline. |
| Transfer % | The number of transfers compared with the total number of interactions answered. Calculated by: (No. of transfers / interactions answered) * 100 |
| Max Abandon | The maximum time of an abandoned interaction for the selected interval. |
| Min Abandon | The minimum time of an abandoned interaction for the selected interval. |
| Max Wait | The maximum amount of time spent waiting in queue for the selected interval. |
| Min Wait | The minimum amount of time spent waiting in queue for the selected interval. |
| Max Talk | The maximum amount of time spent interacting for the selected interval. |
| Min Talk | The minimum amount of time spent interacting for the selected interval. |
| Max Hold | The maximum amount of time spent on hold for the selected interval. |
| Min Hold | The minimum amount of time spent on hold for the selected interval. |
| Max ACW | The maximum amount of time spent on after call work for the selected interval. |
| Min ACW | The minimum amount of time spent on after call work for the selected interval. |
| Over SLA | Number of interactions that were over the defined Service Level. |
| Short Abandon | Number of interactions that were short abandoned. |
| Short Abandon % | Percent of interactions that were short abandoned. |
| Abandon – No Short | Number of abandons excluding the short abandons. |
| Abandon – No Short % | Percent of abandons excluding the short abandons. |
| Outbound Attempt | Attempted outbound interactions for Dialer campaigns. |
| Voicemail | Count of voicemails received. |
| Total Off Queue | Total Off Queue represents the number of agents that are off queue for a specific queue. These agents are in another status, such as Available, Busy, Away, Break, Meal, Meeting, or Training. Agents in the Out of Office and Offline statuses are not included in this number. |
| Off Queue % | Off Queue % represents the percentage of agents that are off queue for a specific queue. These agents are in another status, such as Available, Busy, Away, Break, Meal, Meeting, or Training. Agents in the Out of Office and Offline statuses are not included in this percentage. |
| Total Available | The total time spent in the Available status for the specified period. |
| Available % | The percentage of time spent in the Available status for the specified period. |
| Total Busy | The total time spent in the Busy status for the specified period. |
| Busy % | The percentage of time spent in the Busy status for the specified period. |
| Total Away | The total time spent in the Away status for the specified period. |
| Away % | The percentage of time spent in the Away status for the specified period. |
| Total Break | The total time spent in the Break status for the specified period. |
| Break % | The percentage of time spent in the Break status for the specified period. |
| Total Meal | The total time spent in the Meal status for the specified period. |
| Meal % | The percentage of time spent in the Meal status for the specified period. |
| Total Meeting | The total time spent in the Meeting status for the specified period. |
| Meeting % | The percentage of time spent in the Meeting status for the specified period. |
| Total Training | The total time spent in the Training status for the specified period. |
| Training % | The percentage of time spent in the Training status for the specified period. |
| Total Interacting | The total time that the agent was handling interactions. |
| Interacting % | The percentage of time that the agent was handling interactions. |
| Total Communicating | The total amount of time the agent is on a non-ACD call, and, in relation to agent utilization and call routing, Genesys Cloud treats the non-ACD call like an ACD call. For example, administrators could configure agent utilization so Genesys Cloud does not route new interactions to agents while they on an ACD or non-ACD call. This status only appears if administrators have selected “Include non-ACD conversations” when they configured agent utilization. |
| Communicating % | The percentage of time the agent is on a non-ACD call, and, in relation to agent utilization and call routing, Genesys Cloud treats the non-ACD call like an ACD call. For example, administrators could configure agent utilization so Genesys Cloud does not route new interactions to agents while they on an ACD or non-ACD call. This status only appears if administrators have selected “Include non-ACD conversations” when they configured agent utilization. |
| Total System Away | The total time spent during the specified period in the Away status when Genesys Cloud automatically sets the user's status to Away due to inactivity. |
| System Away % | The percentage of time spent during the specified period in the Away status when Genesys Cloud automatically sets the user's status to Away due to inactivity. |
| Total On Queue | The Total On Queue metric represents the total number of agents that are on queue for a specific queue. |
| On Queue % | The On Queue % metric represents the percentage of agents that are on queue for a specific queue. |
| Total Idle | The total time agents who are On Queue and able to take interactions but are not working with interactions. |
| Idle % | The percentage of time agents who are On Queue and able to take interactions but are not working with interactions. |
| Total Not Responding | The total amount of time an agent spends in the Not Responding routing status after not accepting an interaction. The Not Responding routing status is when an agent was On Queue or Interacting and did not answer an offered interaction. The agent could still be handling and completing other previous interactions. While Not Responding, the agent does not receive new interactions. |
| Not Responding % | The percentage of time an agent spends in the Not Responding routing status after not accepting an interaction. The Not Responding routing status is when an agent was On Queue or Interacting and did not answer an offered interaction. The agent could still be handling and completing other previous interactions. While Not Responding, the agent does not receive new interactions. |
| Total Logged In | The total amount of time a user is logged in for the specified period. |
| Occupancy | The percentage of time that call agents spend handling incoming calls against the available or idle time. |
| Met SLA | Number of interactions that met the defined service level. |
| After-call work (ACW) | The number of times after-call work (ACW) was completed. After-call work is the work that an agent performs immediately following an interaction. Work may involve keying activity codes, updating customer databases, filling out forms, or initiating outbound contact. As a metric, it indicates the total time an agent takes to finish working on a call. If an agent must complete work before the agent can handle the next contact, then ACW is factored into the average handle time. |
| Avg ACW Handled | The average time any interaction spent in ACW. This calculation takes into account all interactions handled, not just those that had ACW. Calculated by: Total ACW Time / Number of Interactions Handled |
| Avg contacting | The average amount of time an outbound interaction takes to connecting to the agent’s phone. Usually, this duration is short. However, if the agent uses a remote phone the duration may be longer. |
| Avg dialing | The average amount of time an agent spends dialing and waiting for a contact to answer during outbound interactions.
Calculated by: (total dialing time/ total number of dialing segments) |
| Avg Flow-Out | The average amount of time an interaction spends in queue before it flows out. Calculated by: Total Flow Out Time / Count of interactions with flow-outs For more information, see Queues Performance Summary view. |
| Avg Hold Handled | The average time any interaction spent on hold. This calculation takes into account all interactions handled, not just those that were held. Calculated by: Total Hold Time / Number of Interactions Handled. |
| Blind Transfer | The number of interactions an agent answered in one queue and then blind transferred. A blind transfer counts for the queue in which an agent answers the interaction. |
| Blind Transfer % | The percentage of interactions an agent answered in one queue and then blind transferred. |
| Connection | The number of interactions that initially connected to the contact center in a particular location, such as a queue or IVR. |
| Consult | The number of interactions an agent answered and then consulted with another participant with or without fully transferring the interaction. A consult counts for the queue in which an agent answers the interaction, even if they consult with another queue. |
| Consult Transfer | The number of call interactions an agent answered in one queue and then consult transferred, meaning they connected with a person or queue before transferring the call. A consult transfer counts for the queue in which an agent answers the interaction. See Consult transfer a call. |
| Consult Transfer % | The percentage of interactions an agent answered in one queue and then consult transferred. |
| Contacting | The number of contacting segments for the queue and interval. |
| Dialing | The number of dialing segments for the queue and interval. |
| Error | The number of errors that occurred on the queue conversations. |
| Inbound Media | The count of inbound media for an interaction. |
| Max Flow-Out | The maximum amount of time an interaction spends in queue before it flows out. For more information, see Queues Performance Summary view. |
| Min Flow-Out | The minimum amount of time an interaction spends in queue before it flows out. For more information, see Queues Performance Summary view. |
| Outbound Media | The number of outbound media for an interaction. Indicates when message-type conversations have media (images, files, and so on) attached. |
| Service Level Target % |
Service level target is a contact center performance statistic expressed as “X percent of contacts answered in Y seconds.” For example, a goal of answering 80% of voice calls within 20 seconds provides a service level target of 80/20. You can set the service level target for each media type in a queue. Analytics uses this service level target to calculate whether you are within the service level % defined by your service level agreement (SLA). For more information about setting the service level target, see Create queues or Edit or delete queues. Note: In the skill group row, the Service Level target displays a –. To view individual queue service level target values for each queue, click the + to expand the row.
|
| Talk | The number of sessions where the user(s) interacted during conversations. A session includes the point where the agent joins the conversation to the point where they disconnect. |
| Total contacting | The total amount of time outbound interactions take to connect to the agent’s phone. Usually, this duration is short. However, if the agent uses a remote phone the duration may be longer. |
| Total dialing | The total amount of time an outbound interaction spends dialing a contact. |
| Total wait | The total amount of time an interaction is in a queue before an agent answers it, it flows out, or the customer abandons it. Genesys Cloud calculates the wait time in milliseconds. |
| Wait | The number of interactions that waited in the queue. |
| Total Abandon | The total amount of time interactions are in queue waiting for an agent to answer them before customers abandoned the interactions. |
| Metric | Description |
|---|---|
| Metric | Description |
| Alerted | The number of times agents receive an alert for interactions. |
| Answer | A measurement of the number of assigned ACD interactions answered by an agent in a given period. Answered increments when the agent is the first to connect to the interaction. |
| Answer % | The percentage of offered interactions that an agent answered. Calculated by: (Answered / Offered) * 100 |
| Available % | The percentage of time spent in the Available status for the specified period. |
| Avg ACW | The average amount of time agents spent completing after-call work. Calculated by: Total ACW / Interactions with ACW |
| Avg Alert | The average amount time Genesys Cloud alerts agents before the agent accepts or declines an interaction. |
| Avg Handle | The average amount of time agents spent handling interactions. This calculation includes talk time, hold time, and after-call work. For outbound calls it also includes dialing and contacting time. Calculated by: (cumulative talk time + cumulative hold time + cumulative after-call work + cumulative dialing time + cumulative contacting time) / Number of interactions handled Note: The interactions can span multiple time intervals. For example, a 45-minute call spans two 30-minute intervals. However, metrics are assigned a single timestamp and reported in the interval into which this timestamp falls. The timestamps are assigned based on when the metric calculation is complete.
For instance, handle time will use the timestamp of after call work completion. In the example of a 45-minute call, the handle time falls in the second 30-minute interval because the handle time was calculated at the end of the call when ACW was submitted. |
| Avg Hold | The average number of seconds that interactions were placed on hold. Calculated by: Total Hold Time / Count of interactions with holds |
| Avg Talk | The average number of seconds spent interacting on a media type. Calculated by: Total Talk time / Count of interactions with Talk time |
| Away % | The percentage of time spent in the Away status for the specified period. |
| Break % | The percentage of time spent in the Break status for the specified period. |
| Busy % | The percentage of time spent in the Busy status for the specified period. |
| Communicating % | The percentage of time the agent is on a non-ACD call. For more information about how utilization affects agents that handle both ACD and non-ACD conversations, see Agent utilization. |
| Handle | The total number of ACD and non-ACD interactions that agents were involved in for the selected media type. Handle increments in the interval in which the interaction ends, after the agent completes any after call work and completes the interaction. |
| Hold | The number of interactions with holds. |
| Idle % | The percentage of time agents who are On Queue and able to take interactions but are not working with interactions. |
| Interacting % | The percentage of time that the agent was handling interactions. |
| Max ACW | The maximum amount of time spent on after call work for the selected interval. |
| Max Answer | The maximum amount of time an agent spent answering assigned ACD interactions for the selected interval. |
| Max Handle | The maximum amount of time agents were involved in ACD and non-ACD interactions, including answered interactions, transfers, callbacks, and outbound calls. |
| Max Hold | The maximum amount of time spent on hold for the selected interval. |
| Max Talk | The maximum amount of time spent interacting for the selected interval. |
| Meal % | The percentage of time spent in the Meal status for the specified period. |
| Meeting % | The percentage of time spent in the Meeting status for the specified period. |
| Min ACW | The minimum amount of time spent on after call work for the selected interval. |
| Min Answer | The minimum amount of time an agent spent answering assigned ACD interactions for the selected interval. |
| Min Handle | The minimum amount of time agents were involved in ACD and non-ACD interactions, including answered interactions, transfers, callbacks, and outbound calls. |
| Min Hold | The minimum amount of time spent on hold for the selected interval. |
| Min Talk | The minimum amount of time spent interacting for the selected interval. |
| Not Responding % | The percentage of time an agent spends in the Not Responding routing status after not accepting an interaction. The Not Responding routing status is when an agent was On Queue or Interacting and did not answer an offered interaction. The agent could still be handling and completing other previous interactions. While Not Responding, the agent does not receive new interactions. |
| Off Queue % | Off Queue % represents the percentage of agents that are off queue for a specific queue. These agents are in another status, such as Available, Busy, Away, Break, Meal, Meeting, or Training. Agents in the Out of Office and Offline statuses are not included in this percentage. |
| On Queue % | The On Queue % metric represents the percentage of an agent’s Logged In time that they are On Queue. |
| Scheduled Activity | The activity for which the user is currently scheduled, including On Queue Work, Break, Meal, Meeting, Off Queue Work, Time Off, Training, Unavailable, or Unscheduled. For more information on agent adherence, see Real-time adherence overview. |
| System Away % | The percentage of time spent during the specified period in the Away status when Genesys Cloud automatically sets the user's status to Away due to inactivity. |
| Total ACW | The cumulative time spent in after-call work (ACW) on all interactions. After-call work is the work that an agent performs immediately following an interaction. Work may involve keying activity codes, updating customer databases, filling out forms, or initiating outbound contact. As a metric, it indicates the total time an agent takes to finish working on a call. If an agent must complete work before the agent can handle the next contact, then ACW is factored into the average handle time. |
| Total Alert | The total time Genesys Cloud alerts agents before the agent accepts or declines an interaction. |
| Total Available | The total time spent in the Available status for the specified period. |
| Total Away | The total time spent in the Away status for the specified period. |
| Total Break | The total time spent in the Break status for the specified period. |
| Total Busy | The total time spent in the Busy status for the specified period. |
| Total Communicating | The total amount of time the agent is on a non-ACD call. For more information about how utilization affects agents that handle both ACD and non-ACD conversations, see Agent utilization. |
| Total Handle | The total amount of time agents spend on an interaction including time spent contacting, time spent dialing, talk time, hold time, and after call work. |
| Total Hold | The cumulative hold time for all interactions. |
| Total Idle | The total time agents who are On Queue and able to take interactions but are not working with interactions. |
| Total Interacting | The total time that the agent was handling interactions. |
| Total Logged In | The total amount of time a user is logged in for the specified period. |
| Total Meal | The total time spent in the Meal status for the specified period. |
| Total Meeting | The total time spent in the Meeting status for the specified period. |
| Total Not Responding | The total amount of time an agent spends in the Not Responding routing status after not accepting an interaction. The Not Responding routing status is when an agent was On Queue or Interacting and did not answer an offered interaction. The agent could still be handling and completing other previous interactions. While Not Responding, the agent does not receive new interactions. |
| Total Off Queue | The time spent in any status other than Offline and On Queue for the specified period. |
| Total On Queue | The time spent in the On Queue status for the specified period. |
| Total System Away | The total time spent during the specified period in the Away status when Genesys Cloud automatically sets the user's status to Away due to inactivity. |
| Total Talk | The total time spent talking/interacting on a conversation. |
| Total Training | The total time spent in the Training status for the specified period. |
| Training % | The percentage of time spent in the Training status for the specified period. |
| Transferred | A measurement of the number of interactions an agent answered in one queue and then transferred. A transfer counts for the queue in which an agent answers the interaction. This measurement is calculated by the number of interactions blind transferred or consult transferred. |
| After-call work (ACW) | The number of times after-call work (ACW) was completed. After-call work is the work that an agent performs immediately following an interaction. Work may involve keying activity codes, updating customer databases, filling out forms, or initiating outbound contact. As a metric, it indicates the total time an agent takes to finish working on a call. If an agent must complete work before the agent can handle the next contact, then ACW is factored into the average handle time. |
| Alert – No Answer | The number of times an agent was alerted to a conversation but did not answer the conversation. Note: This metric does not specifically count the number of times an agent was placed in a Not Responding routing status. An agent is transitioned to Not Responding status after a specific alert time threshold for ACD-routed conversations. Alert – No Answer can be incremented for all conversation types for any situation where an alert was not followed by an answer event. |
| Avg ACW Handled | The average time any interaction spent in ACW. This calculation takes into account all interactions handled, not just those that had ACW. Calculated by: Total ACW Time / Number of Interactions Handled |
| Average contacting | The average amount of time an outbound interaction takes to connecting to the agent’s phone. Usually, this duration is short. However, if the agent uses a remote phone the duration may be longer. |
| Average dialing | The average amount of time an agent spends dialing and waiting for a contact to answer during outbound interactions.
Calculated by: (total dialing time/ total number of dialing segments) |
| Avg Hold Handled | The average time any interaction spent on hold. This calculation takes into account all interactions handled, not just those that were held. Calculated by: Total Hold Time / Number of Interactions Handled. |
| Avg Monitor | Average time that the user spent monitoring interactions. |
| Blind Transfer | The number of interactions an agent answered in one queue and then blind transferred. A blind transfer counts for the queue in which an agent answers the interaction. |
| Blind Transfer % | The percentage of interactions an agent answered in one queue and then blind transferred. |
| Consult Transfer | The number of call interactions an agent answered in one queue and then consult transferred, meaning they connected with a person or queue before transferring the call. A consult transfer counts for the queue in which an agent answers the interaction. See Consult transfer a call. |
| Consult Transfer % | The percentage of interactions an agent answered in one queue and then consult transferred. |
| Contacting | The number of contacting segments for the queue and interval. |
| Dialing | The number of dialing segments for the queue and interval. |
| Error | The number of errors that occurred on the queue conversations. |
| Max Contacting | The maximum amount of time outbound interactions take to connect to the agent’s phone. Usually, this duration is short. However, if the agent uses a remote phone the duration may be longer. |
| Max Dialing | The maximum amount of time an outbound interaction spends dialing a contact. |
| Max Monitor | Maximum time that the user spent monitoring interactions. |
| Min Contacting | The minimum amount of time outbound interactions take to connect to the agent’s phone. Usually, this duration is short. However, if the agent uses a remote phone the duration may be longer. |
| Min Dialing | The minimum amount of time an outbound interaction spends dialing a contact. |
| Min Monitor | Minimum time that the user spent monitoring interactions. |
| Monitor | Number of interactions that were monitored. |
| Outbound | This metric represents the number of outbound interactions placed on behalf of queue. |
| Talk | The number of sessions where the user(s) interacted during conversations. A session includes the point where the agent joins the conversation to the point where they disconnect. |
| Total Alert – No Answer | The total number of seconds Genesys Cloud offered an agent an interaction before the agent declined the interaction or the interaction timed out. |
| Total contacting | The total amount of time outbound interactions take to connect to the agent’s phone. Usually, this duration is short. However, if the agent uses a remote phone the duration may be longer. |
| Total dialing | The total amount of time an outbound interaction spends dialing a contact. |
| Total Monitor | Total time that the user spent monitoring interactions. |
| Transfer % | The number of transfers compared to the total number of interactions answered. Calculated by: (# of transfers / Interactions Answered) * 100 |
| Metric | Description |
|---|---|
| Avg ACW | The average amount of time agents spent completing after-call work. Calculated by: Total ACW / Interactions with ACW |
| Avg Handle | The average amount of time agents spent handling interactions. This calculation includes talk time, hold time, and after-call work. For outbound calls it also includes dialing and contacting time. Calculated by: (cumulative talk time + cumulative hold time + cumulative after-call work + cumulative dialing time + cumulative contacting time) / Number of interactions handled Note: The interactions can span multiple time intervals. For example, a 45-minute call spans two 30-minute intervals. However, metrics are assigned a single timestamp and reported in the interval into which this timestamp falls. The timestamps are assigned based on when the metric calculation is complete.
For instance, handle time will use the timestamp of after call work completion. In the example of a 45-minute call, the handle time falls in the second 30-minute interval because the handle time was calculated at the end of the call when ACW was submitted. |
| Avg Hold | The average number of seconds that interactions were placed on hold. Calculated by: Total Hold Time / Count of interactions with holds |
| Avg Talk | The average number of seconds spent interacting on a media type. Calculated by: Total Talk time / Count of interactions with Talk time |
| Handle | The total number of ACD and non-ACD interactions that agents were involved in for the selected media type. Handle increments in the interval in which the interaction ends, after the agent completes any after call work and completes the interaction. |
| Total ACW | The cumulative time spent in after-call work (ACW) on all interactions. After-call work is the work that an agent performs immediately following an interaction. Work may involve keying activity codes, updating customer databases, filling out forms, or initiating outbound contact. As a metric, it indicates the total time an agent takes to finish working on a call. If an agent must complete work before the agent can handle the next contact, then ACW is factored into the average handle time. |
| Total Handle | The total amount of time agents spend on an interaction including time spent contacting, time spent dialing, talk time, hold time, and after call work. |
| Total Hold | The cumulative hold time for all interactions. |
| Total Talk | The total amount of time spent interacting on all the conversations by the agent, within an interval. For example, in an interaction, where an agent accepts an interaction, talks to the customer for two minutes, places the customer on hold for one minute, and then talks to the customer again for two minutes, the Total Talk equals 4 minutes. |
| Transferred | A measurement of the number of interactions an agent answered in one queue and then transferred. A transfer counts for the queue in which an agent answers the interaction. This measurement is calculated by the number of interactions blind transferred or consult transferred. |
| After-call work (ACW) | The number of times after-call work (ACW) was completed. After-call work is the work that an agent performs immediately following an interaction. Work may involve keying activity codes, updating customer databases, filling out forms, or initiating outbound contact. As a metric, it indicates the total time an agent takes to finish working on a call. If an agent must complete work before the agent can handle the next contact, then ACW is factored into the average handle time. |
| Max ACW | The maximum amount of time spent on after call work for the selected interval. |
| Max Handle | The maximum amount of time agents were involved in ACD and non-ACD interactions, including answered interactions, transfers, callbacks, and outbound calls. |
| Max Hold | The maximum amount of time spent on hold for the selected interval. |
| Max Talk | The maximum amount of time spent interacting for the selected interval. |
| Min Handle | The minimum amount of time agents were involved in ACD and non-ACD interactions, including answered interactions, transfers, callbacks, and outbound calls. |
| Min Hold | The minimum amount of time spent on hold for the selected interval. |
| Min Talk | The minimum amount of time spent interacting for the selected interval. |
| Talk | The number of sessions where the user(s) interacted during conversations. A session includes the point where the agent joins the conversation to the point where they disconnect. |
| Metric | Description |
|---|---|
| Outcome Attempts | The number of flow outcomes. |
| Failure | The number of flow outcomes that were failures. |
| Failure % | The percentage of failure outcomes compared with the total number of outcomes. |
| Total Flow | The total time entries spent in the flow. |
| Max Flow | The longest amount of time that an entry spent in the flow. |
| Avg Flow | The average amount of time that an entry spent in the flow. |
| Total Disconnect | The total amount of time an entry spent in a flow until it disconnected. |
| Avg Disconnect | The average amount of time until an entry disconnected in a flow. |
| Max Disconnect | The longest amount of time that an entry spent in the flow before disconnecting. |
| Total Exit | The total amount of time an entry spent in a flow until it exited the flow to another destination, such as an ACD queue, ACD voicemail, or user. |
| Max Exit | The longest amount of time that an entry spent in the flow before exiting. |
| Avg Exit | The average amount of time that an entry spent in a flow before exiting. |
| Avg Outcomes | The average number of flow outcomes per entries into the flow. Calculated by: number of flow outcomes / number of entries |
| Active | The number of currently active flows. |
| Average Milestones (count) | The average number of milestones per flow and flow outcome. |
| Milestones(count) | The total number of Milestones. |
| Metric | Description |
|---|---|
| Outcome Attempts | The number of flow outcomes. |
| Failure | The number of flow outcomes that were failures. |
| Failure % | The percentage of failure outcomes compared with the total number of outcomes. |
| Outcome Avg Duration | The average amount of time that a call spent in a flow and flow outcome. |
| Outcome Min Duration | The shortest amount of time that a call spent in a flow and flow outcome. |
| Outcome Max Duration | The longest amount of time that a call spent in a flow and flow outcome. |
| Outcome Total Duration | The total amount of time that calls spent in a flow and flow outcome. |
| Average Milestones (count) | The average number of milestones per flow and flow outcome. |
| Milestones(count) | The total number of Milestones. |
| Metric | Description |
|---|---|
| Metric | Description |
| Abandon | The number of times an end user abandoned an interaction in a queue. For example, the customer hangs up before an agent answers, or the system disconnects the interaction. |
| Abandon % | The percentage of offered interactions in which the customer disconnected before connecting with an agent. The abandon rate can identify queues that require extra staff to handle interactions in a timely manner. Calculated by: (Abandoned Count / Offered Count) * 100 |
| Answer | A measurement of the number of assigned ACD interactions answered by an agent in a given period. Answered increments when the agent is the first to connect to the interaction. |
| Answer % | The percentage of offered interactions that an agent answered. Calculated by: (Answered / Offered) * 100 |
| ASA | The average amount of time an interaction waits in queue before an agent answers it. This metric does not include interactions that agents do not answer. ASA is directly associated with the service level and provides insight into the customer service your company provides. ASA is recorded in the interval in which the agent answered the interaction. Calculated by: Total Answered (tAnswered Sum) / Answered Count (tAnswered Count) Note: Raw values are provided in milliseconds. |
| Avg ACW | The average amount of time agents spent completing after-call work. Calculated by: Total ACW / Interactions with ACW |
| Avg Handle | The average amount of time agents spent handling interactions. This calculation includes talk time, hold time, and after-call work. For outbound calls it also includes dialing and contacting time. Calculated by: (cumulative talk time + cumulative hold time + cumulative after-call work + cumulative dialing time + cumulative contacting time) / Number of interactions handled Note: The interactions can span multiple time intervals. For example, a 45-minute call spans two 30-minute intervals. However, metrics are assigned a single timestamp and reported in the interval into which this timestamp falls. The timestamps are assigned based on when the metric calculation is complete.
For instance, handle time will use the timestamp of after call work completion. In the example of a 45-minute call, the handle time falls in the second 30-minute interval because the handle time was calculated at the end of the call when ACW was submitted. |
| Avg Hold | The average number of seconds that interactions were placed on hold. Calculated by: Total Hold Time / Count of interactions with holds |
| Avg Talk | The average number of seconds spent interacting on a media type. Calculated by: Total Talk time / Count of interactions with Talk time |
| Avg Wait | The average amount of time an interaction is in a queue before an agent answers it, before the interaction moves out of the queue, or before the customer abandons the interaction. Calculated by: Total Wait Time / Interactions |
| Flow-Out | Flow-outs are interactions that enter and leave a queue without getting answered by an agent and without getting disconnected. Flow-outs are an indication of customer service level and queue productivity. High numbers of flow-outs can indicate staffing issues or ineffective agents when used with high handle times (bullseye matching metrics). Flow-outs can include transfers to voicemail, callbacks, and any system-driven events such as in-queue flows that transfer to another queue or external party after a certain amount of time. Flow-outs can also occur if the caller opts to exit out of the queue and return to the IVR. Offered interactions are either flow-out, answered, or abandoned interactions. |
| Flow-Out % | The percentage of offered interactions that enter and leave a queue without getting answered by an agent or disconnected. Calculated by: (Flow-Out Count / Offered Count) * 100 |
| Handle | The total number of ACD and non-ACD interactions that agents were involved in for the selected media type. Handle increments in the interval in which the interaction ends, after the agent completes any after call work and completes the interaction. |
| Hold | The number of interactions with holds. |
| Offered | The number of interactions routed into the queue for an agent to answer. Offered interactions are either answered, abandoned, or flow-out interactions. |
| Outbound | This metric represents the number of outbound interactions placed on behalf of queue. |
| Service Level % | Service level target is a contact center performance statistic expressed as “X percent of conversations answered in Y seconds.” For example, a goal of answering 80% of voice calls within 20 seconds provides a service level target of 80/20. You can set the service level target for each media type in a queue. Analytics uses this service level target to calculate whether you are within the service level % defined by your service level agreement (SLA). For more information about setting the service level target, see Create queues or Edit or delete queues. Note: In the performance views that are not queue-specific, the Service Level % is calculated by queue and displayed as a – on the aggregated group row since SLA targets vary by queue. The affected views are DNIS Performance Summary and Skills Performance views. To view individual queue service level %, click the + to expand the row.
The service level % is the percentage of interactions that meet your contact center's service level target. The formula to calculate the service level % is:
Number of Conversations Answered within SLA The numerator is calculated by taking the total answered conversations and subtracting the conversations that were not answered within the SLA threshold. Calculated by: (Answered Count – SLA Violation Count) Total Number of Conversations The Service Level Options configuration determines the denominator. With all the options below unchecked, the denominator is the count of answered conversations.
As the service level calculation depends on an organization’s configured options, the final formula to calculate the service level is:
Note: With the Flowouts and Abandons enabled, the Flowouts and the Abandons are added into the denominator when calculating the service level. With the Short Abandons disabled, the Short Abandons are subtracted from the Abandons when calculating the service level. |
| Total ACW | The cumulative time spent in after-call work (ACW) on all interactions. After-call work is the work that an agent performs immediately following an interaction. Work may involve keying activity codes, updating customer databases, filling out forms, or initiating outbound contact. As a metric, it indicates the total time an agent takes to finish working on a call. If an agent must complete work before the agent can handle the next contact, then ACW is factored into the average handle time. |
| Total Handle | The total amount of time agents spend on an interaction including time spent contacting, time spent dialing, talk time, hold time, and after call work. |
| Total Hold | The cumulative hold time for all interactions. |
| Total Talk | The total amount of time spent interacting on all the conversations by the agent, within an interval. For example, in an interaction, where an agent accepts an interaction, talks to the customer for two minutes, places the customer on hold for one minute, and then talks to the customer again for two minutes, the Total Talk equals 4 minutes. |
| Transferred | A measurement of the number of interactions an agent answered in one queue and then transferred. A transfer counts for the queue in which an agent answers the interaction. This measurement is calculated by the number of interactions blind transferred or consult transferred. |
| Transfer % | The number of transfers compared with the total number of interactions answered. Calculated by: (No. of transfers / interactions answered) * 100 |
| Max Abandon | The maximum time of an abandoned interaction for the selected interval. |
| Min Abandon | The minimum time of an abandoned interaction for the selected interval. |
| Max Wait | The maximum amount of time spent waiting in queue for the selected interval. |
| Min Wait | The minimum amount of time spent waiting in queue for the selected interval. |
| Max Talk | The maximum amount of time spent interacting for the selected interval. |
| Min Talk | The minimum amount of time spent interacting for the selected interval. |
| Max Hold | The maximum amount of time spent on hold for the selected interval. |
| Min Hold | The minimum amount of time spent on hold for the selected interval. |
| Max ACW | The maximum amount of time spent on after call work for the selected interval. |
| Min ACW | The minimum amount of time spent on after call work for the selected interval. |
| Over SLA | Number of interactions that were over the defined Service Level. |
| Short Abandon | Number of interactions that were short abandoned. |
| Short Abandon % | Percent of interactions that were short abandoned. |
| Abandon – No Short | Number of abandons excluding the short abandons. |
| Abandon – No Short % | Percent of abandons excluding the short abandons. |
| Outbound Attempt | Attempted outbound interactions for Dialer campaigns. |
| Voicemail | Count of voicemails received. |
| Met SLA | Number of interactions that met the defined service level. |
| Metric | Description |
|---|---|
| Alerted | The number of times agents receive an alert for interactions. |
| Answer | A measurement of the number of assigned ACD interactions answered by an agent in a given period. Answered increments when the agent is the first to connect to the interaction. |
| Answer % | The percentage of offered interactions that an agent answered. Calculated by: (Answered / Offered) * 100 |
| Avg ACW | The average amount of time agents spent completing after-call work. Calculated by: Total ACW / Interactions with ACW |
| Avg Alert | The average amount time Genesys Cloud alerts agents before the agent accepts or declines an interaction. |
| Avg Handle | The average amount of time agents spent handling interactions. This calculation includes talk time, hold time, and after-call work. For outbound calls it also includes dialing and contacting time. Calculated by: (cumulative talk time + cumulative hold time + cumulative after-call work + cumulative dialing time + cumulative contacting time) / Number of interactions handled Note: The interactions can span multiple time intervals. For example, a 45-minute call spans two 30-minute intervals. However, metrics are assigned a single timestamp and reported in the interval into which this timestamp falls. The timestamps are assigned based on when the metric calculation is complete.
For instance, handle time will use the timestamp of after call work completion. In the example of a 45-minute call, the handle time falls in the second 30-minute interval because the handle time was calculated at the end of the call when ACW was submitted. |
| Avg Hold | The average number of seconds that interactions were placed on hold. Calculated by: Total Hold Time / Count of interactions with holds |
| Avg Talk | The average number of seconds spent interacting on a media type. Calculated by: Total Talk time / Count of interactions with Talk time |
| Handle | The total number of ACD and non-ACD interactions that agents were involved in for the selected media type. Handle increments in the interval in which the interaction ends, after the agent completes any after call work and completes the interaction. |
| Hold | The number of interactions with holds. |
| Max ACW | The maximum amount of time spent on after call work for the selected interval. |
| Max Answer | The maximum amount of time an agent spent answering assigned ACD interactions for the selected interval. |
| Max Handle | The maximum amount of time agents were involved in ACD and non-ACD interactions, including answered interactions, transfers, callbacks, and outbound calls. |
| Max Hold | The maximum amount of time spent on hold for the selected interval. |
| Max Talk | The maximum amount of time spent interacting for the selected interval. |
| Min ACW | The minimum amount of time spent on after call work for the selected interval. |
| Min Answer | The minimum amount of time an agent spent answering assigned ACD interactions for the selected interval. |
| Min Handle | The minimum amount of time agents were involved in ACD and non-ACD interactions, including answered interactions, transfers, callbacks, and outbound calls. |
| Min Hold | The minimum amount of time spent on hold for the selected interval. |
| Min Talk | The minimum amount of time spent interacting for the selected interval. |
| Total ACW | The cumulative time spent in after-call work (ACW) on all interactions. After-call work is the work that an agent performs immediately following an interaction. Work may involve keying activity codes, updating customer databases, filling out forms, or initiating outbound contact. As a metric, it indicates the total time an agent takes to finish working on a call. If an agent must complete work before the agent can handle the next contact, then ACW is factored into the average handle time. |
| Total Alert | The total time Genesys Cloud alerts agents before the agent accepts or declines an interaction. |
| Total Handle | The total amount of time agents spend on an interaction including time spent contacting, time spent dialing, talk time, hold time, and after call work. |
| Total Hold | The cumulative hold time for all interactions. |
| Total Talk | The total amount of time spent interacting on all the conversations by the agent, within an interval. For example, in an interaction, where an agent accepts an interaction, talks to the customer for two minutes, places the customer on hold for one minute, and then talks to the customer again for two minutes, the Total Talk equals 4 minutes. |
| Transferred | A measurement of the number of interactions an agent answered in one queue and then transferred. A transfer counts for the queue in which an agent answers the interaction. This measurement is calculated by the number of interactions blind transferred or consult transferred. |
| Metric | Description |
|---|---|
| Avg ACW | The average amount of time agents spent completing after-call work. Calculated by: Total ACW / Interactions with ACW |
| Avg Handle | The average amount of time agents spent handling interactions. This calculation includes talk time, hold time, and after-call work. For outbound calls it also includes dialing and contacting time. Calculated by: (cumulative talk time + cumulative hold time + cumulative after-call work + cumulative dialing time + cumulative contacting time) / Number of interactions handled Note: The interactions can span multiple time intervals. For example, a 45-minute call spans two 30-minute intervals. However, metrics are assigned a single timestamp and reported in the interval into which this timestamp falls. The timestamps are assigned based on when the metric calculation is complete.
For instance, handle time will use the timestamp of after call work completion. In the example of a 45-minute call, the handle time falls in the second 30-minute interval because the handle time was calculated at the end of the call when ACW was submitted. |
| Avg Hold | The average number of seconds that interactions were placed on hold. Calculated by: Total Hold Time / Count of interactions with holds |
| Avg Talk | The average number of seconds spent interacting on a media type. Calculated by: Total Talk time / Count of interactions with Talk time |
| Handle | The total number of ACD and non-ACD interactions that agents were involved in for the selected media type. Handle increments in the interval in which the interaction ends, after the agent completes any after call work and completes the interaction. |
| Hold | The cumulative hold time for all interactions. |
| Total ACW | The cumulative time spent in after-call work (ACW) on all interactions. After-call work is the work that an agent performs immediately following an interaction. Work may involve keying activity codes, updating customer databases, filling out forms, or initiating outbound contact. As a metric, it indicates the total time an agent takes to finish working on a call. If an agent must complete work before the agent can handle the next contact, then ACW is factored into the average handle time. |
| Total Handle | The total amount of time agents spend on an interaction including time spent contacting, time spent dialing, talk time, hold time, and after call work. |
| Total Hold | The cumulative hold time for all interactions. |
| Total Talk | The total amount of time spent interacting on all the conversations by the agent, within an interval. For example, in an interaction, where an agent accepts an interaction, talks to the customer for two minutes, places the customer on hold for one minute, and then talks to the customer again for two minutes, the Total Talk equals 4 minutes. |
| Transferred | A measurement of the number of interactions an agent answered in one queue and then transferred. A transfer counts for the queue in which an agent answers the interaction. This measurement is calculated by the number of interactions blind transferred or consult transferred. |
| Metric | Description |
|---|---|
| Outcome Attempts | The number of flow outcomes. |
| Failure | The number of flow outcomes that were failures. |
| Failure % | The percentage of failure outcomes compared with the total number of outcomes. |
| Success | The number of flow outcomes that were a success. |
| Success % | The percentage of success outcomes compared with the total number of outcome attempts. |
| Entries | The total number of times that calls enter the flow or flow version. A call can enter a flow multiple times. |
| Total Flow | The total time entries spent in the flow. |
| Max Flow | The longest amount of time that an entry spent in the flow. |
| Avg Flow | The average amount of time that an entry spent in the flow. |
| Disconnect | The number of entries that disconnected in the flow. |
| Disconnect % | The percentage of entries that disconnected compared with the total number of entries. |
| Total Disconnect | The total amount of time an entry spent in a flow until it disconnected. |
| Avg Disconnect | The average amount of time until an entry disconnected in a flow. |
| Max Disconnect | The longest amount of time that an entry spent in the flow before disconnecting. |
| Exit | The number of entries that exited the flow to another destination, such as an ACD queue, ACD voicemail, or user. |
| Exit % | The percentage of exits compared with the total number of entries. |
| Total Exit | The total amount of time an entry spent in a flow until it exited the flow to another destination, such as an ACD queue, ACD voicemail, or user. |
| Max Exit | The longest amount of time that an entry spent in the flow before exiting. |
| Avg Exit | The average amount of time that an entry spent in a flow before exiting. |
| Avg Outcomes | The average number of flow outcomes per entries into the flow. Calculated by: number of flow outcomes / number of entries |
| Metric | Description |
|---|---|
| Outcome Attempts | The number of flow outcomes. |
| Failure | The number of flow outcomes that were failures. |
| Failure % | The percentage of failure outcomes compared with the total number of outcomes. |
| Success | The number of flow outcomes that were success. |
| Success % | The percentage of success outcomes compared with the total number of outcome attempts. |
| Outcome Avg Duration | The average amount of time that a call spent in a flow and flow outcome. |
| Outcome Min Duration | The shortest amount of time that a call spent in a flow and flow outcome. |
| Outcome Max Duration | The longest amount of time that a call spent in a flow and flow outcome. |
| Outcome Total Duration | The total amount of time that calls spent in a flow and flow outcome. |
| Metric | Description |
|---|---|
| Online Agents | The number of agents in the Online status. |
| Time in Status | The amount of time agents have been in their current primary status. |
| Duration | The amount of time an agent has been working on an interaction. If an agent works on multiple interactions, Genesys Cloud displays each interaction’s duration in the popover only in the new dashboard. |
| Available Agents | The number of agents in the Available status. |
| Away Agents | The number of agents in the Away status. |
| Break Agents | The number of agents in the Break status. |
| Meal Agents | The number of agents in the Meal status. |
| Training Agents | The number of agents in the Training status. |
| Busy Agents | The number of agents in the Busy status. |
| Meeting Agents | The number of agents in the Meeting status. |
| On Queue Agents | The number of agents in the On Queue status. |
| Off Queue Agents | The number of agents in the Off Queue status. |
| Communicating Agents | The number of agents in the Communicating status. |
| Idle Agents |
The number of agents in the Idle status. |
| Interacting Agents | The number of agents in the Interacting status. |
| Not Responding Agents | The number of agents in the Not Responding status. |
| Offline Agents | The number of agents in the Offline status. |
| After-call work (ACW) | The number of times after-call work (ACW) was completed. After-call work is the work that an agent performs immediately following an interaction. Work may involve keying activity codes, updating customer databases, filling out forms, or initiating outbound contact. As a metric, it indicates the total time an agent takes to finish working on a call. If an agent must complete work before the agent can handle the next contact, then ACW is factored into the average handle time. |
| Alert – No Answer | The number of times an agent was alerted to a conversation but did not answer the conversation. Note: This metric does not specifically count the number of times an agent was placed in a Not Responding routing status. An agent is transitioned to Not Responding status after a specific alert time threshold for ACD-routed conversations. Alert – No Answer can be incremented for all conversation types for any situation where an alert was not followed by an answer event. |
| Avg ACW Handled | The average time any interaction spent in ACW. This calculation takes into account all interactions handled, not just those that had ACW. Calculated by: Total ACW Time / Number of Interactions Handled |
| Average contacting | The average amount of time an outbound interaction takes to connecting to the agent’s phone. Usually, this duration is short. However, if the agent uses a remote phone the duration may be longer. |
| Average dialing | The average amount of time an agent spends dialing and waiting for a contact to answer during outbound interactions.
Calculated by: (total dialing time/ total number of dialing segments) |
| Avg Hold | The average number of seconds that interactions were placed on hold. Calculated by: Total Hold Time / Count of interactions with holds |
| Avg Hold Handled | The average time any interaction spent on hold. This calculation takes into account all interactions handled, not just those that were held. Calculated by: Total Hold Time / Number of Interactions Handled. |
| Avg Monitor | Average time that the user spent monitoring interactions. |
| Blind Transfer | The number of interactions an agent answered in one queue and then blind transferred. A blind transfer counts for the queue in which an agent answers the interaction. |
| Blind Transfer % | The percentage of interactions an agent answered in one queue and then blind transferred. |
| Consult Transfer | The number of call interactions an agent answered in one queue and then consult transferred, meaning they connected with a person or queue before transferring the call. A consult transfer counts for the queue in which an agent answers the interaction. See Consult transfer a call. |
| Consult Transfer % | The percentage of interactions an agent answered in one queue and then consult transferred. |
| Contacting | The number of contacting segments for the queue and interval. |
| Dialing | The number of dialing segments for the queue and interval. |
| Error | The number of errors that occurred on the queue conversations. |
| Max Contacting | The maximum amount of time outbound interactions take to connect to the agent’s phone. Usually, this duration is short. However, if the agent uses a remote phone the duration may be longer. |
| Max Dialing | The maximum amount of time an outbound interaction spends dialing a contact. |
| Max Monitor | Maximum time that the user spent monitoring interactions. |
| Min Contacting | The minimum amount of time outbound interactions take to connect to the agent’s phone. Usually, this duration is short. However, if the agent uses a remote phone the duration may be longer. |
| Min Dialing | The minimum amount of time an outbound interaction spends dialing a contact. |
| Min Monitor | Minimum time that the user spent monitoring interactions. |
| Monitor | Number of interactions that were monitored. |
| Outbound | This metric represents the number of outbound interactions placed on behalf of queue. |
| Talk | The number of sessions where the user(s) interacted during conversations. A session includes the point where the agent joins the conversation to the point where they disconnect. |
| Total Alert – No Answer | The total number of seconds Genesys Cloud offered an agent an interaction before the agent declined the interaction or the interaction timed out. |
| Total contacting | The total amount of time outbound interactions take to connect to the agent’s phone. Usually, this duration is short. However, if the agent uses a remote phone the duration may be longer. |
| Total dialing | The total amount of time an outbound interaction spends dialing a contact. |
| Total Monitor | Total time that the user spent monitoring interactions. |
| Transfer % | The number of transfers compared to the total number of interactions answered. Calculated by: (# of transfers / Interactions Answered) * 100 |