
Knowledge performance dashboard
Access to the following menu options:
- Analytics > Conversation Aggregate > View
- Analytics > Queue Observation > View
- Analytics > Dashboard Configurations > Edit or Analytics > Dashboard Configurations > View
- Analytics > flowObservation > View
- Analytics > flowAggregate > View
- Directory > User > View
- Routing > Queue > View
- Routing > Wrap-up Code > View
- Architect > flowOutcome > View
- Architect > flow > View
- Workforce Management > Real-Time Adherence > View
Access the Knowledge Performance dashboard
Click Performance > Workspace. You can find the knowledge performance dashboard under Other.
If the Knowledge Performance dashboard does not appear in the tabbed view, then add the view:
- Click Add. The list of available views appears.
- Search for Knowledge Performance, or scroll to Other and select it from the list.
Set a default time zone in the workspace
You can set the default time zone in the analytics workspace before viewing any analytics view.
To set the default time zone in the workspace, follow these steps:
- Click Performance > Workspace.
- On the left side, from the Time zone drop-down menu, select the required time zone as the default time zone for the analytics workspace.
Knowledge performance dashboard overview
The dashboard gives you insights into customer activity.
Click the image to enlarge.
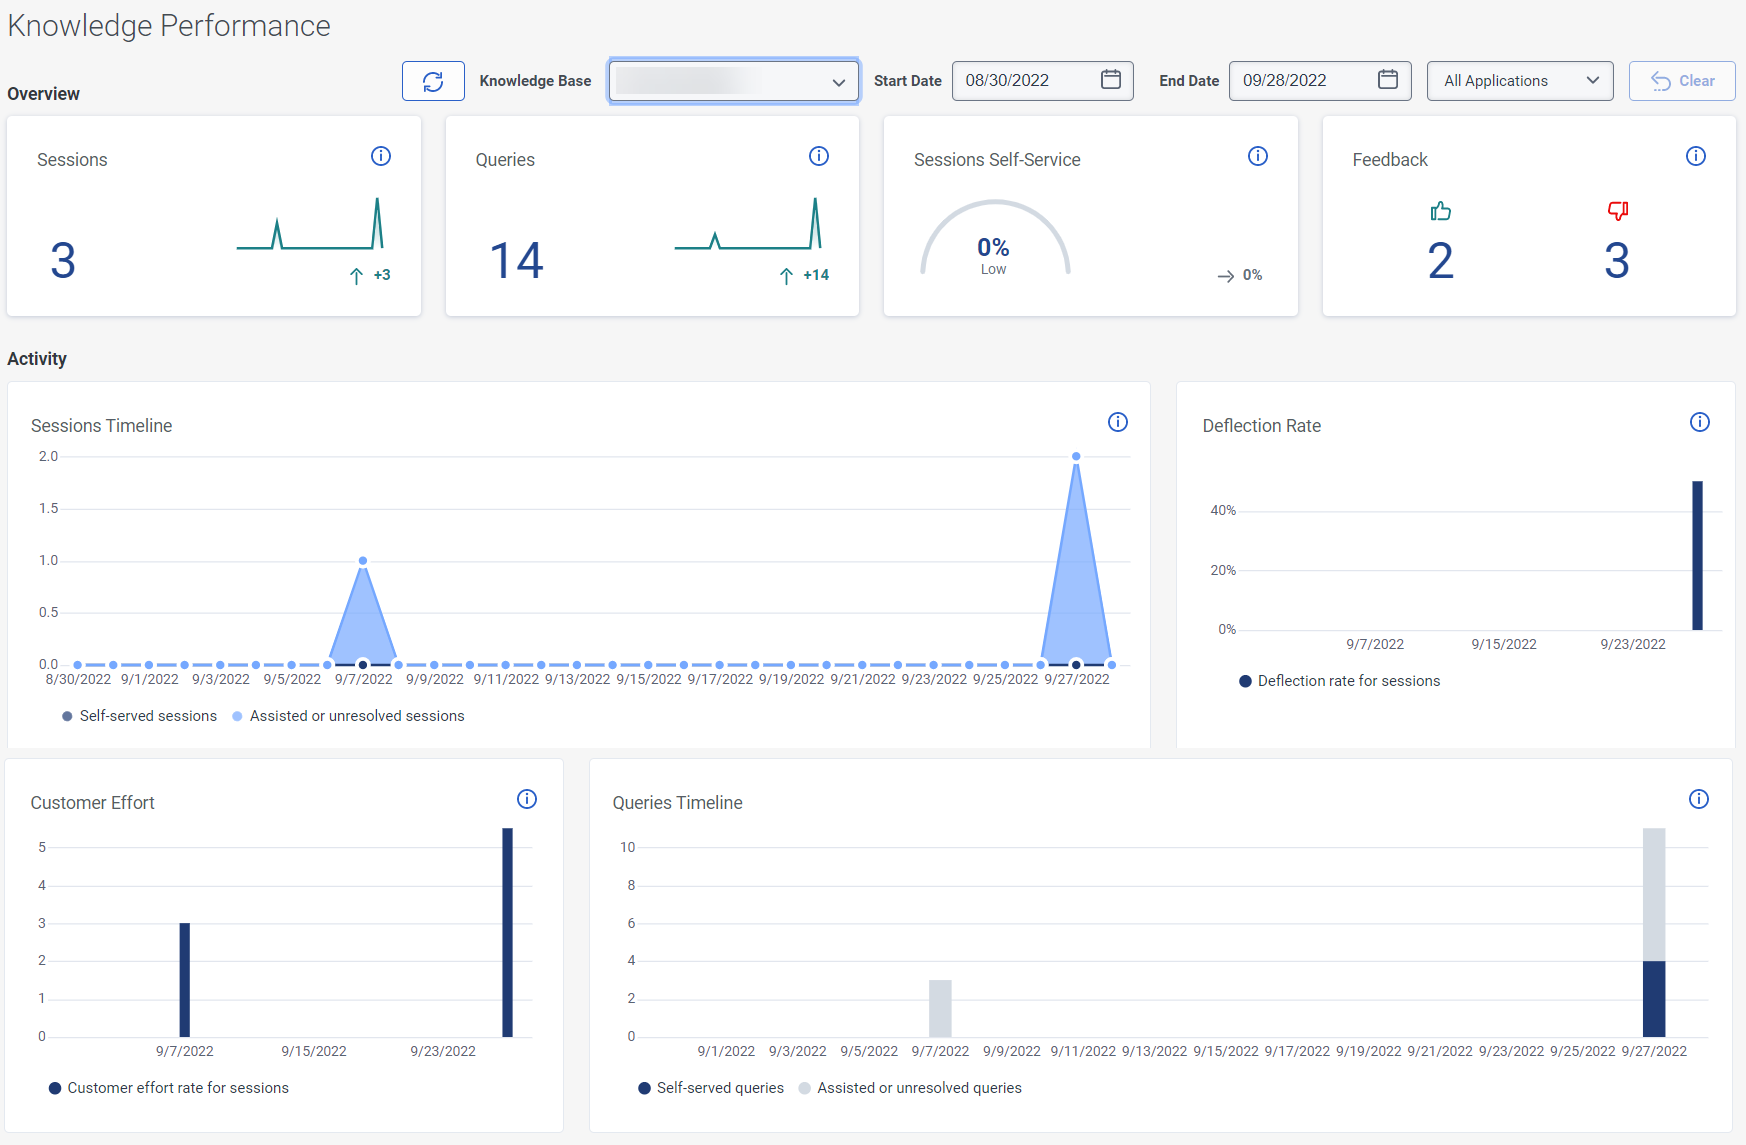
Sessions
A session is a visit in which a customer interacts with the website to get an answer.
- The customer asks a question in a widget on the website
- The customer views an FAQ answer
- The customer reads an article on your knowledge portal
A session can include one or more queries.
Queries
A query represents a customer’s attempt to gather information or perform an action. All follow-up actions around the same information are also queries.
Session self-service
Session self-service score is the total number of queries with no negative signals divided by the total number of queries.
Negative signals include the following:
- Interactions that were not answered
- Interactions that contain negative feedback
Feedback
This score shows the number of positive and negative feedbacks received from the customers.
Customer effort
The customer effort provides insight into how your escalation channels are performing. When a customer chooses to continue using chat, email or phone, the customer effort score changes accordingly.