
Agents Status Detail view
The following permissions:
- Analytics > Data Export > All
- Analytics > User Aggregate > View
- Directory > User > View
- Routing > Queue > Join or Routing > QueueMember > Manage (to activate and deactivate queue members)
- UI > Supervisor Agent Details > View
- UI > Supervisor Status Control > View (to change an agent’s status).
To log an agent out of Genesys Cloud:
- OAuth > Token > Delete
To disassociate an agent from a station:
- Telephony > Station > Disassociate
To access the Login and Logout columns:
- Analytics > User Detail > View
The Agents Status Summary Detail view displays real-time information about an agent’s statuses, including the length of time the agent stays in each status. Data in the columns updates when the agent leaves a status. This view updates automatically.
This view performs live updates to data in the real-time columns if you view a date range that includes the current interval such as today, this month, and more. To get the live data for the Log in and Log out columns, click Refresh or wait until the midnight rollover.
This view does not perform live updates to the data if you view a historical date range that does not include the current interval.
To see the most current data, click Refresh .
Available columns
To view the available columns, see the Agents Status Detail view section in the View available columns in performance views by category article.
- To view the consolidated list of available columns in the performance views, see Consolidated view of available columns in performance views.
- To view the list of available columns in the performance views by category, see View available columns in performance views by category.
Set a default time zone in the workspace
You can set the default time zone in the analytics workspace before viewing any analytics view.
To set the default time zone in the workspace, follow these steps:
- Click Performance > Workspace.
- Click Menu > Analytics > Analytics Workspace.
- On the left side, from the Time zone drop-down menu, select the required time zone as the default time zone for the analytics workspace.
View data for an agent
- Click Performance > Workspace > Contact Center > Agent Status.
- Click Menu > Analytics > Analytics Workspace.
- In the Default section, search for Agent Status and then click the view name to open it.
- From the Agents Status Summary view, click an agent’s name. The Agent’s Status Summary Detail view displays.
- From the View by list, select one of the following:
Duration Displays the time spent in each status, broken down by interval. Timeline By displaying a list of status changes throughout the selected date range, the Timeline view provides a detailed view of how agents spend their time. The view details when the status was entered and for how long. It is also sorted chronologically according to the start time, with the oldest on top.
With this data, supervisors can review periods of time that are longer or shorter than expected. For example, an agent is only on queue for 30 minutes instead of one hour, or an agent is on break for 20 minutes but was only approved for 10 minutes.
The Timeline view includes the following columns:
- Start Time – The date and time that the status was entered.
- End Time – The date and time that the status was exited.
- Primary Status – The primary Genesys Cloud status (available, away, busy, meal, and so on).
- Secondary Status – The secondary status (for example, the primary status is meal and the secondary status is breakfast).
- Duration – The time between start time and end time.
Log in – Log out The Log in – Log out view provides a detailed view of when a user logged in and logged out, and the time that passed between each. The view is sorted chronologically according to Log in time, with the oldest on top.
With this data, supervisors can know when a user was using the application. For example, this data shows when a user did not stay logged in long enough during their shift, or when a user did not log in when they were supposed to.
The Log in – Log out view includes the following columns:
- Log In – When the user logged in during the selected date range. N/A appears if the user logged in before the selected date range.
- Log Out – When the user logged out during the selected date range. N/A appears if the user logged out after the selected date range.
- Duration – The time between when the user logged in and logged out. N/A appears when the Log In or Log out is N/A.
Note: The login and logout details are calculated based on the agent’s login sessions on a particular application. To calculate the login and logout duration, Genesys Cloud collects the analytics logs of login and logout data of an agent and determines the first login and last logout data within the selected date range. - To save the view with your filter and column settings, click Save .
- To export the data in the view, click Export .
- Click the tabs to open the agent’s Performance, Evaluations, Interactions, Queues, Wrap-Up, or Schedule detail views.
View aggregate data for a group of agents
- Click Performance > Workspace > Contact Center > Agent Status.
- Click Menu > Analytics > Analytics Workspace.
- In the Default section, search for Agent Status and then click the view name to open it.
- From the Agents Status Summary view, in the Filter by agent(s) field, search for and select agents for which you want to see data.
- Near the list of agents you selected, click View as group. Genesys Cloud displays the Agents Status Summary Detail view with aggregate data for the agents that you selected.
- To save the view with your filter and column settings, click Save .
- To export the data in the view, click Export .
Note: Agent log in and log out information is available only in the Export file after you select the View as group and Split Filters options. For more information, see the Export data from a view section of this article. - Click the tabs to open the agent group’s Performance or Interactions detail views.
Activate agents for queues
Activate and deactivate queues for agents. After you activate a queue for an agent, when the agent’s status is On Queue, the agent receives interactions from that queue. Agents themselves can also choose the queues to work. To activate a queue for an agent, the agent must be a member of that queue.
To activate an agent for a queue from this view:
- Click the Queue Activation icon
 . The Queue Activation pane appears.
 - Search or scroll to select the queues in which you want the agent to work.
- (Optional) To traverse between the pages, use the pagination controls such as Previous , Next , First , and Last icons.
Note: The list of queues is limited to 500 and the number of queues per page is limited to 25. - Click Update.
Customize the view
To show only certain data, customize the Agents Status Summary view. For example, you can choose to show only certain columns or filter to show previous weeks. Your customizations remain as you navigate from view to view or leave and return to a view. To switch between different data of interest in the same view quickly, you can also save your filter and column settings as a saved view.
To customize analytics views, use the date filter.
To filter metrics by date or configure a custom date range, use presets. When filtering metrics for this view, select any custom date range up to 6 weeks.
To use a preset to filter metrics, complete the following steps:
- To display the date filter, click the date.
- In the Presets list, select a preset date option.
Date presets
| Presets | Description |
|---|---|
| Current interval | Shows data for the current 30-minute time period. |
| Today | Shows data for the time period that includes the current interval. |
| Yesterday | Shows data for the previous day. |
| This week | Shows data for a Sunday through Saturday time period. |
| Last week | Shows data for the previous week, Sunday through Saturday. |
| Previous 7 days | Shows data for the previous seven days. |
| This month | Shows data for the current month, with no extra days. |
| This month by week | Shows data for the current calendar month starting on Sunday and ending on Saturday, including extra days if the month does not start on Sunday or end on Saturday. |
| Last month | Shows data for the previous calendar month with no extra days. |
| Previous 30 days | Shows data for the previous 30 days. |
| Previous 3 months | Shows data for the previous 3 months. For example, Nov 1, 2022 – Jan 31, 2023. |
| Interval | Shows data for a 30-minute time period. |
| Day | Shows data for a single 24-hour day. |
| Week | Shows data for a Sunday through Saturday time period. |
| Month | Shows data for the exact month with no extra days. If the current month is selected, you can see the data up to the current date. |
| Month by Week | Shows data for a calendar month starting on Sunday and ending on Saturday, including extra days if the month does not start on Sunday or end on Saturday. |
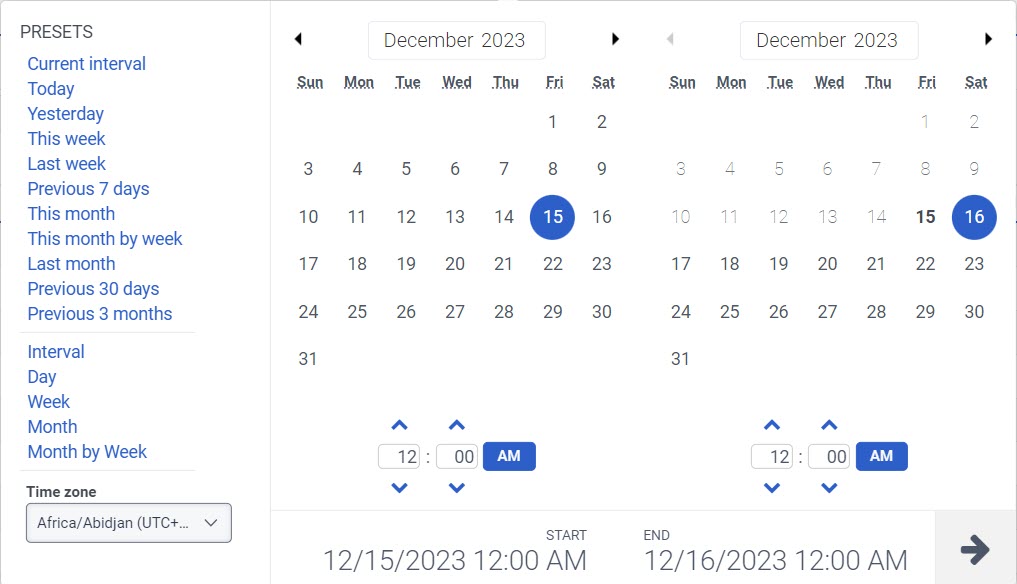
- To use a custom date range to filter metrics, complete the following steps:
-
- Click the date to display the date filter.
- Select a start date and an end date on the calendar, and click the filter arrow .
- To view data for a different time period using the same date presets, click the arrows on either side of the date display. For example, to view data for the previous day, click the Day preset, and then click the arrow on the left side of the date.
- To view data for a different time zone using the same date presets, from the Time zone drop-down menu, select the required time zone. You can create and save reports with the same selected time zone.
Data in the view can be displayed in a chart. To view the chart, click the Show/Hide chart icon .
To show or hide columns:
- At the top right corner of the columns, click the Pick columns icon. The Add/Remove Column pane appears.
- Click the Manage columns tab.
- (Optional) To sort the columns in ascending or alphabetical order, click Sort by > Column Name A-Z.
- (Optional) To sort the columns in descending or reverse alphabetical order, click Sort by > Column Name Z-A.
- (Optional) To categorize or uncategorize the columns, click Sort by and enable or disable the Group by Categories toggle.
- Search or scroll to select the columns you want to view. Note: You can also use keyboard navigation to choose the columns.
- Click Save. The selected columns appear on the screen. Note: The column selections appear only after saving the changes and do not apply to the table immediately.
To reorder the columns within the column picker:
- At the top right corner of the columns, click the Pick columns icon. The Add/Remove Column pane (column picker) appears.
- Click the Reorder columns tab.
- Click the grid icon
 of a column, and then drag and drop to reorder it within the column picker.
- Click to select the grid icon of the column to be reordered, and on the keyboard, press the Spacebar.
- To position the column, use the Up or Down arrow keys.
- Press the Spacebar. The chosen column is reordered.
To rearrange the columns outside the column picker, click a column header and drag it.
To reset a view to default column settings, click Reset view to defaults .
You can select up to 20 columns.
When the table columns are sorted as default, the Agents Status Summary view displays certain columns together as groups. To rearrange column groups, click a column group header and drag it.
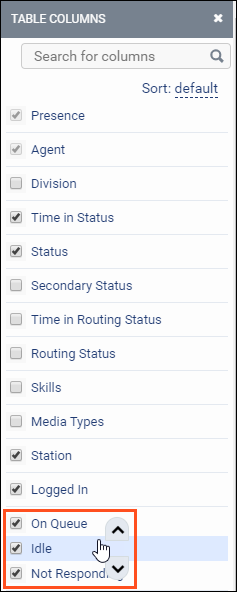
To reorder columns within the column groups:
- Click the Pick columns icon .
- In the Table Columns pane, hover over the table column header name you want to move.
- Click the up or down arrows.
View the agent’s secondary status
Supervisors can view the primary status of the agents, broken down by the agents’ secondary status. The secondary statuses appear as columns under the corresponding primary status. Supervisors can choose as many secondary statuses as they want for an agent to appear in the column header. In the column header, the name of the secondary status prepends the name of the primary status.
To view the secondary statuses’ in the column header, follow these steps:
- Click the Pick columns icon Icon included. The Add/Remove Column pane appears.
- Click the drop-down icon next to the required primary status. The list of secondary statuses that correspond to the chosen primary status appears below as columns.
- Choose the required secondary status or statuses.
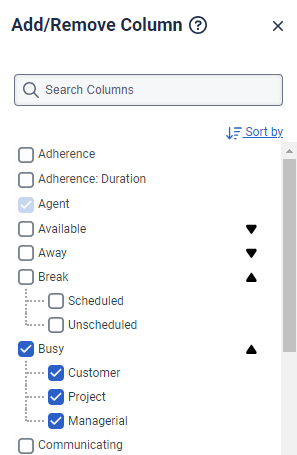
- Click Save. The chosen secondary status/statuses appears in the column header with the name of the primary status prepended.
Because the secondary statuses are division-aware, users see the secondary statuses only if permitted. Users can view the duration of each secondary status alongside the duration of the primary status. If the secondary statuses are selected and the user has permission to view all existing secondary statuses, then the sum of the duration of the secondary statuses equals the duration of the corresponding primary status.

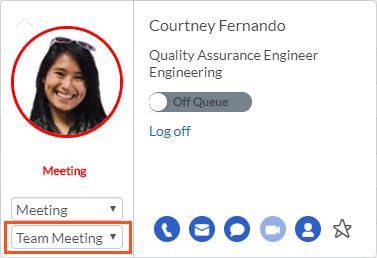
From the Agents Status Summary Detail view, hover over the agent’s profile picture.
To set the agent's status to Off Queue or On Queue, select On Queue or Off Queue. If you change the status from On Queue to Off Queue, then the agent's status automatically also changes to Available.
To set the agent's user status, select a status from the status drop-down. If the agent's status is On Queue, selecting a user status also sets them to Off Queue.
If the status you select has secondary statuses, select a secondary status in the drop-down below the primary status.
From the Agents Status Summary Detail view, hover over the agent’s profile picture.
To log out an agent, click Log off. If the agent is On Queue, set the agent's status to Off Queue, and then click Log off.
From the Agents Status Summary Detail view, hover over the agent’s profile picture.
To disassociate an agent from the station, click Disassociate Station.