Agents Status Summary view
The Agent Status Summary view displays real-time information about agents’ statuses, including the length of time agents stay in each status. Its real-time columns always display current status data for agents, even if you use the date filter to show historical data in the other columns.
This view performs live updates to the data of the real-time columns if you view a date range that includes the current interval such as today, this month, and more.
This view does not perform live updates to data in these situations:
- If you view a historical date range that does not include the current interval.
- For the columns that are not interval-agnostic.
Available columns
To view the available columns, see the Agents Status Summary view section in the View available columns in performance views by category article.
To view the consolidated list of available columns in the performance views, see Consolidated view of available columns in performance views.
To view the list of available columns in the performance views by category, see View available columns in performance views by category.
Set a default time zone in the workspace
You can set the default time zone in the analytics workspace before viewing any analytics view.
To set the default time zone in the workspace, follow these steps:
- Click Performance > Workspace.
- On the left side, from the Time zone drop-down menu, select the required time zone as the default time zone for the analytics workspace.
View the Agent Status Summary view
- Click Performance > Workspace > Contact Center > Agent Status.
- To see the most current data, click Refresh . This view updates automatically. Data in the columns updates when agents leave a status.
- To save the view with your filter and column settings, click Save .
- To export the data in the view, click Export .
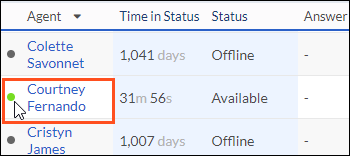
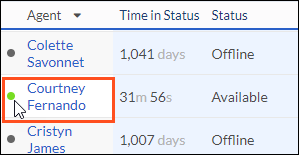
- To see the agent’s Status Summary detail view, click an agent’s name.
- To access the other Agents Performance views, click the tabs. Note: Each view has its own permissions. For permission requirements, see each view’s article.
Customize the view
To show only certain data, customize the Agents Status Summary view. For example, you can choose to show only certain columns or filter to show previous weeks. Your customizations remain as you navigate from view to view or leave and return to a view. To switch between different data of interest in the same view quickly, you can also save your filter and column settings as a saved view.
Filter by users to populate the summary row with aggregate data about those users.
- (Optional) Filter by date. The exported file uses these filters for the exported data. For more information about filtering data in a view, see the article for the view you want to export.
- Click Export . The Export pane opens.
- Change the name of the file or keep the default file name in the File Name field. The default file name includes the date and the name of the view. If you export data from the same view multiple times in one day, then all of those files have the same default name.
- To export only the columns shown in the view, select Selected Columns. The columns export in your preferred order as shown in the view.
- Select one of the following options:
- Agent Log In – Log Out Details – Exports the agent’s login and logout activity.
Note: The export data for the agent login and logout details is limited to a maximum of one month. When exporting the login and logout data, the first row of the export sometimes includes a logout (end time) that falls outside the selected date range. It is an expected behavior. The report calculates login/logout times based on the agent’s offline status. If the agent’s last offline segment falls before the report range begins, that segment appears as the logout time for the previous session. - Agent Status Timeline Details – Exports the agent’s status changes.
Note: The export data for the agent status timeline details is limited to a maximum of one month. - Agent Status Duration Details – Exports the time the agent spent in each status.
- Agent Log In – Log Out Details – Exports the agent’s login and logout activity.
- You can send a .csv file or a .pdf report in an email. To email the .csv file or .pdf report, enter up to 10 email addresses, separated by a semicolon (;) or a comma (,). To export to email addresses, you need the Analytics > Data Export > Publish permission.
- To choose how often you want an export to run, select Schedule export. Choose a Time period, and then select a Recurrence for the export to run. Next, select the appropriate options, such as Minutes past the hour, Day of week, Day of month, Day of quarter, Request time, Run on days, and Run on hours.
When you select Schedule export, the Selected Columns option is automatically selected. Before clicking Schedule, verify the columns that you want to export in your preferred order as shown in the view. - Click Show Advanced Options.
- If the view contains a duration column, time values are formatted in milliseconds. To format time values in HH:MM:SS.mmm, select the Format Durations option on the Export pane.
- To convert the export file time values from the time zone set on your computer to a different one, select a time zone option in the box for your export file.
- You can set the locale for the data exported from a view. The locale setting displays text, and date and time formats in the selected language. Select the language in the locale box.
- For .csv export files, select the Comma (,) Delimiter or the Semicolon (;) Delimiter to separate values.
- If the view has the export option Include Summary Row, you can add a row to the top of your export that includes the sum of all the numeric columns. To add this row to the export file, select the Include Summary Row check box.
- If the view has the export option Exclude Empty Rows, select this check box to remove rows in the export file that do not have data.
- Select .csv or .pdf in the file format box.
- Click Export. The file appears in your inbox.
- If you have scheduled the export, the Export button changes to Schedule. If you are emailing the export, the button changes to Export & Email. If you have selected to schedule and email the export, the button changes to Schedule & Email.
- To view your Scheduled Exports, in the Export pane click View existing export schedules.
- You cannot edit a scheduled export. If you want to modify a schedule for an export, delete or disable the existing scheduled export and create a new one.
To customize analytics views, use the date filter.
To filter metrics by date or configure a custom date range, use presets. When filtering metrics for this view, select any custom date range up to 6 weeks.
To use a preset to filter metrics, complete the following steps:
- To display the date filter, click the date.
- In the Presets list, select a preset date option.
Date presets
| Presets | Description |
|---|---|
| Current interval | Shows data for the current 30-minute time period. |
| Today | Shows data for the time period that includes the current interval. |
| Yesterday | Shows data for the previous day. |
| This week | Shows data for a Sunday through Saturday time period. |
| Last week | Shows data for the previous week, Sunday through Saturday. |
| Previous 7 days | Shows data for the previous seven days. |
| This month | Shows data for the current month, with no extra days. |
| This month by week | Shows data for the current calendar month starting on Sunday and ending on Saturday, including extra days if the month does not start on Sunday or end on Saturday. |
| Last month | Shows data for the previous calendar month with no extra days. |
| Previous 30 days | Shows data for the previous 30 days. |
| Previous 3 months | Shows data for the previous 3 months. For example, Nov 1, 2022 – Jan 31, 2023. |
| Interval | Shows data for a 30-minute time period. |
| Day | Shows data for a single 24-hour day. |
| Week | Shows data for a Sunday through Saturday time period. |
| Month | Shows data for the exact month with no extra days. If the current month is selected, you can see the data up to the current date. |
| Month by Week | Shows data for a calendar month starting on Sunday and ending on Saturday, including extra days if the month does not start on Sunday or end on Saturday. |
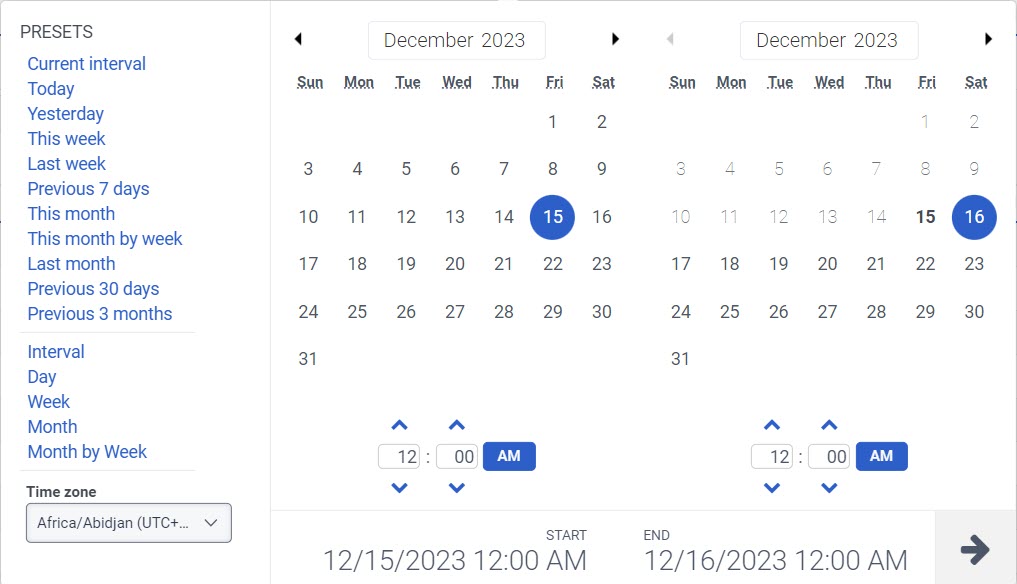
To use a custom date range to filter metrics, complete the following steps:
- Click the date to display the date filter.
- Select a start date and an end date on the calendar, and click the filter arrow .
To view data for a different time period using the same date presets, click the arrows on either side of the date display. ![]()
For example, to view data for the previous day, click the Day preset, and then click the arrow on the left side of the date.
To view data for a different time zone using the same date presets, from the Time zone drop-down menu, select the required time zone. You can create and save reports with the same selected time zone.
Data in the view can be displayed in a chart. To view the chart, click the Show/Hide chart icon .
You can view the agent status summary as a supervisor or evaluator.
- To view the agent status summary as a supervisor, ensure that Supervisor is selected in the drop-down to the right of View as. By default, the summary is displayed in the supervisor view. In the supervisor’s view, you can view the list of all the agents and their evaluations.
- To view the agent status summary as an evaluator, click the drop-down to the right of View as and choose Evaluator. In the evaluator’s view, you can view the list of all the agents for whom you are assigned as the evaluator.
To show or hide columns:
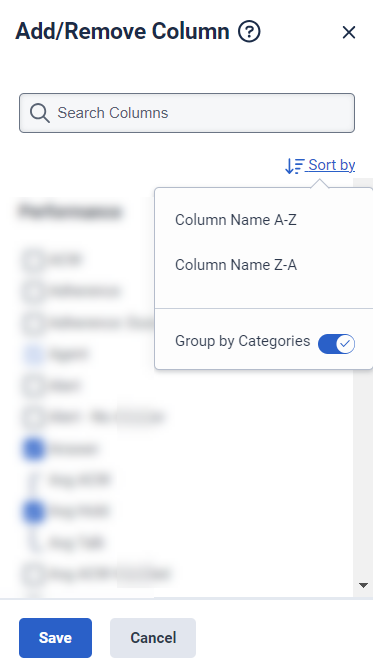
- Click the Pick columns icon on the right side. The Add/Remove Column pane appears.
- (Optional) To sort the columns in ascending or alphabetical order, click Sort by > Column Name A-Z.
- (Optional) To sort the columns in descending or reverse alphabetical order, click Sort by > Column Name Z-A.
- (Optional) To categorize or uncategorize the columns, click Sort by and enable or disable the Group by Categories toggle. Click the image to enlarge.
- Search or scroll to select the columns you want to view. Note: You can also use keyboard navigation to choose the columns.
- Click Save. The selected columns appear on the screen. Note: The column selections appear only after saving the changes and do not apply to the table immediately.
To rearrange the columns, click a column header and drag it.
To reset a view to default column settings, click Reset view to defaults ![]() .
.
You can select up to 20 columns.
For more information about the metrics shown in the columns, see the Available Columns section in this article.
When the table columns are sorted as default, the Agents Status Summary view displays certain columns together as groups. To rearrange column groups, click a column group header and drag it.
To reorder columns within the column groups:
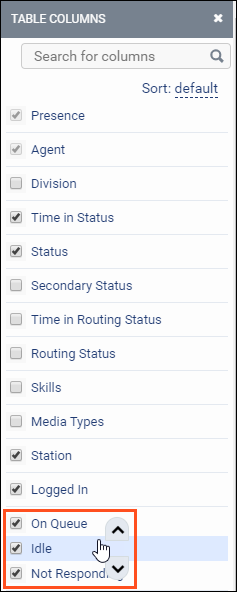
- Click the Pick columns icon .
- In the Table Columns pane, hover over the table column header name you want to move.
- Click the up or down arrows.
View the agents’ secondary status
Supervisors can view the primary status of the agents, broken down by the agents’ secondary status. The secondary statuses appear as columns under the corresponding primary status. Supervisors can choose as many secondary statuses as they want for an agent to appear in the column header. In the column header, the name of the secondary status prepends the name of the primary status.
To view the secondary statuses’ in the column header:
- Click the Pick columns icon Icon included. The Add/Remove Column pane appears.
- Click the drop-down icon next to the required primary status. The list of secondary statuses that correspond to the chosen primary status appears below as columns.
- Choose the required secondary status or statuses.
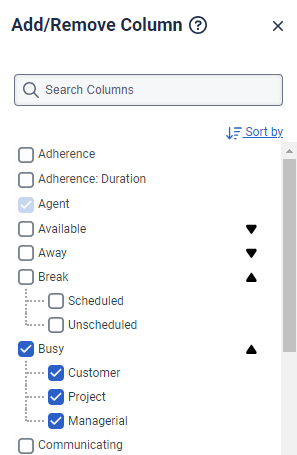
- Click Save. The chosen secondary status or statuses appears in the column header with the name of the primary status prepended.
Because the secondary statuses are division-aware, users see the secondary statuses only if permitted. Users can view the duration of each secondary status alongside the duration of the primary status. If all the secondary statuses are selected and the user has permission to view all existing secondary statuses, the sum of the duration of the secondary statuses equals the duration of the corresponding primary status.

To enter names of users you want to view, click the Filter user(s) search icon . Genesys Cloud populates the summary row with aggregate data about those users. You can filter by a User name, Division name, Group name, Work Team name, Role, or a Location. As you enter a name, the suggested names are displayed in the search results with the filtering type on the right. When entering a user name, you can also select the Reports to filtering type, to display the user's direct reports. You can continue to enter and select additional users to add to the view.
Filter by selecting multiple users
You can select multiple users to filter by.
- In the user's row, select the check box.
- Continue selecting user check boxes to add to filters.
- Click Add to filters.
To use the summary row to see aggregate metrics for multiple users, search for and select multiple users. The summary row then shows aggregate metrics for the selected users.
View aggregate data
To view aggregate data for several users, filter for multiple users and click View as group. Genesys Cloud displays the Agents Status Detail view with aggregate data for the users that you selected. Use the Back arrow icon to return to the Agents Status Detail view.
To filter the agent list by user type, in the upper left corner, choose any one of the required user types from the Active Users filter:
- Active Users (Default) – To filter only the active agents in the organization from the agent list.
- Inactive Users – To filter only the inactive agents in the organization from the agent list.
- Active and Inactive Users – To filter both the active and inactive agents in the organization from the agent list.
- Deleted Users – To filter only the deleted agents in the organization from the agent list.
From the Agents Status Summary view, hover over the presence dot beside an agent’s name.
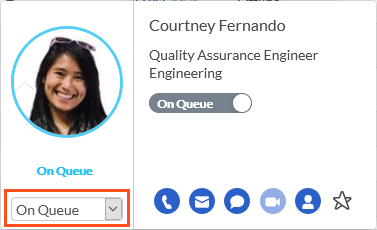
To set the agent's status to Off Queue or On Queue, select On Queue or Off Queue. If you change the status from On Queue to Off Queue, then the agent's status automatically also changes to Available.
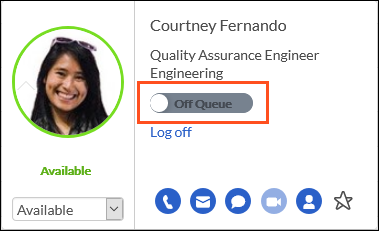
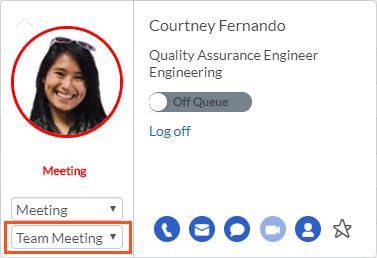
To set the agent's user status, select a status from the status drop-down. If the agent's status is On Queue, selecting a user status also sets them to Off Queue.
If the status you select has secondary statuses, select a secondary status in the drop-down below the primary status.
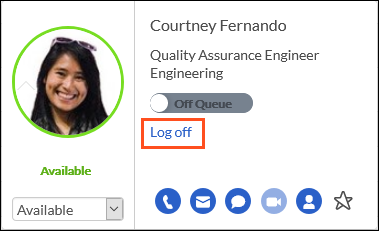
From the Agents Status Summary view, hover over the presence dot beside an agent’s name.
To log out an agent, click Log off. If the agent is On Queue, set the agent's status to Off Queue, and then click Log off.
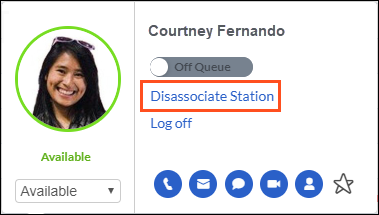
From the Agents Status Summary view, hover over the presence dot beside an agent’s name.
To disassociate an agent from the station, click Disassociate Station.