
View available columns in performance views by category
View the list of available columns by category in the performance views. To view the consolidated list of available columns in the performance views, see Consolidated view of available columns in performance views.
Abandon Intervals Metrics view
| Column | Description |
|---|---|
| Offered | The number of interactions routed into the queue for an agent to answer. Offered interactions are either answered, abandoned, or flow-out interactions. |
| Answer % | The percentage of offered interactions that an agent answered. Calculated by: (Answered / Offered) * 100 |
| Answered (in Answered % column) | A measurement of the number of assigned ACD interactions answered by an agent in a given period. Answered increments when the agent is the first to connect to the interaction. |
| Abandon % | The percentage of offered interactions in which the customer disconnected before connecting with an agent. The abandon rate can identify queues that require extra staff to handle interactions in a timely manner. Calculated by: (Abandoned Count / Offered Count) * 100 |
| Abandon (in Abandon % column) | The number of times an end user abandoned an interaction in a queue. For example, the customer hangs up before an agent answers, or the system disconnects the interaction. |
| Service Level % | Service level target is a contact center performance statistic expressed as “X percent of conversations answered in Y seconds.” For example, a goal of answering 80% of voice calls within 20 seconds provides a service level target of 80/20. You can set the service level target for each media type in a queue. Analytics uses this service level target to calculate whether you are within the service level % defined by your service level agreement (SLA). For more information about setting the service level target, see Create queues or Edit or delete queues. Note: In the performance views that are not queue-specific, the Service Level % is calculated by queue and displayed as a – on the aggregated group row since SLA targets vary by queue. The affected views are DNIS Performance Summary and Skills Performance views. To view individual queue service level %, click the + to expand the row.
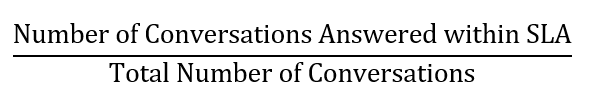
The service level % is the percentage of interactions that meet your contact center's service level target. The formula to calculate the service level % is:
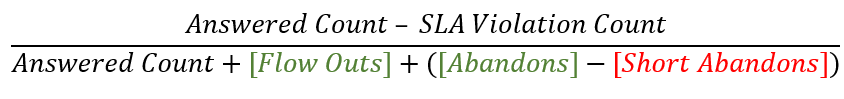
Number of Conversations Answered within SLA The numerator is calculated by taking the total answered conversations and subtracting the conversations that were not answered within the SLA threshold. Calculated by: (Answered Count – SLA Violation Count) Total Number of Conversations The Service Level Options configuration determines the denominator. With all the options below unchecked, the denominator is the count of answered conversations.
As the service level calculation depends on an organization’s configured options, the final formula to calculate the service level is:
Notes:
|
| Short Abandon % | Percent of interactions that were short abandoned. |
| Max Abandon | The maximum time of an abandoned interaction for the selected interval. |
| Min Abandon | The minimum time of an abandoned interaction for the selected interval. |
| Avg Abandon | Average time to abandon. |
| ASA | The average amount of time an interaction waits in the queue before an agent answers. This metric does not include interactions that agents do not answer. Average Speed of Answer (ASA) is directly associated with the service level and provides insight into the customer service your organization provides. ASA is recorded in the interval in which the agent answered the interaction. Calculated by: Total Answered (tAnswered Sum) / Answered Count (tAnswered Count) Note: Raw values are provided in milliseconds. |
Action Map Blocked Offer Detail view
| Column | Description |
|---|---|
| Reason | Action map name. |
| Blocker | Type of web action associated to the action map, such as web chat or content offer. |
| Sessions | Number of unique times the action map attempted to offer the web action to visitors. |
| Count |
Total number of times the action map attempted to offer the web action to visitors. |
Action Map Blocked Offer Interval Detail view
| Column | Description |
|---|---|
| Sessions | Number of unique times the action map attempted to offer the web action to visitors. |
| Count |
Total number of times the action map attempted to offer the web action to visitors. |
Agent Development Detail view
| Column | Description |
|---|---|
| Column | Description |
| Assigned By | The name of the user who assigned the coaching appointment or learning module. |
| Assigned Date | The start date and time for the coaching appointment or learning module. |
| Assigned To | The name of the agent that the coaching appointment or learning module is assigned to. |
| Completion Date | The date the coaching appointment or learning module was completed. |
| Development Type | Displays Coaching for coaching appointments, Learning for learning modules, Assessment for standalone assessments, or Learning with Assessment for learning modules with assessments. |
| Due Date | The target date of completion for the coaching appointment or learning module. |
| Facilitator | The user responsible for leading the coaching appointment, or assigning the informational learning module to an agent. |
| Name | The name of the coaching session or the name of the learning module. |
| Overdue |
Displays Yes for coaching appointments and learning modules that have an elapsed completion date. Displays No for coaching appointments and learning modules that do not have an elapsed completion date. |
| Status | Displays the current status for a coaching appointment or for a learning module. Possible statuses are: Completed, In Progress, Invalid Schedule, and Planned. |
| Result | Displays the assessment result for the agent. Possible statuses are Pass or Fail. |
| Score | Displays the assessment score of the agent. Score is shown in percentage. |
Agent Development Summary view
| Column | Description |
|---|---|
| Column | Description |
| Agent | The full name for the user. |
| Completed | The number of coaching appointments and informational training modules completed for the selected interval. |
| Division | Displays the name of a division that an agent belongs to. For more information, see Divisions overview. |
Email address configured for the user. |
|
| ID | Unique system ID for the user. |
| In Progress | The number of coaching appointments and informational training modules that are in progress. |
| Invalid Schedule | The number of scheduled and in progress coaching appointments that do not have a valid agent schedule in Workforce Management. |
| Media Types | Displays icons of the permitted media types for an agent. |
| Overdue | The total number of coaching appointments and informational training modules that have an elapsed completion date. This includes elapsed appointments and modules that are scheduled, in progress, or have an invalid schedule. |
| Planned | The number of scheduled coaching appointments and assigned informational training modules. |
| Presence | Displays the presence indicator for an agent's user status. |
| Station | Icon that shows if an agent is associated with a station. Hover over the icon to display the Station Name. This column is not included in an exported CSV file or PDF report. |
| Total | The sum of coaching appointments and informational training modules, including planned, in progress, completed, overdue, and have an invalid schedule. |
| Passed | Displays the number of assessments passed during the selected time period. |
| Failed | Displays the number of assessments failed during the selected time period. |
| Score | Displays the aggregate assessment score of the agent. |
Agent Timeline Detail view
Count-based Metric Type
| Metric | Description |
|---|---|
| Metric | Description |
| After-call work (ACW) | The number of times after-call work (ACW) was completed. After-call work is the work that an agent performs immediately following an interaction. Work may involve keying activity codes, updating customer databases, filling out forms, or initiating outbound contact. As a metric, it indicates the total time an agent takes to finish working on a call. If an agent must complete work before the agent can handle the next contact, then ACW is factored into the average handle time. |
| Alert – No Answer | The number of times an agent was alerted to a conversation but did not answer the conversation. Note: This metric does not specifically count the number of times an agent was placed in a Not Responding routing status. An agent is transitioned to Not Responding status after a specific alert time threshold for ACD-routed conversations. Alert – No Answer can be incremented for all conversation types for any situation where an alert was not followed by an answer event. |
| Alerted | The number of times agents receive an alert for interactions. |
| Answer | A measurement of the number of assigned ACD interactions answered by an agent in a given period. Answered increments when the agent is the first to connect to the interaction. |
| Blind Transfer | The number of interactions an agent answered in one queue and then blind transferred. A blind transfer counts for the queue in which an agent answers the interaction. |
| Consult Transfer | The number of call interactions an agent answered in one queue and then consult transferred, meaning they connected with a person or queue before transferring the call. A consult transfer counts for the queue in which an agent answers the interaction. See Consult transfer a call. |
| Contacting | The number of contacting segments for the queue and interval. |
| Dialing | The number of dialing segments for the queue and interval. |
| Error | The number of errors that occurred on the queue conversations. |
| Handle | The total number of ACD and non-ACD interactions that agents were involved in for the selected media type. Handle increments in the interval in which the interaction ends, after the agent completes any after call work and completes the interaction. |
| Hold | The number of interactions with holds. |
| Monitor | Number of interactions that were monitored. |
| Outbound | This metric represents the number of outbound interactions placed on behalf of queue. |
| Park | The number of emails parked by an agent. |
| Talk Count | The number of sessions where the user(s) interacted during conversations. A session includes the point where the agent joins the conversation to the point where they disconnect. |
| Transferred | A measurement of the number of interactions an agent answered in one queue and then transferred. A transfer counts for the queue in which an agent answers the interaction. This measurement is calculated by the number of interactions blind transferred or consult transferred. |
Percentage-based Metric Type
| Metric | Description |
|---|---|
| Metric | Description |
| Available % | The percentage of time spent in the Available status for the specified period. |
| Away % | The percentage of time spent in the Away status for the specified period. |
| Blind Transfer % | The percentage of interactions an agent answered in one queue and then blind transferred. |
| Break % | The percentage of time spent in the Break status for the specified period. |
| Busy % | The percentage of time spent in the Busy status for the specified period. |
| Communicating % | The percentage of time the agent is on a non-ACD call. For more information about how utilization affects agents that handle both ACD and non-ACD conversations, see Agent utilization. |
| Consult Transfer % | The percentage of interactions an agent answered in one queue and then consult transferred. |
| Idle % | The percentage of time agents who are On Queue and able to take interactions but are not working with interactions. |
| Interacting % | The percentage of time that the agent was handling interactions. |
| Meal % | The percentage of time spent in the Meal status for the specified period. |
| Meeting % | The percentage of time spent in the Meeting status for the specified period. |
| Not Responding % | The percentage of time an agent spends in the Not Responding routing status after not accepting an interaction. The Not Responding routing status is when an agent was On Queue or Interacting and did not answer an offered interaction. The agent could still be handling and completing other previous interactions. While Not Responding, the agent does not receive new interactions. |
| Occupancy | The percentage of time that an agent spent handling ACD conversations against the total time on queue calculated by: (total time in "Interacting" routing status / (total time in “idle”, “interacting”, and “communicating” routing statuses in interval)) * 100; range: 0-100% |
| Off Queue % | Off Queue % represents the percentage of agents that are off queue for a specific queue. These agents are in another status, such as Available, Busy, Away, Break, Meal, Meeting, or Training. Agents in the Out of Office and Offline statuses are not included in this percentage. |
| On Queue % | The On Queue % metric represents the percentage of an agent’s Logged In time that they are On Queue. |
| System Away % | The percentage of time spent during the specified period in the Away status when Genesys Cloud automatically sets the user's status to Away due to inactivity. |
| Training % | The percentage of time spent in the Training status for the specified period. |
| Transfer % | The number of transfers compared to the total number of interactions answered. Calculated by: (# of transfers / Interactions Answered) * 100 |
Time-based Metric Type
| Metric | Description |
|---|---|
| Avg ACW | The average amount of time agents spent completing after-call work. Calculated by: Total ACW / Interactions with ACW |
| Avg ACW Handled | The average time any interaction spent in ACW. This calculation takes into account all interactions handled, not just those that had ACW. Calculated by: Total ACW Time / Number of Interactions Handled |
| Avg Alert | The average amount time Genesys Cloud alerts agents before the agent accepts or declines an interaction. |
| Avg Contacting | The average amount of time an outbound interaction takes to connecting to the agent’s phone. Usually, this duration is short. However, if the agent uses a remote phone the duration may be longer. |
| Avg Dialing | The average amount of time an agent spends dialing and waiting for a contact to answer during outbound interactions.
Calculated by: (total dialing time/ total number of dialing segments) |
| Avg Handle | The average amount of time agents spent handling interactions. This calculation includes talk time, hold time, and after-call work. For outbound calls it also includes dialing and contacting time. Calculated by: (cumulative talk time + cumulative hold time + cumulative after-call work + cumulative dialing time + cumulative contacting time) / Number of interactions handled Note: The interactions can span multiple time intervals. For example, a 45-minute call spans two 30-minute intervals. However, metrics are assigned a single timestamp and reported in the interval into which this timestamp falls. The timestamps are assigned based on when the metric calculation is complete.
For instance, handle time will use the timestamp of after call work completion. In the example of a 45-minute call, the handle time falls in the second 30-minute interval because the handle time was calculated at the end of the call when ACW was submitted. |
| Avg Hold | The average number of seconds that interactions were placed on hold. Calculated by: Total Hold Time / Count of interactions with holds |
| Avg Hold Handled | The average time any interaction spent on hold. This calculation takes into account all interactions handled, not just those that were held. Calculated by: Total Hold Time / Number of Interactions Handled. |
| Avg Monitor | Average time that the user spent monitoring interactions. |
| Avg Park | The average amount of time an email was parked by an agent. |
| Avg Talk | The average number of seconds spent interacting on a media type. Calculated by: Total Talk time / Count of interactions with Talk time |
| Max ACW | The maximum amount of time spent on after call work for the selected interval. |
| Max Alert | The maximum amount of time an agent was being alerted. |
| Max Alert – No Answer | The maximum amount of time an agent was being alerted without responding to an interaction. |
| Max Answer | The maximum amount of time an agent spent answering assigned ACD interactions for the selected interval. |
| Max Contacting | The maximum amount of time outbound interactions take to connect to the agent’s phone. Usually, this duration is short. However, if the agent uses a remote phone the duration may be longer. |
| Max Dialing | The maximum amount of time an outbound interaction spends dialing a contact. |
| Max Handle | The maximum amount of time agents were involved in ACD and non-ACD interactions, including answered interactions, transfers, callbacks, and outbound calls. |
| Max Hold | The maximum amount of time spent on hold for the selected interval. |
| Max Monitor | Maximum time that the user spent monitoring interactions. |
| Max Park | The maximum amount of time an email was parked by an agent. |
| Max Talk | The maximum amount of time spent interacting for the selected interval. |
| Min ACW | The minimum amount of time spent on after call work for the selected interval. |
| Min Alert | The minimum amount of time an agent was being alerted. |
| Min Alert – No Answer | The minimum amount of time an agent was being alerted without responding to an interaction. |
| Min Answer | The minimum amount of time an agent spent answering assigned ACD interactions for the selected interval. |
| Min Contacting | The minimum amount of time outbound interactions take to connect to the agent’s phone. Usually, this duration is short. However, if the agent uses a remote phone the duration may be longer. |
| Min Dialing | The minimum amount of time an outbound interaction spends dialing a contact. |
| Min Handle | The minimum amount of time agents were involved in ACD and non-ACD interactions, including answered interactions, transfers, callbacks, and outbound calls. |
| Min Hold | The minimum amount of time spent on hold for the selected interval. |
| Min Monitor | Minimum time that the user spent monitoring interactions. |
| Min Park | The minimum amount of time an email was parked by an agent. |
| Min Talk | The minimum amount of time spent interacting for the selected interval. |
| Total ACW | The cumulative time spent in after-call work (ACW) on all interactions. After-call work is the work that an agent performs immediately following an interaction. Work may involve keying activity codes, updating customer databases, filling out forms, or initiating outbound contact. As a metric, it indicates the total time an agent takes to finish working on a call. If an agent must complete work before the agent can handle the next contact, then ACW is factored into the average handle time. |
| Total Alert | The total time Genesys Cloud alerts agents before the agent accepts or declines an interaction. |
| Total Alert – No Answer | The total number of seconds Genesys Cloud offered an agent an interaction before the agent declined the interaction or the interaction timed out. |
| Total Available | The total time spent in the Available status for the specified period. |
| Total Away | The total time spent in the Away status for the specified period. |
| Total Break | The total time spent in the Break status for the specified period. |
| Total Busy | The total time spent in the Busy status for the specified period. |
| Total Communicating | The total amount of time the agent is on a non-ACD call. For more information about how utilization affects agents that handle both ACD and non-ACD conversations, see Agent utilization. |
| Total Contacting | The total amount of time outbound interactions take to connect to the agent’s phone. Usually, this duration is short. However, if the agent uses a remote phone the duration may be longer. |
| Total Dialing | The total amount of time an outbound interaction spends dialing a contact. |
| Total Handle | The total amount of time agents spend on an interaction including time spent contacting, time spent dialing, talk time, hold time, and after call work. |
| Total Hold | The cumulative hold time for all interactions. |
| Total Idle | The total time agents who are On Queue and able to take interactions but are not working with interactions. |
| Total Interacting | The total time that the agent was handling interactions. |
| Total Logged In | The total amount of time a user is logged in for the specified period. |
| Total Meal | The total time spent in the Meal status for the specified period. |
| Total Meeting | The total time spent in the Meeting status for the specified period. |
| Total Monitor | Total time that the user spent monitoring interactions. |
| Total Not Responding | The total amount of time an agent spends in the Not Responding routing status after not accepting an interaction. The Not Responding routing status is when an agent was On Queue or Interacting and did not answer an offered interaction. The agent could still be handling and completing other previous interactions. While Not Responding, the agent does not receive new interactions. |
| Total Off Queue | The time spent in any status other than Offline and On Queue for the specified period. |
| Total On Queue | The time spent in the On Queue status for the specified period. |
| Total Park | The total amount of time an email was parked by an agent. |
| Total System Away | The total time spent during the specified period in the Away status when Genesys Cloud automatically sets the user's status to Away due to inactivity. |
| Total Talk | The total amount of time spent interacting on all the conversations by the agent, within an interval. For example, in an interaction, where an agent accepts an interaction, talks to the customer for two minutes, places the customer on hold for one minute, and then talks to the customer again for two minutes, the Total Talk equals 4 minutes. |
| Total Training | The total time spent in the Training status for the specified period. |
Agent Topics Detail view
| Column | Description |
|---|---|
| Name | The name of the topics. |
| Interactions | The number of interactions for the topic. |
| Interactions % | The percentage of interactions for this topic out of all communications across all topics. |
| Dialect | The language associated with the interaction. |
| Participant | The type of participant, whether Internal, External, or All. |
| Average Sentiment Score | The average sentiment score of interactions. |
| Negative Interactions | The number of interactions during which the average sentiment is < -20. |
| Negative Interactions % | The percent of all interactions that have an overall negative sentiment score (< -20). |
| Neutral Interactions | The number of interactions during which the average sentiment is >= -20 and < +20. |
| Neutral Interactions % | The percent of all interactions that have an overall neutral sentiment score (>= -20 and < +20). |
| Positive Interactions | The number of interactions during which the average sentiment is >= +20. |
| Positive Interactions % | The percent of all interactions that have an overall positive sentiment score (>= +20). |
| Avg Agent Talk | The average agent talk time. |
| Avg Agent Talk % | The average agent talk time as a percentage of interactions. |
| Avg Customer Talk | The average customer talk time. |
| Avg Customer Talk % | The average customer talking time as a percentage of interactions. |
| Avg Hold/Music | The average of hold time and music time across interactions. |
| Avg Hold/Music % | The average hold and music time as a percentage of interactions. |
| Avg Overtalk | The average overtalk time across interactions, where both the agent and customer talk at the same time. |
| Avg Overtalk % | The average overtalk time as a percentage of interactions, where both the agent and customer talk at the same time. |
| Avg Silence | The average silent time across interactions. |
| Avg Silence % | The average silent time as a percentage of interactions. |
| Avg Talk and Silence | The average of both the talking time and silent time. |
| Overtalk Instances | The number of instances of overtalk time, where both the agent and customer talk at the same time. |
| Sentiment | Shows the spread of sentiment for the topics shown. |
Agent Topics Summary view
| Column | Description |
|---|---|
| Agent | The full user name. |
| Answer | A measurement of the number of assigned ACD interactions answered by an agent in a given period. Answered increments when the agent is the first to connect to the interaction. |
| Handle | The total number of ACD and non-ACD interactions that agents were involved in for the selected media type. Handle increments in the interval in which the interaction ends, after the agent completes any after call work and completes the interaction. |
| Avg Handle | The average amount of time agents spent handling interactions. This calculation includes talk time, hold time, and after-call work. For outbound calls it also includes dialing and contacting time. Calculated by: (cumulative talk time + cumulative hold time + cumulative after-call work + cumulative dialing time + cumulative contacting time) / Number of interactions handled Note: The interactions can span multiple time intervals. For example, a 45-minute call spans two 30-minute intervals. However, metrics are assigned a single timestamp and reported in the interval into which this timestamp falls. The timestamps are assigned based on when the metric calculation is complete.
For instance, handle time will use the timestamp of after call work completion. In the example of a 45-minute call, the handle time falls in the second 30-minute interval because the handle time was calculated at the end of the call when ACW was submitted. |
| Avg Talk | The average number of seconds spent interacting on a media type. Calculated by: Total Talk time / Count of interactions with Talk time |
| Interactions Analyzed | The number of interactions transcribed and/or analyzed by speech and text analytics for each individual agent. |
| <Topic name> | The speech and text analytics topic that was used to analyze the interaction. |
| No Topics Detected | The number of interactions without a topic. |
| Average Sentiment Score | The average sentiment score of interactions. |
| Negative Interactions | The number of interactions during which the average sentiment is < -20. |
| Negative Interactions % | The percent of all interactions that have an overall negative sentiment score (< -20). |
| Neutral Interactions | The number of interactions during which the average sentiment is >= -20 and < +20. |
| Neutral Interactions % | The percent of all interactions that have an overall neutral sentiment score (>= -20 and < +20). |
| Positive Interactions | The number of interactions during which the average sentiment is >= +20. |
| Positive Interactions % | The percent of all interactions that have an overall positive sentiment score (>= +20). |
| Avg Agent Talk | The average agent talk time. |
| Avg Agent Talk % | The average agent talk time as a percentage of interactions. |
| Avg Customer Talk | The average customer talk time. |
| Avg Customer Talk % | The average customer talking time as a percentage of interactions. |
| Avg Hold/Music | The average of hold time and music time across interactions. |
| Avg Hold/Music % | The average hold and music time as a percentage of interactions. |
| Avg Overtalk | The average overtalk time across interactions, where both the agent and customer talk at the same time. |
| Avg Overtalk % | The average overtalk time as a percentage of interactions, where both the agent and customer talk at the same time. |
| Avg Silence | The average silent time across interactions. |
| Avg Silence % | The average silent time as a percentage of interactions. |
| Avg Talk and Silence | The average of both the talking time and silent time. |
| Overtalk Instances | The number of instances of overtalk time, where both the agent and customer talk at the same time. |
| Sentiment | Shows the spread of sentiment for the topics shown. |
Agent Workitems Performance Detail view
Performance
| Column | Description |
|---|---|
| ASA | The average amount of time an interaction waits in the queue before an agent answers. This metric does not include interactions that agents do not answer. Average Speed of Answer (ASA) is directly associated with the service level and provides insight into the customer service your organization provides. ASA is recorded in the interval in which the agent answered the interaction. Calculated by: Total Answered (tAnswered Sum) / Answered Count (tAnswered Count) Note: Raw values are provided in milliseconds. |
| Agent Transfer | The number of workitems transferred by an agent to another agent. |
| Alert | The number of times agents receive an alert for interactions. |
| Answered | The number of workitems answered by an agent via routing, manual assignment, or transfer. |
| Avg Handle |
The average amount of time agents spent handling interactions. This calculation includes talk time, hold time, and after-call work. For outbound calls it also includes dialing and contacting time. Calculated by: (cumulative talk time + cumulative hold time + cumulative after-call work + cumulative dialing time + cumulative contacting time) / Number of interactions handled Note: The interactions can span multiple time intervals. For example, a 45-minute call spans two 30-minute intervals. However, metrics are assigned a single timestamp and reported in the interval into which this timestamp falls. The timestamps are assigned based on when the metric calculation is complete.
For instance, handle time will use the timestamp of after call work completion. In the example of a 45-minute call, the handle time falls in the second 30-minute interval because the handle time was calculated at the end of the call when ACW was submitted. In these views, the Avg Talk, Avg Hold, and Avg ACW columns do not equal the Avg Handle column because only some interactions include holds. This view calculates the average handle column using cumulative counts rather than averages. |
| Avg Hold Handled | The average time any interaction spent on hold. This calculation takes into account all interactions handled, not just those that were held. Calculated by: Total Hold Time / Number of Interactions Handled. |
| Declined | The number of workitems declined. |
| Disconnected | The number of workitems disconnected. |
| Focus | The number of times an agent has a workitem in focus. This number can be higher than the count of workitems handled as the number helps to identify each time an agent has a workitem in focus (vs. on hold). |
| Handled | The number of workitems handled by agents in a queue. |
| Hold | The number of interactions with holds. |
| Interval | This column is preselected based on the interval defined in the time filter. |
| Max Alert | The maximum number of times an agent was alerted for a workitem. |
| Max Focus | The maximum amount of time an agent spent focusing on a workitem. |
| Max Hold | The maximum amount of time spent on hold for the selected interval. |
| Max Park | The maximum amount of time a workitem was parked by an agent. |
| Min Focus |
The minimum amount of time an agent spent focusing on a workitem. |
| Min Hold | The minimum amount of time spent on hold for the selected interval. |
| Min Park | The minimum amount of time a workitem was parked by an agent. |
| Not Responding |
The time an agent was being alerted without responding to a workitem. |
| Parked | The number of workitems parked by agents in a queue. |
| Queue Transfer | The number of workitems transferred by a queue to another agent. |
| Terminated | The number of workitems terminated. |
| Total Hold | The overall hold time for a workitem. |
| Avg Hold | The average hold time for a workitem. Calculated by: (tWorkitemsHeldComplete.sum / tWorkitemsHeldComplete.count) |
| Timed Out | The number of workitems with agent timeouts. |
| Total Focus | The total amount of time an agent spent focusing on a workitem. This time can be less than the Total Handled duration that an agent parks or puts a workitem on hold. |
| Total Handle | The total amount of time agents spend on an interaction including time spent contacting, time spent dialing, talk time, hold time, and after call work. |
| Total Park | The total amount of time a workitem was parked by an agent. |
| Transfer | The number of all transfers made by an agent in a queue. This number includes both blind and consult transfers. A transfer is counted on the queue in which an agent answers the interaction. |
| Transfer % | The number of transfers compared to the total number of interactions answered. Calculated by: (# of transfers / Interactions Answered) * 100 |
| Wrap-Up | The number of wrap-ups added. |
| Wrap-Up Removed | The number of wrap-ups removed. |
Routing
For an overview of routing methods, see Routing and evaluation methods.
| Column | Description |
|---|---|
| Bullseye Requested | The number of interactions in which bullseye routing was requested. |
| Bullseye Used | The number of answered interactions in which bullseye routing was used. |
| Direct Requested | The number of interactions assigned directly to a user via the API or the list view. Note: The workitems using direct routing does not alert the agents. But these workitems are found in the list view assigned to the appropriate user. |
| Direct Used | The routing method used to assign a workitem to an agent. |
| Manual Used | The number of answered interactions in which manual routing was used. |
| Preferred Requested | The number of answered interactions in which preferred agent routing was used. |
| Bullseye Requested % | The rate of answered workitems in which the bullseye routing was requested when compared with all answered workitems. |
| Direct Requested % | The rate of answered workitems in which the direct routing was requested when compared with all answered workitems. |
| Preferred Requested % | The rate of workitems in which the preferred agent routing was requested when compared with all answered workitems. |
| Standard Requested % | The rate of workitems in which the standard routing was requested when compared with all answered workitems. |
| Preferred Used | The number of answered interactions in which preferred agent routing was used. |
| Standard Requested | The number of answered interactions in which standard routing was requested. |
| Standard Used | The number of answered interactions in which standard routing was used. |
For real-time examples and more advanced Workitems metric definitions, see Genesys Cloud Developer Center.
Agent Workitems Performance Summary view
Performance
| Column | Description |
|---|---|
| ASA | The average amount of time an interaction waits in the queue before an agent answers. This metric does not include interactions that agents do not answer. Average Speed of Answer (ASA) is directly associated with the service level and provides insight into the customer service your organization provides. ASA is recorded in the interval in which the agent answered the interaction. Calculated by: Total Answered (tAnswered Sum) / Answered Count (tAnswered Count) Note: Raw values are provided in milliseconds. |
| Agent | The name of the agent. |
| Agent Transfer | The number of workitems transferred by an agent to another agent. |
| Alert | The number of times agents receive an alert for interactions. |
| Answered | The number of workitems answered by an agent via routing, manual assignment, or transfer. |
| Avg Handle |
The average amount of time agents spent handling interactions. This calculation includes talk time, hold time, and after-call work. For outbound calls it also includes dialing and contacting time. Calculated by: (cumulative talk time + cumulative hold time + cumulative after-call work + cumulative dialing time + cumulative contacting time) / Number of interactions handled Note: The interactions can span multiple time intervals. For example, a 45-minute call spans two 30-minute intervals. However, metrics are assigned a single timestamp and reported in the interval into which this timestamp falls. The timestamps are assigned based on when the metric calculation is complete.
For instance, handle time will use the timestamp of after call work completion. In the example of a 45-minute call, the handle time falls in the second 30-minute interval because the handle time was calculated at the end of the call when ACW was submitted. In these views, the Avg Talk, Avg Hold, and Avg ACW columns do not equal the Avg Handle column because only some interactions include holds. This view calculates the average handle column using cumulative counts rather than averages. |
| Avg Hold Handled | The average time any interaction spent on hold. This calculation takes into account all interactions handled, not just those that were held. Calculated by: Total Hold Time / Number of Interactions Handled. |
| Declined | The number of workitems declined. |
| Disconnected | The number of workitems disconnected. |
| Focus | The number of times an agent has a workitem in focus. This number can be higher than the count of workitems handled as the number helps to identify each time an agent has a workitem in focus (vs. on hold). |
| Handled | The number of workitems handled by agents in a queue. |
| Hold | The number of interactions with holds. |
| Max Alert | The maximum number of times an agent was alerted for a workitem. |
| Max Focus | The maximum amount of time an agent spent focusing on a workitem. |
| Max Hold | The maximum amount of time spent on hold for the selected interval. |
| Max Park | The maximum amount of time a workitem was parked by an agent. |
| Min Focus |
The minimum amount of time an agent spent focusing on a workitem. |
| Min Hold | The minimum amount of time spent on hold for the selected interval. |
| Min Park | The minimum amount of time a workitem was parked by an agent. |
| Not Responding |
The time an agent was being alerted without responding to a workitem. |
| Parked | The number of workitems parked by agents in a queue. |
| Queue Transfer | The number of workitems transferred by a queue to another agent. |
| Total Hold | The overall hold time for a workitem. |
| Avg Hold | The average hold time for a workitem. Calculated by: (tWorkitemsHeldComplete.sum / tWorkitemsHeldComplete.count) |
| Terminated | The number of workitems terminated. |
| Timed Out | The number of workitems with agent timeouts. |
| Total Focus | The total amount of time an agent spent focusing on a workitem. This time can be less than the Total Handled duration that an agent parks or puts a workitem on hold. |
| Total Handle | The total amount of time agents spend on an interaction including time spent contacting, time spent dialing, talk time, hold time, and after call work. |
| Total Park | The total amount of time a workitem was parked by an agent. |
| Transfer | The number of all transfers made by an agent in a queue. This number includes both blind and consult transfers. A transfer is counted on the queue in which an agent answers the interaction. |
| Transfer % | The number of transfers compared to the total number of interactions answered. Calculated by: (# of transfers / Interactions Answered) * 100 |
| Wrap-Up | The number of wrap-ups added. |
| Wrap-Up Removed | The number of wrap-ups removed. |
Routing
For an overview of routing methods, see Routing and evaluation methods.
| Column | Description |
|---|---|
| Bullseye Requested | The number of interactions in which bullseye routing was requested. |
| Bullseye Used | The number of answered interactions in which bullseye routing was used. |
| Direct Requested | The number of interactions assigned directly to a user via the API or the list view. Note: The workitems using direct routing does not alert the agents. But these workitems are found in the list view assigned to the appropriate user. |
| Direct Used | The routing method used to assign a workitem to an agent. |
| Manual Used | The number of answered interactions in which manual routing was used. |
| Preferred Requested | The number of answered interactions in which preferred agent routing was used. |
| Preferred Used | The number of answered interactions in which preferred agent routing was used. |
| Bullseye Requested % | The rate of answered workitems in which the bullseye routing was requested when compared with all answered workitems. |
| Direct Requested % | The rate of answered workitems in which the direct routing was requested when compared with all answered workitems. |
| Preferred Requested % | The rate of workitems in which the preferred agent routing was requested when compared with all answered workitems. |
| Standard Requested % | The rate of workitems in which the standard routing was requested when compared with all answered workitems. |
| Standard Requested | The number of answered interactions in which standard routing was requested. |
| Standard Used | The number of answered interactions in which standard routing was used. |
For real-time examples and more advanced Workitems metric definitions, see Genesys Cloud Developer Center.
Agents Evaluation Detail view
| Column | Description |
|---|---|
| Release Date/Time | The date and time that the evaluation was released for the agent to view. Click the time to open the evaluation. |
| Score | The overall evaluation score based upon an evaluator's responses on an evaluation form. |
| Critical Score | The evaluation score based upon an evaluator's responses to critical questions on the evaluation form. |
| Evaluation Form Name | The name of the evaluation form used to score the agent. |
| Evaluator | The name of the person who completed the evaluation. |
| Reviewed By Agent | Whether the agent has reviewed the evaluation. |
| Interaction Date / Time | The date and time of the interaction. |
| Evaluation Date / Time | The date and time of the evaluation. |
| Media Type | The media type of the interaction. |
| Agent Comments | Whether an agent has left a comment. |
Agents Evaluation Summary view
| Column | Description |
|---|---|
| Evaluations | The number of evaluations released for the selected agents. |
| Avg Score | The average score of evaluations released for the selected agents. |
| Avg Critical Score | The average critical score of released evaluations completed for selected agents. |
| Highest Score | The highest evaluation score an agent received for released evaluations. |
| Lowest Score | The lowest evaluation score an agent received for released evaluations. |
| Highest Critical Score | The highest critical evaluation score an agent received for released evaluations. |
| Lowest Critical Score | The lowest critical evaluation score an agent received for released evaluations. |
| Division | Displays the name of a division that an agent or queue belongs to. For more information, see About access control. |
| Station | Icon that shows if an agent is associated with a station. Hover over the icon to display the Station Name. This column is not included in an exported CSV file or PDF report. |
| Agent | The full name for the user. |
| ID | Unique system ID for the user. |
Email address configured for the user. |
Agents Interactions Detail view
Evaluations
| Column | Description |
|---|---|
| Column | Description |
| Evaluated Agent | A comma-separated list of names of evaluated agents for any associated evaluations. |
| Evaluation Assignee | A comma-separated list of names of evaluation assignees for the associated evaluations. |
| Evaluation Created | Displays whether the interaction has an evaluation associated with it. |
| Evaluation Critical Score | The status and value of the evaluation critical score. See Evaluation scoring. |
| Evaluation Score | The score for any associated evaluations. |
| Evaluation Status | The status for any associated evaluations. |
| Evaluator | A comma-separated list of names of evaluators for the associated evaluations. |
External Contact
| Column | Description |
|---|---|
| Column | Description |
| External Contact | Displays the first and last name of the contact. |
| External Organization | Displays the organization name. |
Flows
| Column | Description |
|---|---|
| Column | Description |
| All Flow Disconnect | The total number of times a flow disconnected entries, including: Customer Disconnects, Flow Disconnects, and System Error Disconnects. |
| Customer Disconnect | The number of times customers disconnected in a flow, including the percentage of customer disconnects compared with the disconnect count. |
| Customer Short Disconnect | The number of times customers disconnected in a flow before a short disconnect time. Includes the percentage of customer short disconnects compared with the disconnect count. The default short disconnect time is less than 10 seconds, though administrators can set the short disconnect time to any threshold they want. For more information, see the Configure analytics settings section in Configure contact center analytics options. |
| Failed Outcomes | Displays a list of failed flow outcomes for the interaction. |
| Flow | The name of the flow that the interaction used. |
| Flow Disconnect | The number of times a flow disconnected entries, including the percentage of flow disconnects compared with the total number of disconnects. |
| Flow Exit | The number of times an entry exited a flow to another flow. Includes the percentage of flow exits compared with the total number of exits. |
| Incomplete Outcomes | Displays a list of incomplete flow outcomes for the interaction. |
| Outcome Attempts | The number of flow outcomes in the interaction. |
| Outcome Failure | The number of flow outcomes that were failures. Includes the percentage of failure outcomes compared with the total number of outcomes. |
| Outcome Success | The number of flow outcomes that were success. Includes the percentage of success outcomes compared with the total number of outcomes. |
| Successful Outcomes | Displays a list of successful flow outcomes for the interaction. |
| System Error Disconnect | The number of times entries disconnected in a flow due to a system error. This column includes the percentage of system error disconnects compared with the total number of disconnects. |
Interactions
| Column | Description |
|---|---|
| Column | Description |
| Media Type | The type of media used. |
| Inbound Audio | The number of inbound audio or voice messages received from a customer. Notes: Since messaging is asynchronous, in rare instances, when an agent ends an interaction while an end customer finishes recording and sending a voice note, the last audio file attachment or voice note is not considered for analytics. The audio attachment of the conversation remains intact and is preserved as part of the conversation. There is no data loss. The agent still receives and views the voice note. You can see the impact only in the count of the inbound audio metric. The inbound audio metric can be undercounted. |
| Outbound Audio | The number of outbound audio or voice messages sent by an agent. |
| MOS | The estimated average Mean Opinion Score (MOS) for the voice interaction among all the audio streams within the conversation. MOS is a measure of audio quality at specific measurement points of voice interaction. Potential measurement points include premises-based and cloud-based Edge devices. The measurement is based on codec type, average jitter, latency, and packet loss. Genesys Cloud displays the lowest MOS for each communication that occurs during the whole call. MOS ranges from 1 (bad) to 5 (excellent). Scores below 3.5 indicate unacceptable quality, and scores above 4.3 indicate high quality. |
| Media | The total number of inbound and outbound media for an interaction. |
| Fax | Displays Yes if a fax was present during the interaction. Displays No if a fax was not present during the interaction. |
| Group Ring | Displays the group name for the voice interactions alerted via group ring. |
| Users | The internal users alerted or involved. |
| Screen Recorded | Yes indicates that the conversation was initially screen recorded. It does not consider whether the customer's policies retained it. No indicates that the conversation was not screen recorded. |
| Remote | Information about the external participants. |
| Date | The date the interaction started. |
| Conversation Duration |
The length of the interaction. Calculated by: (Conversation End – Conversation Start) |
| Direction | Displays whether the interaction was inbound, outbound, or inbound/outbound. |
| Initial Direction | Displays whether the interaction started as inbound or outbound. |
| ANI | The number of the person who dialed. |
| DNIS | The original number dialed for the interaction. |
| Queue | The associated queues. |
| Wrap-up | The wrap-up code selected by the agent. |
| Transferred | Indicates interactions that were transferred. A transfer counts for the queue in which an agent answers the interaction. |
| Abandoned | Displays whether a customer abandoned the interaction or not. |
| Abandoned in Queue | The name of the queue in which the Abandon occurred. |
| Agent Assist | Displays whether an interaction had Agent Assist or not. |
| To | The email address or SMS number that the interaction is sent to. This field cannot have more than 10 email addresses.The maximum number of recipients displayed in the To field is 10. |
| From | The email address or SMS number from which the interaction is sent. |
| Email CC | The email addresses to which a copy of the email is sent to. This field cannot have more than 10 email addresses. The maximum number of recipients displayed in the CC field is 10. |
| Email BCC | The email addresses to which a copy of the email is sent to, but that name is not visible to other recipients of the message. This field cannot have more than 10 email addresses. The maximum number of recipients displayed in the BCC field is 10. |
| Flagged | Indicates calls flagged for voice quality issues. For more information about flagging calls, see Flag a problematic voice interaction or Flag a problematic phone call. |
| Wrap-up Notes | Whether an agent wrote a wrap-up note or not. If the agent wrote a note, a preview of the note displays when you hover over the column. |
| Blind Transferred | Displays whether the interaction had a blind transfer. |
| Barged-in | Indicates whether a supervisor barged into the conversation. |
| Cleared by Customer | Indicates whether the conversation was cleared by the customer. |
| Coached | Indicates whether a supervisor coached on the conversation. |
| Co-browse | Displays whether the interaction had a co-browse session. |
| Consulted | Displays whether the interaction had a consult. |
| Consult Transferred | Displays whether the interaction had a consult transfer. |
| Conversation ID | The specific conversation ID for the interaction. |
| Division | Displays the divisions associated with the interaction. See About access control. |
| End Date | The time and date the interaction ended. This column is blank if the interaction is still in progress. |
| Message Type | The ACD message type used. |
| Non-ACD | Displays whether the interaction involved ACD. |
| Recording | Yes indicates that the conversation was initially recorded at the external trunk by the Edge. It does not consider whether the customer's policies actually retained it. No indicates that the conversation was not recorded at the external trunk by the Edge. N/A indicates a digital interaction. |
| Screen Share | Displays whether the interaction contains a screen share session. |
| SIP Call ID | Displays the globally unique identifier embedded in all SIP requests and responses for the interaction. |
| Users - Alerted | The agents Genesys Cloud alerted for the interaction. |
| Users - Interacted | The users who actually interacted during the interaction. |
| Voicemail | Displays whether the interaction has voicemail. Includes personal and queue voicemail. |
| Session DNIS | Any DNIS number dialed during the interaction, including the original DNIS number. |
| Inbound Media | The count of inbound media for an interaction. |
| Has Media | Indicates when message-type conversations have media (images, files, and so on) attached. |
| Provider | The source provider for the conversation. For example, Genesys Cloud EMAIL, Edge, and so on. |
| Emails Sent | Count of the number of emails sent by an agent, including Reply All and Forward. |
| Monitored | Whether the interaction was monitored. |
| First Queue | First queueID in the conversation, formatted as name. |
| Last Wrap-Up | The last wrap-up code used on the conversation. |
| Disconnect Type | The reason the interaction got disconnected.
|
| Subject | First instance of an email subject in the conversation. |
| Flow-Out Type | Shows the type of flowout for a conversation that was a flowout from a queue. |
| Error Code | The name of the error code for the interaction. For more information, see Station errors and Error codes. |
| Outbound Media | The number of outbound media for an interaction. |
| Users - Not Responding | The agents who did not answer the interaction, and the agent may have transitioned to Not Responding. |
| Authenticated | Yes for an authenticated web messaging interaction, No for a web messaging interaction that is not authenticated, or N/A if not a web messaging interaction. |
| External Tag | Displays the external tag that is attached to the conversation record. Note: This data is not available for web chat interactions. |
| Parked | Displays if the interaction has been parked. |
| Delivery Status | The status of the attempted delivery of email, SMS, and WhatsApp messages. The Email delivery status is available for the agentless emails sent via the email campaigns or Agentless Email Notification API. The SMS delivery status is available for all outbound SMS messages including agentless and agent-sent SMS messages. The WhatsApp delivery Status is available for all inbound and outbound WhatsApp messages, including agentless and agent-sent WhatsApp messages. Supported Delivery Status metrics for email and SMS messages include:
Supported Delivery Status metrics for WhatsApp messages include:
|
| Delivery Status Details | Additional details about the delivery, including engagement metrics. For more information, see SMS delivery receipts, Email delivery receipts, and WhatsApp delivery receipts. |
| Conversation Initiator | Displays interactions initiated by a selected initiator (external, user, workflow, customer, or agent). |
| Customer Participation | Displays email and message interactions during which a customer participated, or a customer did not participate. |
| Social Classification | Displays the type of social listening data such as Public or Private. Lists one value for each interaction. The social listening data is classified as public or private based on the type of first conversation received. For example:
|
Journey
| Column | Description |
|---|---|
| Column | Description |
| Has Customer Journey Data | Displays whether an interaction has Predictive Engagement customer journey data associated with it. |
| Proactive | Displays whether Predictive Engagement offered a chat during a customer's website visit based on the Predictive Engagement action map settings. |
Metrics
| Column | Description |
|---|---|
| Column | Description |
| Alert Segments | The number of alerts. |
| Inbound Messages | The number of individual messages exchanged during a conversation where the session’s direction is inbound. It includes all messages sent by both the customer and the agent. |
| Outbound Messages | The number of individual messages exchanged during a conversation where the session’s direction is outbound. It includes all messages sent by both the customer and the agent. |
| Messages | The total number of individual messages exchanged during a conversation. This number includes both the inbound and outbound messages sent by both the customer and the agent. |
| Inbound SMS/MMS Segments | The number of message segments based on their segment count. |
| Outbound SMS/MMS Segments | The number of message segments based on their segment count. |
| Agentless Emails | The number of emails sent by a campaign excluding the emails sent by an agent. |
| Blind Transfers | The number of interactions an agent answered in one queue and then blind transferred. A blind transfer counts for the queue in which an agent answers the interaction. |
|
Callback - Time to first connect |
The amount of time between the start of the callback ACD and the start of the first interaction segment on the voice channel. Note: This metric tracks the time from ACD to agent connect. If a callback is directly transferred from one agent to another agent, the callback is not associated with that ACD queue, and the time to connect is not calculated. |
|
Callback - Time to first dial |
The amount of time between the start of the callback ACD and the start of the first dialing segment on the voice channel. Note: This metric tracks the time from ACD to agent dial. If a callback is directly transferred from one agent to another agent, the callback is not associated with that ACD queue, and the time to dial is not calculated. |
| Consults | The number of interactions an agent answered and then consulted with another participant with or without fully transferring the interaction. A consult counts for the queue in which an agent answers the interaction, even if they consult with another queue. |
| Consult Transfers | The number of call interactions an agent answered in one queue and then consult transferred, meaning they connected with a person or queue before transferring the call. A consult transfer counts for the queue in which an agent answers the interaction. See Consult transfer a call. |
| Contacting Segments | The number of times during an interaction where the system was connecting to the agent's phone before dialing out. |
| Dialing Segments | The number of times during an interaction that the system dials out. |
| Hold Segments | The number of times the agent places the customer on hold. |
| IVR Segments | The number of times the interaction enters an IVR. |
| Queue Segments | The number of times an interaction enters a queue. For example, if an agent accepts an interaction in queue A, transfers it to queue B, and then an agent transfers the interaction back to queue A, then Queue Segments equal 3. |
| Talk Segments | The number of times an agent and customer talk. For example, in an interaction where an agent accepts an interaction, talks to the customer, places the customer on hold, and then talks the customer again, the Talk Segment equals 2. |
| Total ACW | The cumulative time spent in after-call work (ACW) on all interactions. After-call work is the work that an agent performs immediately following an interaction. Work may involve keying activity codes, updating customer databases, filling out forms, or initiating outbound contact. As a metric, it indicates the total time an agent takes to finish working on a call. If an agent must complete work before the agent can handle the next contact, then ACW is factored into the average handle time. |
| Total Alert | The total time Genesys Cloud alerts agents before the agent accepts or declines an interaction. |
| Total Contacting | The total time an interaction spent connecting to the agent's phone before dialing out. |
| Total Dialing | The total time spent dialing out. |
| Total Handle | The total amount of time agents spend on an interaction including time spent contacting, time spent dialing, talk time, hold time, and after call work. |
| Total Hold | The total amount of time the customer was on hold. |
| Total IVR | The total amount of time spent in IVR. |
| Total Queue | The amount of time the interaction spent waiting on an Automatic Call Distributor before connecting to an agent. |
| Total Talk |
The total amount of time the agent spends talking to the customer. For example, in an interaction where an agent accepts an interaction, talks to the customer for two minutes, places the customer on hold for one minute, and then talks to the customer again for two minutes, the Total Talk equals 4 minutes. Note: The total Talk times for Callbacks currently include both the agents' Callback session and agents' Call session, which results in an inflated time. For more information on callback analytics improvements, see Callback analytics improvements. |
| Transfers | A measurement of the number of interactions an agent answered in one queue and then transferred. A transfer counts for the queue in which an agent answers the interaction. This measurement is calculated by the number of interactions blind transferred or consult transferred. |
| Time to Abandon | The duration of time until the conversation was abandoned. |
| Total Barge-In | Total time spent on the interaction after barging into the conversation. |
| Total Coaching | Total time spent coaching in the conversation. |
| Total Voicemail | Total duration of voicemails included in the conversation. |
| User Segments | The number of times an agent (user) was on an interaction. For example, if agent A answered an email interaction twice, and agent B answered the same email interaction once, then user segments would be 3. |
| Wrap-up Segments | The number of times an interaction was in wrap-up. |
| Total Monitor | Total time that the user spent monitoring interactions. |
| Error Count | The number of errors for the interaction. |
| Active Total Callback | Active total callback duration is the sum of all calling activity for the call portions of the callback. For example, the active total callback duration could include all durations from the call portion of a callback: tContacting --> tDialing --> tTalk --> tHeld --> tTalk --> tAcw. |
| Active Park | Displays the duration of the interaction that is currently parked. |
| Total Park | Displays the total parked duration of the completed interaction. |
| Not Responding | The number of times an agent did not respond to the interaction. |
Outbound
| Column | Description |
|---|---|
| Column | Description |
| Campaign Name | The name of the campaign associated with the interaction. |
| Contact List | The name of the contact list associated with the interaction. |
| Contact ID | The contact ID associated with the interaction. |
| Call Analysis Result |
The type of call detected based on call analysis. Results include disconnect, live voice, busy, machine, no answer, SIT callable, fax, line connected, speech, SIT uncallable, and not found. |
| Outbound Attempt | The number of attempts made to call the customer. |
| Campaign | Whether an interaction has a campaign associated with it. |
| Campaign Start | The start date of the first outbound call of a campaign. |
| Time to Flow | The amount of time it took for the campaign call to enter a flow. |
| Time to Agent | The amount of time it took for the campaign call to reach an agent. |
| Campaign Caller Name | The name of the customer being called by the campaign. |
Routing
| Column | Description |
|---|---|
| Column | Description |
| Agent Bullseye Ring | Indicates the bullseye ring an agent is assigned to. |
| Bullseye Ring | Indicates the bullseye ring in which the interaction was answered. |
| Direct Routing | Indicates whether Direct Routing was requested and/or used. |
| Languages | Displays the languages set by the routing service for the interaction. |
| Manual Agents Assigned | On-queue agents who were manually assigned this waiting interaction. |
| Manual Assigner | User with the appropriate permissions who manually assigned this interaction to a waiting agent in the queue. |
| Predictive Agent Selected | Lists the agents used during predictive routing. |
| Predictive Agents Proposed |
Lists the agents evaluated during predictive routing. Note: If your role does not include the Routing > Predictor > View permission, then the Predictive Agents Proposed column does not appear.
|
| Preferred Agents | Lists the preferred agents requested during interaction routing, even if the system was not able to route the interaction to the preferred agents. Includes the agent's routing score. |
| Preferred Agents Requested | Displays whether an interaction had preferred agents requested due to preferred agents configuration, even if the system was not able to route the interaction to the preferred agents. |
| Preferred Rule | Indicates the rule in for the preferred agent. |
| Routing Requested | Displays the routing methods that were requested for the interaction. Gives insight into each of the routing methods the conversation went through prior to being answered, abandoned, or flow-out. The routing data is relevant beginning September 5, 2020. |
|
Routing Rule |
Indicates the routing rings associated with an interaction. |
| Routing Used | Displays the routing method that was used to get to the agent who answered the interaction. The routing data is relevant beginning September 5, 2020. |
| Skills | Displays the original skills that came from the flow. |
| Skills - Active | Displays the skills remaining on the interaction used for routing. |
| Skills — Removed | Displays skills removed from the interaction through bullseye routing. |
Surveys
| Column | Description |
|---|---|
| Column | Description |
| Has Survey Data | Displays whether an interaction is associated with survey data. |
| Promoter Score | The promoter score given by a survey respondent in a survey. Genesys Cloud uses the promoter score to calculate the survey's overall NPS. For more information about NPS, see Net Promoter Score web survey question overview. |
| Survey Form | The name of the survey form sent. |
| Survey Score | The completed surveys' percentage score. The score does not include NPS. |
| Survey Status |
Displays the status of the survey:
|
| Surveys | The number of surveys sent related to the interaction. |
| Survey Type | Displays the type of the survey, such as voice or web. One value is listed for each survey that is associated with the interaction. |
Agents Performance Detail view
Performance
| Metric | Definition | Columns live update |
|---|---|---|
| Metric | Definition | Columns live update |
| Answer | A measurement of the number of assigned ACD interactions answered by an agent in a given period. Answered increments when the agent is the first to connect to the interaction. |
Yes |
| Handle | The total number of ACD and non-ACD interactions that agents were involved in for the selected media type. Handle increments in the interval in which the interaction ends, after the agent completes any after call work and completes the interaction. |
Yes |
| ASA | The average amount of time an interaction waits in the queue before an agent answers. This metric does not include interactions that agents do not answer. Average Speed of Answer (ASA) is directly associated with the service level and provides insight into the customer service your organization provides. ASA is recorded in the interval in which the agent answered the interaction. Calculated by: Total Answered (tAnswered Sum) / Answered Count (tAnswered Count) Note: Raw values are provided in milliseconds. |
Yes |
| Avg Handle | The average amount of time agents spent handling interactions. This calculation includes talk time, hold time, and after-call work. For outbound calls it also includes dialing and contacting time. Calculated by: (cumulative talk time + cumulative hold time + cumulative after-call work + cumulative dialing time + cumulative contacting time) / Number of interactions handled Note: The interactions can span multiple time intervals. For example, a 45-minute call spans two 30-minute intervals. However, metrics are assigned a single timestamp and reported in the interval into which this timestamp falls. The timestamps are assigned based on when the metric calculation is complete.
For instance, handle time will use the timestamp of after call work completion. In the example of a 45-minute call, the handle time falls in the second 30-minute interval because the handle time was calculated at the end of the call when ACW was submitted. |
Yes |
| Avg Talk | The average number of seconds spent interacting on a media type. Calculated by: Total Talk time / Count of interactions with Talk time |
Yes |
| Avg Hold | The average number of seconds that interactions were placed on hold. Calculated by: Total Hold Time / Count of interactions with holds |
Yes |
| Avg ACW | The average amount of time agents spent completing after-call work. Calculated by: Total ACW / Interactions with ACW |
Yes |
| Avg Dialing | The average amount of time an agent spends dialing and waiting for a contact to answer during outbound interactions.
Calculated by: (total dialing time/ total number of dialing segments) |
Yes |
| Avg Contacting | The average amount of time an outbound interaction takes to connecting to the agent’s phone. Usually, this duration is short. However, if the agent uses a remote phone the duration may be longer. |
Yes |
| Total Handle | The total amount of time agents spend on an interaction including time spent contacting, time spent dialing, talk time, hold time, and after call work. |
Yes |
| Total Talk | The total amount of time spent interacting on all the conversations by the agent, within an interval. For example, in an interaction, where an agent accepts an interaction, talks to the customer for two minutes, places the customer on hold for one minute, and then talks to the customer again for two minutes, the Total Talk equals 4 minutes. |
Yes |
| Total Hold | The cumulative hold time for all interactions. |
Yes |
| Total ACW | The cumulative time spent in after-call work (ACW) on all interactions. After-call work is the work that an agent performs immediately following an interaction. Work may involve keying activity codes, updating customer databases, filling out forms, or initiating outbound contact. As a metric, it indicates the total time an agent takes to finish working on a call. If an agent must complete work before the agent can handle the next contact, then ACW is factored into the average handle time. |
Yes |
| Total Dialing | The total amount of time an outbound interaction spends dialing a contact. |
Yes |
| Total Contacting | The total amount of time outbound interactions take to connect to the agent’s phone. Usually, this duration is short. However, if the agent uses a remote phone the duration may be longer. |
Yes |
| Error | The number of errors that occurred on conversations. |
Yes |
| Hold | The number of interactions with holds. |
Yes |
| Transfer | A measurement of the number of interactions an agent answered in one queue and then transferred. A transfer counts for the queue in which an agent answers the interaction. This measurement is calculated by the number of interactions blind transferred or consult transferred. |
Yes |
| Outbound | This metric represents the number of outbound interactions placed on behalf of queue. |
Yes |
| Alert – No Answer | The number of times an agent was alerted to a conversation but did not answer the conversation. Note: This metric does not specifically count the number of times an agent was placed in a Not Responding routing status. An agent is transitioned to Not Responding status after a specific alert time threshold for ACD-routed conversations. Alert – No Answer can be incremented for all conversation types for any situation where an alert was not followed by an answer event. |
Yes |
| Total Alert – No Answer | The total number of seconds Genesys Cloud offered an agent an interaction before the agent declined the interaction or the interaction timed out. |
Yes |
| Alert | The number of times agents receive an alert for interactions. |
Yes |
| Total Alert | The total time Genesys Cloud alerts agents before the agent accepts or declines an interaction. |
Yes |
| Total Monitor | Total time that the user spent monitoring interactions. |
Yes |
| Avg Monitor | Average time that the user spent monitoring interactions. |
Yes |
| Max Monitor | Maximum time that the user spent monitoring interactions. |
Yes |
| Min Monitor | Minimum time that the user spent monitoring interactions. |
Yes |
| Monitor | Number of interactions that were monitored. |
Yes |
| Transfer % | The number of transfers compared with the total number of interactions answered. Calculated by: (No. of transfers / interactions answered) * 100 |
Yes |
| Min Alert | The minimum amount of time an agent was being alerted. |
Yes |
| Max Alert | The maximum amount of time an agent was being alerted. |
Yes |
| Min Alert – No Answer | The minimum amount of time an agent was being alerted without responding to an interaction. |
Yes |
| Max Alert – No Answer | The maximum amount of time an agent was being alerted without responding to an interaction. |
Yes |
| Min Handle | The minimum amount of time agents were involved in ACD and non-ACD interactions, including answered interactions, transfers, callbacks, and outbound calls. |
Yes |
| Max Handle | The maximum amount of time agents were involved in ACD and non-ACD interactions, including answered interactions, transfers, callbacks, and outbound calls. |
Yes |
| Min Talk | The minimum amount of time spent interacting for the selected interval. |
Yes |
| Max Talk | The maximum amount of time spent interacting for the selected interval. |
Yes |
| Min Hold | The minimum amount of time spent on hold for the selected interval. |
Yes |
| Max Hold | The maximum amount of time spent on hold for the selected interval. |
Yes |
| Min Answer | The minimum amount of time an agent spent answering assigned ACD interactions for the selected interval. |
Yes |
| Max Answer | The maximum amount of time an agent spent answering assigned ACD interactions for the selected interval. |
Yes |
| Min ACW | The minimum amount of time spent on after call work for the selected interval. |
Yes |
| Max ACW | The maximum amount of time spent on after call work for the selected interval. |
Yes |
| Blind Transfer | The number of interactions an agent answered in one queue and then blind transferred. A blind transfer counts for the queue in which an agent answers the interaction. |
Yes |
| Blind Transfer % | The percentage of interactions an agent answered in one queue and then blind transferred. |
Yes |
| Consult Transfer | The number of call interactions an agent answered in one queue and then consult transferred, meaning they connected with a person or queue before transferring the call. A consult transfer counts for the queue in which an agent answers the interaction. See Consult transfer a call. |
Yes |
| Consult Transfer % | The percentage of interactions an agent answered in one queue and then consult transferred. |
Yes |
| Avg Hold Handled | The average time any interaction spent on hold. This calculation takes into account all interactions handled, not just those that were held. Calculated by: Total Hold Time / Number of Interactions Handled. |
Yes |
| Avg ACW Handled | The average time any interaction spent in ACW. This calculation takes into account all interactions handled, not just those that had ACW. Calculated by: Total ACW Time / Number of Interactions Handled |
Yes |
|
ACW |
The number of times after-call work (ACW) was completed. After-call work is the work that an agent performs immediately following an interaction. Work may involve keying activity codes, updating customer databases, filling out forms, or initiating outbound contact. As a metric, it indicates the total time an agent takes to finish working on a call. If an agent must complete work before the agent can handle the next contact, then ACW is factored into the average handle time. Note: By default, the summary of metrics displayed includes all activity for the agent. To filter down to the activities specific to a queue, you can apply a filter. |
Yes |
|
Contacting |
The number of contacting segments for the agent and interval. |
Yes |
|
Dialing |
The number of dialing segments for the agent and interval. |
Yes |
|
Max Contacting |
The maximum amount of time outbound interactions take to connect to the agent’s phone. Usually, this duration is short. However, if the agent uses a remote phone the duration may be longer. |
Yes |
|
Max Dialing |
The maximum amount of time an outbound interaction spends dialing a contact. |
Yes |
|
Min Contacting |
The minimum amount of time outbound interactions take to connect to the agent’s phone. Usually, this duration is short. However, if the agent uses a remote phone the duration may be longer. |
Yes |
|
Min Dialing |
The minimum amount of time an outbound interaction spends dialing a contact. |
Yes |
|
Total Active Callback |
The time an agent spent on a callback while a call is active. |
Yes |
|
Min Active Callback |
The minimum time an agent spent on a callback while a call is active. |
Yes |
|
Max Active Callback |
The maximum time an agent spent on a callback while a call is active. |
Yes |
|
Avg Active Callback |
The average time an agent spent on a callback while a call is active. |
Yes |
|
Active Callback |
The instances of an agent on a callback while a call is active. |
Yes |
|
Talk |
The number of sessions where the user(s) interacted during conversations. A session includes the point where the agent joins the conversation to the point where they disconnect. |
Yes |
Routing
For an overview of routing methods, see Routing and evaluation methods.
| Column | Description | Columns live update |
|---|---|---|
| Bullseye Requested | The number of interactions in which bullseye routing was requested. |
No |
| Bullseye Requested % | The rate of answered interactions in which bullseye routing was requested in comparison to all answered interactions. |
No |
| Bullseye Used | The number of answered interactions in which bullseye routing was used. |
No |
| Bullseye Used % | The rate of interactions in which bullseye routing was used in comparison to all answered interactions. |
No |
|
Conditional Requested |
The number of interactions in which conditional routing was requested. | No |
|
Conditional Requested % |
The rate of answered interactions in which conditional routing routing was requested in comparison to all answered interactions. | No |
|
Conditional Used |
The number of interactions in which conditional routing was used. | No |
|
Conditional Used % |
The rate of interactions in which conditional routing was used in comparison to all answered interactions. | No |
| Direct Requested | The number of interactions in which direct routing was requested. | No |
|
Direct Requested % |
The rate of answered interactions in which direct routing was requested in comparison to all answered interactions. | No |
|
Direct Used |
The number of answered interactions in which direct routing was used. | No |
|
Direct Used % |
The rate of interactions in which direct routing was used in comparison to all answered interactions. | No |
| Last Requested | The number of answered interactions in which last routing was used. See Last agent handling. |
No |
| Last Requested % | The rate of interactions in which last routing was requested in comparison to all answered interactions. See Last agent handling. |
No |
| Last Used | The number of answered interactions in which last routing was used. See Last agent handling. |
No |
| Last Used % | The rate of interactions in which last routing was used in comparison to all answered interactions. See Last agent handling. |
No |
| Manual Used | The number of answered interactions in which manual routing was used. |
No |
| Manual Used % | The rate of interactions in which manual routing was used in comparison to all answered interactions. |
No |
| Predictive Requested | The number of answered interactions in which predictive routing was requested. |
No |
| Predictive Requested % | The rate of interactions in which predictive routing was requested in comparison with all answered interactions. |
No |
| Predictive Used | The number of answered interactions in which predictive routing was used. |
No |
| Predictive Used % | The rate of interactions in which predictive routing was used in comparison with all answered interactions. |
No |
| Preferred Requested | The number of answered interactions in which preferred agent routing was used. |
No |
| Preferred Requested % | The rate of interactions in which preferred agent routing was requested in comparison with all answered interactions. |
No |
| Preferred Used | The number of answered interactions in which preferred agent routing was used. |
No |
| Preferred Used % | The rate of interactions in which preferred agent routing was used in comparison to all answered interactions. |
No |
| Standard Requested | The number of answered interactions in which standard routing was requested. |
No |
| Standard Requested % | The rate of interactions in which standard routing was requested in comparison to all answered interactions. |
No |
| Standard Used | The number of answered interactions in which standard routing was used. |
No |
| Standard Used % | The rate of interactions in which standard routing was used in comparison to all answered interactions. |
No |
Speech and text analytics
| Column | Column Description | Columns live update |
|---|---|---|
| Avg Sentiment | Average customer sentiment score (-100 to 100) in the specified interval with the provided filters. |
No |
| Negative Sentiment Instances | The number of negative sentiment instances. For more information, see Understand sentiment analysis. |
No |
| Overall Avg Sentiment Score | The average overall sentiment score of the interactions. Calculated by: oSentimentScore.sum / oSentimentScore.count |
No |
| Positive Sentiment Instances | The number of positive sentiment instances. For more information, see Understand sentiment analysis. |
No |
| Sentiment Instances | Number of instances of sentiment in the given interval with the provided filters. |
No |
Agents Performance Summary view
Real-time columns
- Time in Status
- Status
- Secondary Status
- Routing Status
- Time in Routing Status
- Station
- Media Types
- Role
- Interactions
- Duration / Duration 2 / Duration 3
- Adherence
- Adherence Duration
- Scheduled Activity
Performance
These metrics represent data for the dates that you selected for the view.
| Metric | Description | Columns live update |
|---|---|---|
| Metric | Description | Columns live update |
|
Active Callback |
The instances of an agent on a callback while a call is active. |
Yes |
|
ACW |
The number of times after-call work (ACW) was completed. After-call work is the work that an agent performs immediately following an interaction. Work may involve keying activity codes, updating customer databases, filling out forms, or initiating outbound contact. |
Yes |
| Adherence | The current adherence status of the user, including In Adherence, Out of Adherence, Unscheduled, Ignored, or Unknown. |
Yes |
| Adherence Duration | The amount of time represented in days, hours, minutes, and seconds, of the adherence exception. |
Yes |
| Agent | The full name for the user. |
No |
| ASA | The average amount of time an interaction waits in the queue before an agent answers. This metric does not include interactions that agents do not answer. Average Speed of Answer (ASA) is directly associated with the service level and provides insight into the customer service your organization provides. ASA is recorded in the interval in which the agent answered the interaction. Calculated by: Total Answered (tAnswered Sum) / Answered Count (tAnswered Count) Note: Raw values are provided in milliseconds. |
Yes |
| Alert | The number of times agents receive an alert for interactions. |
Yes |
| Alert – No Answer | The number of times an agent was alerted to a conversation but did not answer the conversation. Note: This metric does not specifically count the number of times an agent was placed in a Not Responding routing status. An agent is transitioned to Not Responding status after a specific alert time threshold for ACD-routed conversations. Alert – No Answer can be incremented for all conversation types for any situation where an alert was not followed by an answer event. |
Yes |
| Answer | A measurement of the number of assigned ACD interactions answered by an agent in a given period. Answered increments when the agent is the first to connect to the interaction. |
No |
|
Avg Active Callback |
The average time an agent spent on a callback while a call is active. |
Yes |
| Avg ACW | The average amount of time agents spent completing after-call work. Calculated by: Total ACW / Interactions with ACW |
No |
| Avg Hold | The average number of seconds that interactions were placed on hold. Calculated by: Total Hold Time / Count of interactions with holds |
Yes |
| Avg Talk | The average number of seconds spent interacting on a media type. Calculated by: Total Talk time / Count of interactions with Talk time |
No |
| Avg ACW Handled | The average time any interaction spent in ACW. This calculation takes into account all interactions handled, not just those that had ACW. Calculated by: Total ACW Time / Number of Interactions Handled |
No |
| Avg Contacting | The average amount of time an outbound interaction takes to connecting to the agent’s phone. Usually, this duration is short. However, if the agent uses a remote phone the duration may be longer. |
Yes |
| Avg Dialing | The average amount of time an agent spends dialing and waiting for a contact to answer during outbound interactions.
Calculated by: (total dialing time/ total number of dialing segments) |
No |
| Avg Handle | The average amount of time agents spent handling interactions. This calculation includes talk time, hold time, and after-call work. For outbound calls it also includes dialing and contacting time. Calculated by: (cumulative talk time + cumulative hold time + cumulative after-call work + cumulative dialing time + cumulative contacting time) / Number of interactions handled Note: The interactions can span multiple time intervals. For example, a 45-minute call spans two 30-minute intervals. However, metrics are assigned a single timestamp and reported in the interval into which this timestamp falls. The timestamps are assigned based on when the metric calculation is complete.
For instance, handle time will use the timestamp of after call work completion. In the example of a 45-minute call, the handle time falls in the second 30-minute interval because the handle time was calculated at the end of the call when ACW was submitted. |
Yes |
| Avg Hold Handled | The average time any interaction spent on hold. This calculation takes into account all interactions handled, not just those that were held. Calculated by: Total Hold Time / Number of Interactions Handled. |
Yes |
| Avg Monitor | Average time that the user spent monitoring interactions. |
No |
| Blind Transfer | The number of interactions an agent answered in one queue and then blind transferred. A blind transfer counts for the queue in which an agent answers the interaction. |
No |
| Blind Transfer % | The percentage of interactions an agent answered in one queue and then blind transferred. |
No |
| Consult Transfer | The number of call interactions an agent answered in one queue and then consult transferred, meaning they connected with a person or queue before transferring the call. A consult transfer counts for the queue in which an agent answers the interaction. See Consult transfer a call. |
Yes |
| Consult Transfer % | The percentage of interactions an agent answered in one queue and then consult transferred. |
Yes |
|
Contacting |
The number of contacting segments for the agent and interval. |
Yes |
| Department | Department of the user as defined within Genesys Cloud. |
No |
|
Dialing |
The number of dialing segments for the agent and interval. |
Yes |
| Division | Displays the name of a division that an agent or queue belongs to. For more information, see About access control. |
No |
|
Duration Duration 2 Duration 3 |
The amount of time an agent has been working on an interaction. If an agent is working multiple interactions, then Genesys Cloud displays each interaction's duration in a separate column labeled Duration 2 or Duration 3. |
Yes |
Email address configured for the user. |
No | |
| Error | The number of errors that occurred on conversations. |
Yes |
| Group | Official Genesys Cloud groups that the user is part of. |
No |
| Handle | The total number of ACD and non-ACD interactions that agents were involved in for the selected media type. Handle increments in the interval in which the interaction ends, after the agent completes any after call work and completes the interaction. |
Yes |
| Hold | The number of interactions with holds. |
Yes |
| ID | Unique system ID for the user. |
No |
| Interactions | The number of interactions assigned to the queue that agents are currently interacting with. |
Yes |
| Location | Location for the user as defined in Genesys Cloud. |
No |
|
Max Active Callback |
The maximum time an agent spent on a callback while a call is active. |
Yes |
| Max ACW | The maximum amount of time spent on after call work for the selected interval. |
No |
| Max Alert | The maximum amount of time an agent was being alerted. |
Yes |
| Max Alert – No Answer | The maximum amount of time an agent was being alerted without responding to an interaction. |
Yes |
| Max Answer | The maximum amount of time an agent spent answering assigned ACD interactions for the selected interval. |
Yes |
|
Max Contacting |
The maximum amount of time outbound interactions take to connect to the agent’s phone. Usually, this duration is short. However, if the agent uses a remote phone the duration may be longer. |
Yes |
|
Max Dialing |
The maximum amount of time an outbound interaction spends dialing a contact. |
Yes |
| Max Handle | The maximum amount of time agents were involved in ACD and non-ACD interactions, including answered interactions, transfers, callbacks, and outbound calls. |
Yes |
| Max Hold | The maximum amount of time spent on hold for the selected interval. |
Yes |
| Max Monitor | Maximum time that the user spent monitoring interactions. |
Yes |
| Max Talk | The maximum amount of time spent interacting for the selected interval. |
Yes |
| Media Types | The media types an agent is permitted to handle, such as voice, callback, chat, email, and message. |
No |
|
Min Active Callback |
The minimum time an agent spent on a callback while a call is active. |
Yes |
| Min ACW | The minimum amount of time spent on after call work for the selected interval. |
Yes |
| Min Alert | The minimum amount of time an agent was being alerted. |
Yes |
| Min Alert – No Answer | The minimum amount of time an agent was being alerted without responding to an interaction. |
Yes |
| Min Answer | The minimum amount of time an agent spent answering assigned ACD interactions for the selected interval. |
Yes |
|
Min Contacting |
The minimum amount of time outbound interactions take to connect to the agent’s phone. Usually, this duration is short. However, if the agent uses a remote phone the duration may be longer. |
Yes |
|
Min Dialing |
The minimum amount of time an outbound interaction spends dialing a contact. |
Yes |
| Min Handle | The minimum amount of time agents were involved in ACD and non-ACD interactions, including answered interactions, transfers, callbacks, and outbound calls. |
No |
| Min Hold | The minimum amount of time spent on hold for the selected interval. |
No |
| Min Monitor | Minimum time that the user spent monitoring interactions. |
No |
| Min Talk | The minimum amount of time spent interacting for the selected interval. |
Yes |
| Monitor | Number of interactions that were monitored. |
No |
| Outbound | This metric represents the number of outbound interactions placed on behalf of queue. |
Yes |
| Presence | Displays a colored dot related to the agent’s current status. For more information, see Presence, status, and activity indicators overview and Agent presence, status, and activity indicators. | Yes |
| Primary Phone | Phone number for the user as defined in Genesys Cloud. |
No |
| Reports To | The manager as defined for the user within Genesys Cloud. |
No |
| Role | Roles within Genesys Cloud that the user is assigned. |
No |
| Routing Status |
The current routing status of an agent. |
Yes |
| Scheduled Activity | The activity for which the user is currently scheduled, including On Queue Work, Break, Meal, Meeting, Off Queue Work, Time Off, Training, Unavailable, or Unscheduled. |
Yes |
| Secondary Status |
The current secondary status of an agent. If there is no secondary status, then this column displays the agent’s primary status. |
Yes |
| Skills |
The routing skills and languages assigned to an agent. |
No |
| Station | Icon that shows if an agent is associated with a station. Hover over the icon to display the Station Name. | No |
| Status |
The current primary status of an agent, such as Available, Away, or Busy. |
No |
|
Talk |
The number of sessions where the user(s) interacted during conversations. A session includes the point where the agent joins the conversation to the point where they disconnect. |
Yes |
| Time in Routing Status |
The amount of time agents have been in their current routing status. |
Yes |
|
Time in Status |
The amount of time agents have been in their current primary status. |
Yes |
| Title | Title of the user as defined within Genesys Cloud. |
No |
|
Total Active Callback |
The time an agent spent on a callback while a call is active. |
Yes |
| Total ACW | The cumulative time spent in after-call work (ACW) on all interactions. After-call work is the work that an agent performs immediately following an interaction. Work may involve keying activity codes, updating customer databases, filling out forms, or initiating outbound contact. As a metric, it indicates the total time an agent takes to finish working on a call. If an agent must complete work before the agent can handle the next contact, then ACW is factored into the average handle time. |
No |
| Total Hold | The cumulative hold time for all interactions. |
Yes |
| Total Talk | The total amount of time spent interacting on all the conversations by the agent, within an interval. For example, in an interaction, where an agent accepts an interaction, talks to the customer for two minutes, places the customer on hold for one minute, and then talks to the customer again for two minutes, the Total Talk equals 4 minutes. |
Yes |
| Total Alert | The total time Genesys Cloud alerts agents before the agent accepts or declines an interaction. |
Yes |
| Total Alert – No Answer | The total number of seconds Genesys Cloud offered an agent an interaction before the agent declined the interaction or the interaction timed out. |
Yes |
| Total Contacting | The total amount of time outbound interactions take to connect to the agent’s phone. Usually, this duration is short. However, if the agent uses a remote phone the duration may be longer. |
Yes |
| Total Dialing | The total amount of time an outbound interaction spends dialing a contact. |
Yes |
| Total Handle | The total amount of time agents spend on an interaction including time spent contacting, time spent dialing, talk time, hold time, and after call work. |
Yes |
| Total Monitor | Total time that the user spent monitoring interactions. |
Yes |
| Transfer | A measurement of the number of interactions an agent answered in one queue and then transferred. A transfer counts for the queue in which an agent answers the interaction. This measurement is calculated by the number of interactions blind transferred or consult transferred. |
Yes |
| Transfer % | The number of transfers compared with the total number of interactions answered. Calculated by: (No. of transfers / interactions answered) * 100 |
No |
Routing
For an overview of routing methods, see Routing and evaluation methods.
| Column | Description | Columns live update |
|---|---|---|
| Bullseye Requested | The number of interactions in which bullseye routing was requested. |
No |
| Bullseye Requested % | The rate of answered interactions in which bullseye routing was requested in comparison to all answered interactions. |
No |
| Bullseye Used | The number of answered interactions in which bullseye routing was used. |
No |
| Bullseye Used % | The rate of interactions in which bullseye routing was used in comparison to all answered interactions. |
No |
|
Conditional Requested |
The number of interactions in which conditional routing was requested. | No |
|
Conditional Requested % |
The rate of answered interactions in which conditional routing routing was requested in comparison to all answered interactions. | No |
|
Conditional Used |
The number of interactions in which conditional routing was used. | No |
|
Conditional Used % |
The rate of interactions in which conditional routing was used in comparison to all answered interactions. | No |
| Direct Requested | The number of interactions in which direct routing was requested. | No |
|
Direct Requested % |
The rate of answered interactions in which direct routing was requested in comparison to all answered interactions. | No |
|
Direct Used |
The number of answered interactions in which direct routing was used. | No |
|
Direct Used % |
The rate of interactions in which direct routing was used in comparison to all answered interactions. | No |
| Last Requested | The number of answered interactions in which last routing was used. See Last agent handling. |
No |
| Last Requested % | The rate of interactions in which last routing was requested in comparison to all answered interactions. See Last agent handling. |
No |
| Last Used | The number of answered interactions in which last routing was used. See Last agent handling. |
No |
| Last Used % | The rate of interactions in which last routing was used in comparison to all answered interactions. See Last agent handling. |
No |
| Manual Used | The number of answered interactions in which manual routing was used. |
No |
| Manual Used % | The rate of interactions in which manual routing was used in comparison to all answered interactions. |
No |
| Predictive Requested | The number of answered interactions in which predictive routing was requested. |
No |
| Predictive Requested % | The rate of interactions in which predictive routing was requested in comparison with all answered interactions. |
No |
| Predictive Used | The number of answered interactions in which predictive routing was used. |
No |
| Predictive Used % | The rate of interactions in which predictive routing was used in comparison with all answered interactions. |
No |
| Preferred Requested | The number of answered interactions in which preferred agent routing was used. |
No |
| Preferred Requested % | The rate of interactions in which preferred agent routing was requested in comparison with all answered interactions. |
No |
| Preferred Used | The number of answered interactions in which preferred agent routing was used. |
No |
| Preferred Used % | The rate of interactions in which preferred agent routing was used in comparison to all answered interactions. |
No |
| Standard Requested | The number of answered interactions in which standard routing was requested. |
No |
| Standard Requested % | The rate of interactions in which standard routing was requested in comparison to all answered interactions. |
No |
| Standard Used | The number of answered interactions in which standard routing was used. |
No |
| Standard Used % | The rate of interactions in which standard routing was used in comparison to all answered interactions. |
No |
Speech and text analytics
| Column | Column Description | Columns live update |
|---|---|---|
| Avg Sentiment | Average customer sentiment score (-100 to 100) in the specified interval with the provided filters. |
No |
| Negative Sentiment Instances | The number of negative sentiment instances. For more information, see Understand sentiment analysis. |
No |
| Overall Avg Sentiment Score | The average overall sentiment score of the interactions. Calculated by: oSentimentScore.sum / oSentimentScore.count |
No |
| Positive Sentiment Instances | The number of positive sentiment instances. For more information, see Understand sentiment analysis. |
No |
| Sentiment Instances | Number of instances of sentiment in the given interval with the provided filters. |
No |
Agents Queues Detail view
Performance
| Column | Description | Columns live update |
|---|---|---|
| Column | Description | Columns live update |
| Offer | The number of interactions routed into the queue for an agent to answer. Offered interactions are either answered, abandoned, or flow-out interactions. |
Yes |
| Inbound Audio | The number of inbound audio or voice messages received from a customer. Notes: Since messaging is asynchronous, in rare instances, when an agent ends an interaction while an end customer finishes recording and sending a voice note, the last audio file attachment or voice note is not considered for analytics. The audio attachment of the conversation remains intact and is preserved as part of the conversation. There is no data loss. The agent still receives and views the voice note. You can see the impact only in the count of the inbound audio metric. The inbound audio metric can be undercounted. |
Yes |
| Outbound Audio | The number of outbound audio or voice messages sent by an agent. |
Yes |
| Answer % | The percentage of offered interactions that an agent answered. Calculated by: (Answered / Offered) * 100 |
Yes |
| Answered (in Answered % column) | A measurement of the number of assigned ACD interactions answered by an agent in a given period. Answered increments when the agent is the first to connect to the interaction. |
Yes |
| Abandon % | The percentage of offered interactions in which the customer disconnected before connecting with an agent. The abandon rate can identify queues that require extra staff to handle interactions in a timely manner. Calculated by: (Abandoned Count / Offered Count) * 100 |
Yes |
| Abandoned (in Abandoned % column) | The number of times an end user abandoned an interaction in a queue. For example, the customer hangs up before an agent answers, or the system disconnects the interaction. |
Yes |
| Outbound | This metric represents the number of outbound interactions placed on behalf of queue. |
Yes |
| Flow-Out | Flow-outs are interactions that enter and leave a queue without getting answered by an agent and without getting disconnected. Flow-outs are an indication of customer service level and queue productivity. High numbers of flow-outs can indicate staffing issues or ineffective agents when used with high handle times (bullseye matching metrics). Flow-outs can include transfers to voicemail, callbacks, and any system-driven events such as in-queue flows that transfer to another queue or external party after a certain amount of time. Flow-outs can also occur if the caller opts to exit out of the queue and return to the IVR. Offered interactions are either flow-out, answered, or abandoned interactions. |
Yes |
| ASA | The average amount of time an interaction waits in the queue before an agent answers. This metric does not include interactions that agents do not answer. Average Speed of Answer (ASA) is directly associated with the service level and provides insight into the customer service your organization provides. ASA is recorded in the interval in which the agent answered the interaction. Calculated by: Total Answered (tAnswered Sum) / Answered Count (tAnswered Count) Note: Raw values are provided in milliseconds. |
Yes |
| Service Level % | Service level target is a contact center performance statistic expressed as “X percent of conversations answered in Y seconds.” For example, a goal of answering 80% of voice calls within 20 seconds provides a service level target of 80/20. You can set the service level target for each media type in a queue. Analytics uses this service level target to calculate whether you are within the service level % defined by your service level agreement (SLA). For more information about setting the service level target, see Create queues or Edit or delete queues. Note: In the performance views that are not queue-specific, the Service Level % is calculated by queue and displayed as a – on the aggregated group row since SLA targets vary by queue. The affected views are DNIS Performance Summary and Skills Performance views. To view individual queue service level %, click the + to expand the row.
The service level % is the percentage of interactions that meet your contact center's service level target. The formula to calculate the service level % is:
Number of Conversations Answered within SLA The numerator is calculated by taking the total answered conversations and subtracting the conversations that were not answered within the SLA threshold. Calculated by: (Answered Count – SLA Violation Count) Total Number of Conversations The Service Level Options configuration determines the denominator. With all the options below unchecked, the denominator is the count of answered conversations.
As the service level calculation depends on an organization’s configured options, the final formula to calculate the service level is:
Notes:
|
Yes |
| Handle | The total number of ACD and non-ACD interactions that agents were involved in for the selected media type. Handle increments in the interval in which the interaction ends, after the agent completes any after call work and completes the interaction. |
Yes |
| Total Handle | The total amount of time agents spend on an interaction including time spent contacting, time spent dialing, talk time, hold time, and after call work. |
Yes |
| Total Talk | The total amount of time spent interacting on all the conversations by the agent, within an interval. For example, in an interaction, where an agent accepts an interaction, talks to the customer for two minutes, places the customer on hold for one minute, and then talks to the customer again for two minutes, the Total Talk equals 4 minutes. |
Yes |
| Total Hold | The cumulative hold time for all interactions. |
Yes |
| Total ACW | The cumulative time spent in after-call work (ACW) on all interactions. After-call work is the work that an agent performs immediately following an interaction. Work may involve keying activity codes, updating customer databases, filling out forms, or initiating outbound contact. As a metric, it indicates the total time an agent takes to finish working on a call. If an agent must complete work before the agent can handle the next contact, then ACW is factored into the average handle time. |
Yes |
| Total Dialing | The total amount of time an outbound interaction spends dialing a contact. |
Yes |
| Total Contacting | The total amount of time outbound interactions take to connect to the agent’s phone. Usually, this duration is short. However, if the agent uses a remote phone the duration may be longer. |
Yes |
| Avg Handle |
The average amount of time agents spent handling interactions. This calculation includes talk time, hold time, and after-call work. For outbound calls it also includes dialing and contacting time. Calculated by: (cumulative talk time + cumulative hold time + cumulative after-call work + cumulative dialing time + cumulative contacting time) / Number of interactions handled Note: The interactions can span multiple time intervals. For example, a 45-minute call spans two 30-minute intervals. However, metrics are assigned a single timestamp and reported in the interval into which this timestamp falls. The timestamps are assigned based on when the metric calculation is complete.
For instance, handle time will use the timestamp of after call work completion. In the example of a 45-minute call, the handle time falls in the second 30-minute interval because the handle time was calculated at the end of the call when ACW was submitted. In these views, the Avg Talk, Avg Hold, and Avg ACW columns do not equal the Avg Handle column because only some interactions include holds. This view calculates the average handle column using cumulative counts rather than averages. |
Yes |
| Avg Wait | The average amount of time an interaction is in a queue before an agent answers it, before the interaction moves out of the queue, or before the customer abandons the interaction. Calculated by: Total Wait Time / Interactions |
Yes |
| Avg Talk | The average number of seconds spent interacting on a media type. Calculated by: Total Talk time / Count of interactions with Talk time |
Yes |
| Avg Hold | The average number of seconds that interactions were placed on hold. Calculated by: Total Hold Time / Count of interactions with holds |
Yes |
| Avg ACW | The average amount of time agents spent completing after-call work. Calculated by: Total ACW / Interactions with ACW |
Yes |
| Avg Dialing | The average amount of time an agent spends dialing and waiting for a contact to answer during outbound interactions.
Calculated by: (total dialing time/ total number of dialing segments) |
Yes |
| Avg Contacting | The average amount of time an outbound interaction takes to connecting to the agent’s phone. Usually, this duration is short. However, if the agent uses a remote phone the duration may be longer. |
Yes |
| Hold | The number of interactions with holds. |
Yes |
| Transfer | A measurement of the number of interactions an agent answered in one queue and then transferred. A transfer counts for the queue in which an agent answers the interaction. This measurement is calculated by the number of interactions blind transferred or consult transferred. |
Yes |
| Blind Transfer | The number of interactions an agent answered in one queue and then blind transferred. A blind transfer counts for the queue in which an agent answers the interaction. |
Yes |
| Consult | The number of interactions an agent answered and then consulted with another participant with or without fully transferring the interaction. A consult counts for the queue in which an agent answers the interaction, even if they consult with another queue. |
Yes |
| Consult Transfer | The number of call interactions an agent answered in one queue and then consult transferred, meaning they connected with a person or queue before transferring the call. A consult transfer counts for the queue in which an agent answers the interaction. See Consult transfer a call. |
Yes |
| Total Wait | The total amount of time an interaction is in a queue before an agent answers it, it flows out, or the customer abandons it. Genesys Cloud calculates the wait time in milliseconds. |
Yes |
| Avg Abandon | The average amount of time before a customer disconnects in an ACD queue before connecting with an agent. For example, the customer hangs up before an agent answers, or the system disconnects the interaction. |
Yes |
| Connection | The number of interactions that initially connected to the contact center in a particular location, such as a queue or IVR. |
Yes |
| Division | Displays the name of a division that an agent or queue belongs to. For more information, see About access control. |
Yes |
| Inbound Media | The count of inbound media for an interaction. |
Yes |
| Transfer % | The number of transfers compared with the total number of interactions answered. Calculated by: (No. of transfers / interactions answered) * 100 |
Yes |
| Max Abandon | The maximum time of an abandoned interaction for the selected interval. |
Yes |
| Min Abandon | The minimum time of an abandoned interaction for the selected interval. |
Yes |
| Max Wait | The maximum amount of time spent waiting in queue for the selected interval. |
Yes |
| Min Wait | The minimum amount of time spent waiting in queue for the selected interval. |
Yes |
| Max Talk | The maximum amount of time spent interacting for the selected interval. |
Yes |
| Min Talk | The minimum amount of time spent interacting for the selected interval. |
Yes |
| Max Hold | The maximum amount of time spent on hold for the selected interval. |
Yes |
| Min Hold | The minimum amount of time spent on hold for the selected interval. |
Yes |
| Max ACW | The maximum amount of time spent on after call work for the selected interval. |
Yes |
| Min ACW | The minimum amount of time spent on after call work for the selected interval. |
Yes |
| Over SLA | Number of interactions that were over the defined Service Level. |
Yes |
| Met SLA | Number of interactions that met the defined service level. |
Yes |
| Short Abandon | Number of interactions that were short abandoned. |
Yes |
| Short Abandon % | Percent of interactions that were short abandoned. |
Yes |
| Abandon – No Short | Number of abandons excluding the short abandons. |
Yes |
| Abandon – No Short % | Percent of abandons excluding the short abandons. |
Yes |
| Outbound Attempt | Attempted outbound interactions for Dialer campaigns. |
Yes |
| Voicemail | Count of voicemails received. |
Yes |
| Error | The number of errors that occurred on the queue conversations. |
Yes |
| SL % | The service level percentage for the queue. |
Yes |
| SL Target % | The service level target percentage for the queue. |
Yes |
| Contacting | The number of contacting segments for the queue and interval. |
Yes |
| Dialing | The number of dialing segments for the queue and interval. |
Yes |
| Avg Hold Handled | The average time any interaction spent on hold. This calculation takes into account all interactions handled, not just those that were held. Calculated by: Total Hold Time / Number of Interactions Handled. |
Yes |
| Avg ACW Handled | The average time any interaction spent in ACW. This calculation takes into account all interactions handled, not just those that had ACW. Calculated by: Total ACW Time / Number of Interactions Handled |
Yes |
| Sentiment Instances | Number of instances of sentiment in the given interval with the provided filters. |
Yes |
| Avg Sentiment | Average customer sentiment score (-100 to 100) in the specified interval with the provided filters. |
Yes |
| Outbound Media | The number of outbound media for an interaction. |
Yes |
|
ACW |
The number of times after-call work (ACW) was completed. After-call work is the work that an agent performs immediately following an interaction. Work may involve keying activity codes, updating customer databases, filling out forms, or initiating outbound contact. As a metric, it indicates the total time an agent takes to finish working on a call. If an agent must complete work before the agent can handle the next contact, then ACW is factored into the average handle time. Note: By default, the summary of metrics displayed includes all activity for the agent. To filter down to the activities specific to a queue, you can apply a filter. |
Yes |
|
Talk |
The number of sessions where the user(s) interacted during conversations. A session includes the point where the agent joins the conversation to the point where they disconnect. |
Yes |
|
Wait |
The number of interactions that waited in the queue. |
Yes |
|
Avg Flow-Out |
The average amount of time an interaction spends in queue before it flows out. Calculated by: Total Flow Out Time / Count of interactions with flow-outs For more information, see Queues Performance Summary view. |
Yes |
|
Max Flow-Out |
The maximum amount of time an interaction spends in queue before it flows out. For more information, see Queues Performance Summary view. |
Yes |
|
Total Active Callback |
The time an agent spent on a callback while a call is active. |
Yes |
|
Min Active Callback |
The minimum time an agent spent on a callback while a call is active. |
Yes |
|
Max Active Callback |
The maximum time an agent spent on a callback while a call is active. |
Yes |
|
Avg Active Callback |
The average time an agent spent on a callback while a call is active. |
Yes |
|
Active Callback |
The instances of an agent on a callback while a call is active. |
Yes |
|
Min Flow-Out |
The minimum amount of time an interaction spends in queue before it flows out. For more information, see Queues Performance Summary view. |
Yes |
Routing
For an overview of routing methods, see Routing and evaluation methods.
| Column | Description | Columns live update |
|---|---|---|
| Bullseye Requested | The number of interactions in which bullseye routing was requested. |
No |
| Bullseye Requested % | The rate of answered interactions in which bullseye routing was requested in comparison to all answered interactions. |
No |
| Bullseye Used | The number of answered interactions in which bullseye routing was used. |
No |
| Bullseye Used % | The rate of interactions in which bullseye routing was used in comparison to all answered interactions. |
No |
|
Conditional Requested |
The number of interactions in which conditional routing was requested. | No |
|
Conditional Requested % |
The rate of answered interactions in which conditional routing routing was requested in comparison to all answered interactions. | No |
|
Conditional Used |
The number of interactions in which conditional routing was used. | No |
|
Conditional Used % |
The rate of interactions in which conditional routing was used in comparison to all answered interactions. | No |
| Direct Requested | The number of interactions in which direct routing was requested. | No |
|
Direct Requested % |
The rate of answered interactions in which direct routing was requested in comparison to all answered interactions. | No |
|
Direct Used |
The number of answered interactions in which direct routing was used. | No |
|
Direct Used % |
The rate of interactions in which direct routing was used in comparison to all answered interactions. | No |
| Last Requested | The number of answered interactions in which last routing was used. See Last agent handling. |
No |
| Last Requested % | The rate of interactions in which last routing was requested in comparison to all answered interactions. See Last agent handling. |
No |
| Last Used | The number of answered interactions in which last routing was used. See Last agent handling. |
No |
| Last Used % | The rate of interactions in which last routing was used in comparison to all answered interactions. See Last agent handling. |
No |
| Manual Used | The number of answered interactions in which manual routing was used. |
No |
| Manual Used % | The rate of interactions in which manual routing was used in comparison to all answered interactions. |
No |
| Predictive Requested | The number of answered interactions in which predictive routing was requested. |
No |
| Predictive Requested % | The rate of interactions in which predictive routing was requested in comparison with all answered interactions. |
No |
| Predictive Used | The number of answered interactions in which predictive routing was used. |
No |
| Predictive Used % | The rate of interactions in which predictive routing was used in comparison with all answered interactions. |
No |
| Preferred Requested | The number of answered interactions in which preferred agent routing was used. |
No |
| Preferred Requested % | The rate of interactions in which preferred agent routing was requested in comparison with all answered interactions. |
No |
| Preferred Used | The number of answered interactions in which preferred agent routing was used. |
No |
| Preferred Used % | The rate of interactions in which preferred agent routing was used in comparison to all answered interactions. |
No |
| Standard Requested | The number of answered interactions in which standard routing was requested. |
No |
| Standard Requested % | The rate of interactions in which standard routing was requested in comparison to all answered interactions. |
No |
| Standard Used | The number of answered interactions in which standard routing was used. |
No |
| Standard Used % | The rate of interactions in which standard routing was used in comparison to all answered interactions. |
No |
Surveys
| Column | Column Description | Columns live update |
|---|---|---|
| Response Rate | The number of surveys that customers complete compared with the total number of surveys sent. Surveys sent includes successfully delivered survey invitations and survey invitations that Genesys Cloud attempted to send but could not deliver due to an error, such as an invalid email address or invalid survey form. Calculated by: (Surveys Completed / Surveys Sent) * 100 |
No |
| Sent | The number of surveys sent. This metric includes successfully delivered survey invitations and survey invitations that Genesys Cloud attempted to send but could not deliver due to an error, such as an invalid email address or invalid survey form. |
No |
| In Progress | The number of surveys that customers opened but did not submit. This metric does not include surveys that customers opened but did not submit before the survey expired. |
No |
| Complete | The number of surveys customers have opened and submitted. |
No |
| Surveys Abandon | The number of surveys that customers opened but did not submit before the survey expired. |
No |
| Survey Expire | The number of surveys that expired before the customer opened it. |
No |
| Survey Errors | The number of surveys that Genesys Cloud attempted but failed due to an error. The error includes errors in delivery such as an invalid email address, errors that occurred during the Survey Invite Flow, or other errors in the survey creation. |
No |
| Avg Survey Score | The average of completed surveys' percentage scores. The average score does not include NPS. Calculated by (Sum of completed survey percentage scores / number of completed surveys) * 100 |
No |
| Complaint |
The number of errors related to email recipient, system blocking, or identifying the survey sender as spam. |
No |
| Outstanding |
The number of outstanding surveys. Calculated by (Number of surveys sent) – completed – expired – abandoned – bounced – complaints |
No |
| Full response | The number of full survey responses with all required questions that were answered by the customers. |
No |
| Partial Response | The number of partial survey responses with any required questions that were unanswered by the customers. |
No |
| Voice Survey | The number of voice surveys. |
No |
| Web Survey | The number of web surveys. |
No |
| NPS | The Net Promoter ScoreSM (NPS) of completed surveys. The score can range from -100 to 100. Calculated by (Promoters - Detractors) / number of responses) * 100 For more information about Promoters, Detractors, and NPS, see Net Promoter Score web survey question overview. |
No |
Speech and text analytics
| Column | Column Description | Columns live update |
|---|---|---|
| Avg Sentiment | Average customer sentiment score (-100 to 100) in the specified interval with the provided filters. |
No |
| Negative Sentiment Instances | The number of negative sentiment instances. For more information, see Understand sentiment analysis. |
No |
| Overall Avg Sentiment Score | The average overall sentiment score of the interactions. Calculated by: oSentimentScore.sum / oSentimentScore.count |
No |
| Positive Sentiment Instances | The number of positive sentiment instances. For more information, see Understand sentiment analysis. |
No |
| Sentiment Instances | Number of instances of sentiment in the given interval with the provided filters. |
No |
Agents Status Detail view
| Column | Description | Columns live update |
|---|---|---|
| Column | Description | Columns live update |
| Logged in | The total amount of time a user is logged in for the specified period. |
Yes |
| On Queue | The amount of time that an agent spent on a queue. | Yes |
| Idle | The amount of time an agent spends in the Idle routing status. This routing status represents agents who are On Queue and able to take interactions but are not currently working with interactions. |
Yes |
| Not Responding | The amount of time an agent spends in the Not Responding routing status after not accepting an interaction. The Not Responding routing status is when an agent was On Queue or Interacting and did not answer an offered interaction. The agent could still be handling and completing other previous interactions. While Not Responding, the agent does not receive new interactions. |
Yes |
| Off Queue | The amount of time that an agent spent off queue. | Yes |
| Available | The time spent in the Available status for the specified period. |
Yes |
| Busy | The time spent in the Busy status for the specified period. |
Yes |
| Away |
The time spent during the specified period in the Away status when the user sets their status to Away. Note: If Genesys Cloud automatically sets the user’s status to Away due to inactivity, then this view displays that time in the System Away column. |
Yes |
| Meeting | The time spent in the Meeting status for the specified period. |
Yes |
| Break | The time spent in the Break status for the specified period. |
Yes |
| Meal | The time spent in the Meal status for the specified period. |
Yes |
| Training | The time spent in the Training status for the specified period. |
Yes |
| Communicating | The agent is on a non-ACD call, and, in relation to agent utilization and call routing, Genesys Cloud treats the non-ACD call like an ACD call. For example, administrators could configure agent utilization so Genesys Cloud does not route new interactions to agents while they are on an ACD or non-ACD call. This status only appears if administrators have selected “Count non-ACD calls in utilization capacity” within the agent utilization configuration. |
Yes |
| System Away | The time spent during the specified period in the Away status when Genesys Cloud automatically sets the user's status to Away due to inactivity. Note: If users manually set their status to Away, then this view displays that time in the Away column. |
Yes |
| Interacting | The time that the agent was handling interactions. |
Yes |
| Log in | The time the user first logged in within the supplied interval. Data for this column is limited to a one-month time range for data that is up to 558 days old. If the column is blank, a log in event did not occur within the view’s requested interval. |
No |
| Log out | The last time the user logged out within the supplied interval. Data for this column is limited to a one-month time range for data that is up to 558 days old. If the column is blank, a log out event did not occur within the view’s requested interval. |
No |
| Total ACD | The amount of time that an agent spent in the Interacting, Idle, and Not Responding statuses. For example, an agent spent 5:01:00 interacting, 1:47:30 idle, and 0:21:30 not responding. The total ACD time is 7:10:00. |
Yes |
| Off Queue % | The percentage of time that an agent spent off queue. For example, in the Available, Away, and Busy statuses. |
Yes |
| On Queue % | The percentage of time that an agent spent on queue. For example, in the Interacting, Idle, and Not Responding statuses. |
Yes |
| Interacting % | The percentage of on-queue time that an agent spent in the Interacting status, calculated by: Interacting / (INTERACTING + IDLE + NOT RESPONDING) * 100 |
Yes |
| Idle % | The percentage that an agent spent in the idle status, calculated by: Idle / (INTERACTING + IDLE + NOT RESPONDING) * 100 This routing status represents agents who are On Queue and able to take interactions but are not working with interactions. |
Yes |
| Not Responding % | The percentage of time that an agent spent in the Not Responding status, calculated by: Not Responding / (INTERACTING + IDLE + NOT RESPONDING) * 100 |
Yes |
| Occupancy | The percentage of time that an agent spent handling ACD conversations against the total time on queue calculated by: (total time in "Interacting" routing status / (total time in “idle”, “interacting”, and “communicating” routing statuses in interval)) * 100; range: 0-100% |
Yes |
Agents Status Summary view
Real-time columns
- Time in Status
- Status
- Secondary Status
- Routing Status
- Time in Routing Status
- Station
- Media Types
- Interactions
- Duration / Duration 2 / Duration 3
- Adherence
- Adherence Duration
- Scheduled Activity
These columns always show current, real-time data, even if you use the date filter to show historical data.
| Column | Description | Columns live update |
|---|---|---|
| Column | Description | Columns live update |
| Adherence | The current adherence status of the user, including In Adherence, Out of Adherence, Unscheduled, Ignored, or Unknown. |
Yes |
| Adherence Duration | The amount of time represented in days, hours, minutes, and seconds, of the adherence exception. |
Yes |
| Agent | The full name for the user. |
No |
| Available | The time spent in the Available status for the specified period. |
Yes |
| Away |
The time spent during the specified period in the Away status when the user sets their status to Away. Note: If Genesys Cloud automatically sets the user’s status to Away due to inactivity, then this view displays that time in the System Away column. |
Yes |
| Break | The time spent in the Break status for the specified period. |
Yes |
| Busy | The time spent in the Busy status for the specified period. |
Yes |
| Communicating | The agent is on a non-ACD call, and, in relation to agent utilization and call routing, Genesys Cloud treats the non-ACD call like an ACD call. For example, administrators could configure agent utilization so Genesys Cloud does not route new interactions to agents while they are on an ACD or non-ACD call. This status only appears if administrators have selected “Count non-ACD calls in utilization capacity” within the agent utilization configuration. |
Yes |
| Department | Department of the user as defined within Genesys Cloud. |
No |
| Division | Displays the name of a division that an agent or queue belongs to. For more information, see About access control. |
No |
|
Duration Duration 2 Duration 3 |
The amount of time an agent has been working on an interaction. If an agent is working multiple interactions, then Genesys Cloud displays each interaction's duration in a separate column labeled Duration 2 or Duration 3. |
Yes |
Email address configured for the user. |
No | |
| ID | Unique system ID for the user. |
No |
| Idle | The amount of time an agent spends in the Idle routing status. This routing status represents agents who are On Queue and able to take interactions but are not currently working with interactions. |
Yes |
| Idle % | The percentage that an agent spent in the idle status, calculated by: Idle / (INTERACTING + IDLE + NOT RESPONDING) * 100 This routing status represents agents who are On Queue and able to take interactions but are not working with interactions. |
Yes |
| Interacting | The time that the agent was handling interactions. |
Yes |
| Interacting % | The percentage of on-queue time that an agent spent in the Interacting status, calculated by: Interacting / (INTERACTING + IDLE + NOT RESPONDING) * 100 |
Yes |
| Interactions | The number of interactions assigned to the queue that agents are currently interacting with. |
Yes |
| Log in | The time the user first logged in within the supplied interval. Data for this column is limited to a one-month time range for data that is up to 558 days old. If the column is blank, a log in event did not occur within the view’s requested interval. |
Yes |
| Log out | The last time the user logged out within the supplied interval. Data for this column is limited to a one-month time range for data that is up to 558 days old. If the column is blank, a log out event did not occur within the view’s requested interval. |
Yes |
| Logged in | The total amount of time a user is logged in for the specified period. |
Yes |
| Meal | The time spent in the Meal status for the specified period. |
Yes |
| Media Types | The media types an agent is permitted to handle, such as voice, callback, chat, email, and message. |
No |
| Meeting | The time spent in the Meeting status for the specified period. |
Yes |
| Not Responding | The amount of time an agent spends in the Not Responding routing status after not accepting an interaction. The Not Responding routing status is when an agent was On Queue or Interacting and did not answer an offered interaction. The agent could still be handling and completing other previous interactions. While Not Responding, the agent does not receive new interactions. |
No |
| Not Responding % | The percentage of time that an agent spent in the Not Responding status, calculated by: Not Responding / (INTERACTING + IDLE + NOT RESPONDING) * 100 |
No |
| Occupancy | The percentage of time that an agent spent handling ACD conversations against the total time on queue calculated by: (total time in "Interacting" routing status / (total time in “idle”, “interacting”, and “communicating” routing statuses in interval)) * 100; range: 0-100% |
No |
| Off Queue | The time spent in any status other than Offline and On Queue for the specified period. |
No |
| Off Queue % | The percentage of time that an agent spent off queue. For example, in the Available, Away, and Busy statuses. |
No |
| On Queue | The time spent in the On Queue status for the specified period. |
No |
| On Queue % | The percentage of time that an agent spent on queue. For example, in the Interacting, Idle, and Not Responding statuses. |
No |
| Presence | Displays a colored dot related to the agent’s current status. For more information, see Presence, status, and activity indicators overview and Agent presence, status, and activity indicators. |
Yes |
| Primary Phone | Phone number for the user as defined in Genesys Cloud. |
No |
| Routing Status |
The current routing status of an agent. |
Yes |
| Scheduled Activity | The activity for which the user is currently scheduled, including On Queue Work, Break, Meal, Meeting, Off Queue Work, Time Off, Training, Unavailable, or Unscheduled. |
Yes |
| Secondary Status |
The current secondary status of an agent. If there is no secondary status, then this column displays the agent’s primary status. |
Yes |
| Skills |
The routing skills and languages assigned to an agent. |
No |
| Station | Icon that shows if an agent is associated with a station. Hover over the icon to display the Station Name. | No |
| Status |
The current primary status of an agent, such as Available, Away, or Busy. |
Yes |
| System Away | The time spent during the specified period in the Away status when Genesys Cloud automatically sets the user's status to Away due to inactivity. Note: If users manually set their status to Away, then this view displays that time in the Away column. |
Yes |
| Time in Routing Status |
The amount of time agents have been in their current routing status. |
Yes |
| Time in Status |
The amount of time agents have been in their current primary status. |
Yes |
| Title | Title of the user as defined within Genesys Cloud. |
No |
| Total ACD | The amount of time that an agent spent in the Interacting, Idle, and Not Responding statuses. For example, an agent spent 5:01:00 interacting, 1:47:30 idle, and 0:21:30 not responding. The total ACD time is 7:10:00. |
No |
| Training | The time spent in the Training status for the specified period. |
No |
Agents Wrap-Up Detail view
| Column | Description |
|---|---|
| Handle | The total number of ACD and non-ACD interactions that agents were involved in for the selected media type. Handle increments in the interval in which the interaction ends, after the agent completes any after call work and completes the interaction. |
| Avg Handle |
The average amount of time agents spent handling interactions. This calculation includes talk time, hold time, and after-call work. For outbound calls it also includes dialing and contacting time. Calculated by: (cumulative talk time + cumulative hold time + cumulative after-call work + cumulative dialing time + cumulative contacting time) / Number of interactions handled Note: The interactions can span multiple time intervals. For example, a 45-minute call spans two 30-minute intervals. However, metrics are assigned a single timestamp and reported in the interval into which this timestamp falls. The timestamps are assigned based on when the metric calculation is complete.
For instance, handle time will use the timestamp of after call work completion. In the example of a 45-minute call, the handle time falls in the second 30-minute interval because the handle time was calculated at the end of the call when ACW was submitted. In these views, the Avg Talk, Avg Hold, and Avg ACW columns do not equal the Avg Handle column because only some interactions include holds. This view calculates the average handle column using cumulative counts rather than averages. |
| Avg Talk | The average number of seconds spent interacting on a media type. Calculated by: Total Talk time / Count of interactions with Talk time |
| Avg Hold | The average number of seconds that interactions were placed on hold. Calculated by: Total Hold Time / Count of interactions with holds |
| Avg ACW | The average amount of time agents spent completing after-call work. Calculated by: Total ACW / Interactions with ACW |
| Total Handle | The total amount of time agents spend on an interaction including time spent contacting, time spent dialing, talk time, hold time, and after call work. |
| Total Talk | The total amount of time spent interacting on all the conversations by the agent, within an interval. For example, in an interaction, where an agent accepts an interaction, talks to the customer for two minutes, places the customer on hold for one minute, and then talks to the customer again for two minutes, the Total Talk equals 4 minutes. |
| Total Hold | The cumulative hold time for all interactions. |
| Total ACW | The cumulative time spent in after-call work (ACW) on all interactions. After-call work is the work that an agent performs immediately following an interaction. Work may involve keying activity codes, updating customer databases, filling out forms, or initiating outbound contact. As a metric, it indicates the total time an agent takes to finish working on a call. If an agent must complete work before the agent can handle the next contact, then ACW is factored into the average handle time. |
| Hold | The number of interactions with holds. |
| % Handle | The percentage of interactions assigned the wrap-up code in relation to the total interactions for the selected dates and media type, for the selected agent. Calculated by (Handle for wrap-up code / total interactions for the selected date and media type for the selected agent) |
| % Total Handle | The percentage of the total length of the interactions assigned the wrap-up code in relation to the total length of interactions for the selected dates and media type, for the selected agent. Calculated by (Total Handle for the wrap-up code / total length of interactions for the selected dates and media type, for the selected agent) |
| % Total Talk Time | The talk time for a wrap-up code in relation to the total talk time for the selected dates. Calculated by (Total Talk Time for a wrap-up code / Total Talk Time) |
|
ACW |
The number of times after-call work (ACW) was completed. After-call work is the work that an agent performs immediately following an interaction. Work may involve keying activity codes, updating customer databases, filling out forms, or initiating outbound contact. As a metric, it indicates the total time an agent takes to finish working on a call. If an agent must complete work before the agent can handle the next contact, then ACW is factored into the average handle time. Note: By default, the summary of metrics displayed includes all activity for the agent. To filter down to the activities specific to a queue, you can apply a filter. |
|
Max ACW |
The maximum amount of time spent on after call work for the selected interval. |
|
Min ACW |
The minimum amount of time spent on after call work for the selected interval. |
|
Max Handle |
The maximum amount of time agents were involved in ACD and non-ACD interactions, including answered interactions, transfers, callbacks, and outbound calls. |
|
Min Handle |
The minimum amount of time agents were involved in ACD and non-ACD interactions, including answered interactions, transfers, callbacks, and outbound calls. |
|
Talk |
The number of sessions where the user(s) interacted during conversations. A session includes the point where the agent joins the conversation to the point where they disconnect. |
|
Max Talk |
The maximum amount of time spent interacting for the selected interval. |
|
Min Talk |
The minimum amount of time spent interacting for the selected interval. |
|
Max Hold |
The maximum amount of time spent on hold for the selected interval. |
|
Min Hold |
The minimum amount of time spent on hold for the selected interval. |
Agents Wrap-Up Interval Detail view
| Column | Description |
|---|---|
| Handle | The total number of ACD and non-ACD interactions that agents were involved in for the selected media type. Handle increments in the interval in which the interaction ends, after the agent completes any after call work and completes the interaction. |
| % Handle | The percentage of interactions of an agent's wrap-up code for a selected date and media type, in relation to the total interactions for the selected date and media type, by interval. Calculated by (Handle for agent wrap-up code by interval / total agent interactions for the selected date and media type, by interval) |
| Avg Handle |
The average amount of time agents spent handling interactions. This calculation includes talk time, hold time, and after-call work. For outbound calls it also includes dialing and contacting time. Calculated by: (cumulative talk time + cumulative hold time + cumulative after-call work + cumulative dialing time + cumulative contacting time) / Number of interactions handled Note: The interactions can span multiple time intervals. For example, a 45-minute call spans two 30-minute intervals. However, metrics are assigned a single timestamp and reported in the interval into which this timestamp falls. The timestamps are assigned based on when the metric calculation is complete.
For instance, handle time will use the timestamp of after call work completion. In the example of a 45-minute call, the handle time falls in the second 30-minute interval because the handle time was calculated at the end of the call when ACW was submitted. In these views, the Avg Talk, Avg Hold, and Avg ACW columns do not equal the Avg Handle column because only some interactions include holds. This view calculates the average handle column using cumulative counts rather than averages. |
| Avg Talk | The average number of seconds spent interacting on a media type. Calculated by: Total Talk time / Count of interactions with Talk time |
| Avg Hold | The average number of seconds that interactions were placed on hold. Calculated by: Total Hold Time / Count of interactions with holds |
| Avg ACW | The average amount of time agents spent completing after-call work. Calculated by: Total ACW / Interactions with ACW |
| Total Handle | The total amount of time agents spend on an interaction including time spent contacting, time spent dialing, talk time, hold time, and after call work. |
| % Total Handle | The percentage of the total length of the interactions of an agent's wrap-up code for a selected date and media type, in relation to the total length of interactions for the selected dates and media type, by interval. Calculated by (Total Handle for agent wrap-up code / total length of agent interactions for the selected dates and media type, by interval) |
| Total Talk | The total amount of time spent interacting on all the conversations by the agent, within an interval. For example, in an interaction, where an agent accepts an interaction, talks to the customer for two minutes, places the customer on hold for one minute, and then talks to the customer again for two minutes, the Total Talk equals 4 minutes. |
| Total Hold | The cumulative hold time for all interactions. |
| Total ACW | The cumulative time spent in after-call work (ACW) on all interactions. After-call work is the work that an agent performs immediately following an interaction. Work may involve keying activity codes, updating customer databases, filling out forms, or initiating outbound contact. As a metric, it indicates the total time an agent takes to finish working on a call. If an agent must complete work before the agent can handle the next contact, then ACW is factored into the average handle time. |
| Hold | The number of interactions with holds. |
| % Total Talk Time | The talk time for a wrap-up code in relation to the total talk time for the selected dates. Calculated by (Total Talk Time for a wrap-up code / Total Talk Time) |
|
ACW |
The number of times after-call work (ACW) was completed. After-call work is the work that an agent performs immediately following an interaction. Work may involve keying activity codes, updating customer databases, filling out forms, or initiating outbound contact. As a metric, it indicates the total time an agent takes to finish working on a call. If an agent must complete work before the agent can handle the next contact, then ACW is factored into the average handle time. Note: By default, the summary of metrics displayed includes all activity for the agent. To filter down to the activities specific to a queue, you can apply a filter. |
|
Max ACW |
The maximum amount of time spent on after call work for the selected interval. |
|
Min ACW |
The minimum amount of time spent on after call work for the selected interval. |
|
Max Handle |
The maximum amount of time agents were involved in ACD and non-ACD interactions, including answered interactions, transfers, callbacks, and outbound calls. |
|
Min Handle |
The minimum amount of time agents were involved in ACD and non-ACD interactions, including answered interactions, transfers, callbacks, and outbound calls. |
|
Talk |
The number of sessions where the user(s) interacted during conversations. A session includes the point where the agent joins the conversation to the point where they disconnect. |
|
Max Talk |
The maximum amount of time spent interacting for the selected interval. |
|
Min Talk |
The minimum amount of time spent interacting for the selected interval. |
|
Max Hold |
The maximum amount of time spent on hold for the selected interval. |
|
Min Hold |
The minimum amount of time spent on hold for the selected interval. |
Bot Performance Detail view
Bots
| Column | Description |
|---|---|
| Interval | The date interval for the bot. |
| Avg Bot | The average amount of time spent in bot sessions. |
| Max Bot | The amount of time of the longest bot. |
| Total Bot | The total number of bot sessions. |
| Entries | The number of customers entering bot sessions. |
| Avg Bot Turns | The average amount of turns in a bot session -- the number of times the bot processed user activity. |
| Max Bot Turns | The highest number of turns -- the times when the bot processed activity by the user in a bot session. |
| Total Bot Turns | The total number of bot turns -- the number of times the bot processed user activity. |
Disconnects
| Column | Description |
|---|---|
| Avg Disconnect | The average amount of time spent in bot sessions that ended with a disconnect. |
| Max Disconnect | The amount of time of the longest bot session that ended in a disconnect. |
| Total Disconnect | The amount of time an entry spent in a flow until it disconnected. |
| Disconnect | The number of bot sessions that ended in a disconnect. This is the total of Customer Disconnect, Bot Disconnect, System Error Disconnect, Session Expired Disconnect, and Recognition Failure Disconnect. |
| Customer Disconnect | The number of bot sessions that ended in a disconnect that was requested by the user. For example, the customer hung up or clicked the End chat button. |
| Bot Disconnect | The number of bot sessions that ended in a disconnect that was requested by the bot. For example, anywhere that a Disconnect action appears in your bot flow. |
| System Error Disconnect | The number of bot sessions where the bot made an unplanned disconnect due to an error. |
| Session Expired Disconnect | The number of bot sessions where the host made an unplanned disconnect due to the session expiring. |
| Recognition Failure Disconnect | The number of bot sessions where the session ended in a disconnect because the bot failed to recognize the intent. |
Exits
| Column | Description |
|---|---|
| Avg Exit | The average amount of time spent in bot sessions that ended with an exit. |
| Max Exit | The amount of time of the longest bot session that ended in an exit. |
| Total Exit | The total number of bot sessions that ended with the bot exiting to the call flow. |
| Exit | The number of bot sessions that ended in an exit. This is the total of User Exit, Bot Exit, System Error Exit, and Recognition Failure Exit. |
| User Exit | The total number of bot sessions where the user requested to speak to an agent. |
| Bot Exit | The number of bot sessions that ended in a exit that was requested by the bot. |
| System Error Exit | The number of bot sessions where the bot made an unplanned exit to the calling flow due to an error. |
| Recognition Failure Exit | The number of bot sessions where the session ended in an exit because the bot failed to recognize the intent. |
Recognition Failure Reasons
| Column | Description |
|---|---|
| No Input Collection | The number of times where the bot session ended during the collection phase because no input was collected from the user. |
| No Input Confirmation | The number of times where the bot session ended during the confirmation phase because no input was collected from the user. |
| No Match Collection | The number of times where the bot session ended during the main collection phase because the bot didn't understand the user's input. |
| No Match Confirmation | The number of times where the bot session ended during the confirmation phase because the bot didn't understand the user's input. |
| Max Wrong Match | The number of times where the bot session ended because the bot confirmed the user's input but the user said "no" to the confirmation question. |
Bot Performance Summary view
Bots
| Column | Description |
|---|---|
| Name | The bot name. |
| Avg Bot | The average amount of time spent in bot sessions. |
| Max Bot | The amount of time of the longest bot. |
| Total Bot | The total number of bot sessions. |
| Entries | The number of customers entering bot sessions. |
| Avg Bot Turns | The average amount of turns in a bot session -- the number of times the bot processed user activity. |
| Max Bot Turns | The highest number of turns -- the times when the bot processed activity by the user in a bot session. |
| Total Bot Turns | The total number of bot turns -- the number of times the bot processed user activity. |
Disconnects
| Column | Description |
|---|---|
| Avg Disconnect | The average amount of time spent in bot sessions that ended with a disconnect. |
| Max Disconnect | The amount of time of the longest bot session that ended in a disconnect. |
| Total Disconnect | The amount of time an entry spent in a flow until it disconnected. |
| Disconnect | The number of bot sessions that ended in a disconnect. This is the total of Customer Disconnect, Bot Disconnect, System Error Disconnect, Session Expired Disconnect, and Recognition Failure Disconnect. |
| Customer Disconnect | The number of bot sessions that ended in a disconnect that was requested by the user. For example, the customer hung up or clicked the End chat button. |
| Bot Disconnect | The number of bot sessions that ended in a disconnect that was requested by the bot. For example, anywhere that a Disconnect action appears in your bot flow. |
| System Error Disconnect | The number of bot sessions where the bot made an unplanned disconnect due to an error. |
| Session Expired Disconnect | The number of bot sessions where the host made an unplanned disconnect due to the session expiring. |
| Recognition Failure Disconnect | The number of bot sessions where the session ended in a disconnect because the bot failed to recognize the intent. |
Exits
| Column | Description |
|---|---|
| Avg Exit | The average amount of time spent in bot sessions that ended with an exit. |
| Max Exit | The amount of time of the longest bot session that ended in an exit. |
| Total Exit | The total number of bot sessions that ended with the bot exiting to the call flow. |
| Exit | The number of bot sessions that ended in an exit. This is the total of User Exit, Bot Exit, System Error Exit, and Recognition Failure Exit. |
| User Exit | The total number of bot sessions where the user requested to speak to an agent. |
| Bot Exit | The number of bot sessions that ended in a exit that was requested by the bot. |
| System Error Exit | The number of bot sessions where the bot made an unplanned exit to the calling flow due to an error. |
| Recognition Failure Exit | The number of bot sessions where the session ended in an exit because the bot failed to recognize the intent. |
Recognition Failure Reasons
| Column | Description |
|---|---|
| No Input Collection | The number of times where the bot session ended during the collection phase because no input was collected from the user. |
| No Input Confirmation | The number of times where the bot session ended during the confirmation phase because no input was collected from the user. |
| No Match Collection | The number of times where the bot session ended during the main collection phase because the bot didn't understand the user's input. |
| No Match Confirmation | The number of times where the bot session ended during the confirmation phase because the bot didn't understand the user's input. |
| Max Wrong Match | The number of times where the bot session ended because the bot confirmed the user's input but the user said "no" to the confirmation question. |
Campaign Interactions Detail view
- Name of the campaign
- Date of attempt
- Conversation ID
- Start time of the attempt
- Dialing
- Time to Agent
- Time to flow
- Time to abandon
- Disconnect time
- Conversation Duration
- DNIS
- Caller-ID
- Caller-ID Name
- Wrap-up code
- Wrap-up duration
- Contact ID
- Contact List
Interactions
| Column | Description |
|---|---|
| Column | Description |
| ANI | The number of the person who dialed. |
| Inbound Audio | The number of inbound audio or voice messages received from a customer. Notes: Since messaging is asynchronous, in rare instances, when an agent ends an interaction while an end customer finishes recording and sending a voice note, the last audio file attachment or voice note is not considered for analytics. The audio attachment of the conversation remains intact and is preserved as part of the conversation. There is no data loss. The agent still receives and views the voice note. You can see the impact only in the count of the inbound audio metric. The inbound audio metric can be undercounted. |
| Outbound Audio | The number of outbound audio or voice messages sent by an agent. |
| Abandoned | Whether a customer abandoned the interaction or not. |
| Media | The total number of inbound and outbound media for an interaction. |
| Screen Recorded | Yes indicates that the conversation was initially screen recorded. It does not consider whether the customer's policies retained it. No indicates that the conversation was not screen recorded. |
| Group Ring | Displays the group name for the voice interactions alerted via group ring. |
| Abandoned in Queue | The name of the queue in which the Abandon occurred. |
| Agent Assist | Whether an interaction had Agent Assist or not. |
| Authenticated | Yes for an authenticated web messaging interaction, No for a web messaging interaction that is not authenticated, or N/A if not a web messaging interaction. |
| Barged-in | Indicates whether a supervisor barged into the conversation. |
| Blind Transferred | Whether the interaction had a blind transfer. |
| Cleared by Customer | Indicates whether the conversation was cleared by the customer. |
| Co-browse | Whether the interaction had a co-browse session. |
| Coached | Indicates whether a supervisor coached on the conversation. |
| Consult Transferred | Whether the interaction had a consult transfer. |
| Consulted | Whether the interaction had a consult. |
| Conversation Duration |
The length of the interaction. Calculated by: (Conversation End – Conversation Start) |
| Conversation ID | The specific conversation ID for the interaction. |
| Conversation Initiator | Displays interactions initiated by a selected initiator (external, user, workflow, customer, or agent). |
| Customer Participation | Displays email and message interactions during which a customer participated, or a customer did not participate. |
| DNIS | The original number dialed for the interaction. |
| Date | The date the interaction started. |
| Delivery Status | The status of the attempted delivery of email and SMS messages. The Email delivery status is available for the agentless emails sent via the email campaigns or Agentless Email Notification API. The SMS delivery status is available for all outbound SMS messages including agentless and agent-sent SMS messages. Supported Delivery Status metrics include:
|
| Delivery Status Details | Additional details about the delivery, including engagement metrics. For more information, see SMS delivery receipts and Email delivery receipts. |
| Direction | Whether the interaction was inbound, outbound, or inbound/outbound. |
| Disconnect Type | The reason the interaction got disconnected.
|
| Division | Displays the divisions associated with the interaction. See About access control. |
| Email BCC |
The email addresses to which a copy of the email is sent to, but that name is not visible to other recipients of the message. This field cannot have more than 10 email addresses. The maximum number of recipients displayed in the BCC field is 10. |
| Email CC |
The email addresses to which a copy of the email is sent to. This field cannot have more than 10 email addresses. The maximum number of recipients displayed in the CC field is 10. |
| Emails Sent | Count of the number of emails sent by an agent, including Reply All and Forward. |
| End Date | The time and date the interaction ended. This column is blank if the interaction is still in progress. |
| Error Code | The name of the error code for the interaction. For more information, see Station errors and Error codes. |
| External Tag |
Displays the external tag that is attached to the conversation record. Note: This data is not available for web chat interactions.
|
| Fax | Displays Yes if a fax was present during the interaction. Displays No if a fax was not present during the interaction. |
| First Queue | First queueID in the conversation, formatted as name. |
| Flagged | Indicates calls flagged for voice quality issues. For more information about flagging calls, see Flag a problematic voice interaction or Flag a problematic phone call. |
| Flow-Out Type | Shows the type of flowout for a conversation that was a flowout from a queue. |
| From | The email address or SMS number from which the interaction is sent. |
| Has Media | Whether the interaction has media content. |
| Inbound Media | The count of inbound media for an interaction. |
| Initial Direction | Whether the interaction started as inbound or outbound. |
| Last Wrap-Up | The last wrap-up code used on the conversation. |
| MOS | The estimated average Mean Opinion Score (MOS) for the voice interaction among all the audio streams within the conversation. MOS is a measure of audio quality at specific measurement points of voice interaction. Potential measurement points include premises-based and cloud-based Edge devices. The measurement is based on codec type, average jitter, latency, and packet loss. Genesys Cloud displays the lowest MOS for each communication that occurs during the whole call. MOS ranges from 1 (bad) to 5 (excellent). Scores below 3.5 indicate unacceptable quality, and scores above 4.3 indicate high quality. |
| Media Type | The type of media used. |
| Message Type | The ACD message type used. |
| Monitored | Whether the interaction was monitored. |
| Non-ACD | Whether the interaction involved ACD. |
| Outbound Media | The number of outbound media for an interaction. |
| Provider | The source provider for the conversation. For example, Genesys Cloud EMAIL, Edge, and so on. |
| Queue | The associated queues. |
| Recording | Yes indicates that the conversation was initially recorded at the external trunk by the Edge. It does not consider whether the customer's policies actually retained it. No indicates that the conversation was not recorded at the external trunk by the Edge. N/A indicates a digital interaction. |
| Remote | Information about the external participants. |
| SIP Call ID | Displays the globally unique identifier embedded in all SIP requests and responses for the interaction. |
| Screen Share | Whether the interaction contains a screen share session. |
| Session DNIS | Any DNIS number dialed during the interaction, including the original DNIS number. |
| Subject | First instance of an email subject in the conversation. |
| To |
The email address or SMS number that the interaction is sent to. This field cannot have more than 10 email addresses. The maximum number of recipients displayed in the To field is 10. |
| Transferred | Indicates interactions that were transferred. A transfer counts for the queue in which an agent answers the interaction. |
| Users | The internal users alerted or involved. |
| Users – Alerted | The agents Genesys Cloud alerted for the interaction. |
| Users – Interacted | The users who actually interacted during the interaction. |
| Users – Not Responding | The agents who did not answer the interaction, and the agent may have transitioned to Not Responding. |
| Parked | Displays if the interaction has been parked. |
| Voicemail | Whether the interaction has voicemail. Includes personal and queue voicemail. |
| Wrap-up | The wrap-up code selected by the agent. |
| Wrap-up Notes | Whether an agent wrote a wrap-up note or not. If the agent wrote a note, a preview of the note displays when you hover over the column. |
| Social Classification | Displays the type of social listening data such as Public or Private. Lists one value for each interaction. The social listening data is classified as public or private based on the type of first conversation received. For example:
|
Routing
| Column | Description |
|---|---|
| Column | Description |
| Agent Bullseye Ring | Indicates the bullseye ring an agent is assigned to. |
| Bullseye Ring | Indicates the bullseye ring in which the interaction was answered. |
| Direct Routing | Indicates whether Direct Routing was requested and/or used. |
| Manual Agents Assigned | On-queue agents who were manually assigned this waiting interaction. |
| Manual Assigner | User with the appropriate permissions who manually assigned this interaction to a waiting agent in the queue. |
| Predictive Agent Selected | Lists the agents used during predictive routing. |
| Predictive Agents Proposed |
Lists the agents evaluated during predictive routing. Note: If your role does not include the Routing > Predictor > View permission, then the Predictive Agents Proposed column does not appear.
|
| Preferred Agents | Lists the preferred agents requested during interaction routing, even if the system was not able to route the interaction to the preferred agents. Includes the agent’s routing score. |
| Preferred Agents Requested | Whether an interaction had preferred agents requested due to preferred agents configuration, even if the system was not able to route the interaction to the preferred agents. |
| Preferred Rule | Indicates the rule in for the preferred agent. |
| Routing Requested | Displays the routing methods that were requested for the interaction. Gives insight into each of the routing methods the conversation went through prior to being answered, abandoned, or flow-out. The routing data is relevant beginning September 5, 2020. |
| Routing Rule | Indicates the routing rings associated with an interaction. |
| Routing Used | Displays the routing method that was used to get to the agent who answered the interaction. The routing data is relevant beginning September 5, 2020. |
| Skills | Displays the original skills that came from the flow. |
| Skills – Active | Displays the skills remaining on the interaction used for routing. |
| Skills — Removed | Displays skills removed from the interaction through bullseye routing. |
Metrics
| Column | Description |
|---|---|
| Column | Description |
| Alert Segments | The number of alerts. |
| Blind Transfers | The number of interactions an agent answered in one queue and then blind transferred. A blind transfer counts for the queue in which an agent answers the interaction. |
| Messages | The total number of individual messages exchanged during a conversation. This number includes both the inbound and outbound messages sent by both the customer and the agent. |
| Avg Agent Response | The average time the agent takes to turn the conversation back to the customer. Calculated by (total average agent response time / total number of agent chat sessions). |
| Avg Customer Response | The average time the customer takes to turn the conversation back to the agent. Calculated by (total average customer response time / total number of customer chat sessions). |
| Total First Response | The total amount of time the agents take to send their first message after connecting to a chat. Calculated by the total duration between the agent's session connecting and the agent's first message sent. |
| Message Turns | The total number of times the conversation turns from one participant to another, that is, a complete communication where one person sends one or more messages and the other responds. |
| Avg Time to First Response | The average time the agent takes to send a message once they connect to the conversation. |
| Total First Engagement | The time the customer takes to receive an engagement from an agent. It is determined from the time difference between the first customer message at the beginning of the chat and the first message that they received from an agent. Messages from the bots are not considered for calculation. |
| Avg Time to First Engagement | The average time it takes for a customer to receive an engagement from an agent. Calculated by (the total duration between the customer's first message and the first agent response / the number of first engagements). Messages from the bots are not considered for calculation. |
| Avg Message Turns | The average amount of the back and forth messages per conversation session. Calculated by (the total number of message turns / the total count of number of message turns). |
| Callback – Time to first connect | The amount of time between the start of the callback ACD and the start of the first interaction segment on the voice channel. Note: This metric tracks the time from ACD to agent connect. If a callback is directly transferred from one agent to another agent, the callback is not associated with that ACD queue, and the time to connect is not calculated. |
| Callback – Time to first dial | The amount of time between the start of the callback ACD and the start of the first dialing segment on the voice channel. Note: This metric tracks the time from ACD to agent dial. If a callback is directly transferred from one agent to another agent, the callback is not associated with that ACD queue, and the time to dial is not calculated. |
| Consult Transfers | The number of call interactions an agent answered in one queue and then consult transferred, meaning they connected with a person or queue before transferring the call. A consult transfer counts for the queue in which an agent answers the interaction. See Consult transfer a call. |
| Consults | The number of interactions an agent answered and then consulted with another participant with or without fully transferring the interaction. A consult counts for the queue in which an agent answers the interaction, even if they consult with another queue. |
| Contacting Segments | The number of times during an interaction where the system was connecting to the agent’s phone before dialing out. |
| Dialing Segments | The number of times during an interaction that the system dials out. |
| Error Count | The number of errors for the interaction. |
| Hold Segments | The number of times the agent places the customer on hold. |
| IVR Segments | The number of times the interaction enters an IVR. |
| Not Responding | The number of times an agent did not respond to the interaction. |
| Inbound Messages | The number of individual messages exchanged during a conversation where the session’s direction is inbound. It includes all messages sent by both the customer and the agent. |
| Outbound Messages | The number of individual messages exchanged during a conversation where the session’s direction is outbound. It includes all messages sent by both the customer and the agent. |
| Inbound SMS/MMS Segments | The number of message segments based on their segment count. |
| Outbound SMS/MMS Segments | The number of message segments based on their segment count. |
| Agentless Emails | The number of emails sent by a campaign excluding the emails sent by an agent. |
| Queue Segments | The number of times an interaction enters a queue. For example, if an agent accepts an interaction in queue A, transfers it to queue B, and then an agent transfers the interaction back to queue A, then Queue Segments equal 3. |
| Talk Segments | The number of times an agent and customer talk. For example, in an interaction where an agent accepts an interaction, talks to the customer, places the customer on hold, and then talks the customer again, the Talk Segment equals 2. |
| Time to Abandon | The duration of time until the conversation was abandoned. |
| Total ACW | The cumulative time spent in after-call work (ACW) on all interactions. After-call work is the work that an agent performs immediately following an interaction. Work may involve keying activity codes, updating customer databases, filling out forms, or initiating outbound contact. As a metric, it indicates the total time an agent takes to finish working on a call. If an agent must complete work before the agent can handle the next contact, then ACW is factored into the average handle time. |
| Total Alert | The total time Genesys Cloud alerts agents before the agent accepts or declines an interaction. |
| Total Barge-In | Total time spent barging into the conversation. |
| Active Total Callback | Active total callback duration is the sum of all calling activity for the call portions of the callback. For example, the active total callback duration could include all durations from the call portion of a callback: tContacting --> tDialing --> tTalk --> tHeld --> tTalk --> tAcw. |
| Total Coaching | Total time spent coaching in the conversation. |
| Total Contacting | The total time an interaction spent connecting to the agent’s phone before dialing out. |
| Total Dialing | The total time spent dialing out. |
| Total Handle | The total amount of time agents spend on an interaction including time spent contacting, time spent dialing, talk time, hold time, and after call work. |
| Total Hold | The total amount of time the customer was on hold. |
| Total IVR | The total amount of time that interactions spent in IVRs. |
| Total Monitor | Total time that the user spent monitoring interactions. |
| Total Queue | The amount of time the interaction spent waiting on an Automatic Call Distributor before connecting to an agent. |
| Total Talk | The total amount of time spent interacting on all the conversations by the agent, within an interval. For example, in an interaction, where an agent accepts an interaction, talks to the customer for two minutes, places the customer on hold for one minute, and then talks to the customer again for two minutes, the Total Talk equals 4 minutes. |
| Total Voicemail | Total duration of voicemails included in the conversation. |
| Transfers | A measurement of the number of interactions an agent answered in one queue and then transferred. A transfer counts for the queue in which an agent answers the interaction. This measurement is calculated by the number of interactions blind transferred or consult transferred. |
| Active Park | Displays the duration of the interaction that is currently parked. |
| Total Park | Displays the total parked duration of the completed interaction. |
| User Segments | The number of times an agent (user) was on an interaction. For example, if agent A answered an email interaction twice, and agent B answered the same email interaction once, then user segments would be 3. |
| Wrap-up Segments | The number of times an interaction was in wrap-up. |
Surveys
| Column | Description |
|---|---|
| Column | Description |
| Has Survey Data | Whether an interaction is associated with survey data. |
| Promoter Score | The promoter score given by a survey respondent in a survey. Genesys Cloud uses the promoter score to calculate the survey’s overall NPS. For more information about NPS, see Net Promoter Score web survey question overview. |
| Survey Form | The name of the survey form sent. |
| Survey Score | The completed surveys’ percentage score. The score does not include NPS. |
| Survey Status |
Displays the status of the survey:
|
| Surveys | The number of surveys sent related to the interaction. |
| Survey Type | Displays the type of the survey, such as voice or web. One value is listed for each survey that is associated with the interaction. |
Evaluations
| Column | Description |
|---|---|
| Column | Description |
| Evaluated Agent | A comma-separated list of names of evaluated agents for any associated evaluations. |
| Evaluation Assignee | A comma-separated list of names of evaluation assignees for the associated evaluations. |
| Evaluation Created | Whether the interaction has an evaluation associated with it. |
| Evaluation Critical Score | The status and value of the evaluation critical score. See Evaluation scoring. |
| Evaluation Score | The score for any associated evaluations. |
| Evaluation Status | The status for any associated evaluations. |
| Evaluator | A comma-separated list of names of evaluators for the associated evaluations. |
Outbound
| Column | Description |
|---|---|
| Column | Description |
| Call Analysis Result | The type of call detected based on call analysis. Results include disconnect, live voice, busy, machine, no answer, SIT callable, fax, line connected, speech, SIT uncallable, and not found. |
| Campaign | Whether an interaction has a campaign associated with it. |
| Campaign Caller Name | The name of the customer being called by the campaign. |
| Campaign Name | The name of the campaign associated with the interaction. |
| Campaign Start | The start date of the first outbound call of a campaign. |
| Contact ID | The contact ID associated with the interaction. |
| Contact List | The name of the contact list associated with the interaction. |
| Outbound Attempt | The number of attempts made to call the customer. |
| Time to Agent | The amount of time it took for the campaign call to reach an agent. |
| Time to Flow | The amount of time it took for the campaign call to enter a flow. |
Flows
| Column | Description |
|---|---|
| Column | Description |
| All Flow Disconnect | The total number of times a flow disconnected entries, including: Customer Disconnects, Flow Disconnects, and System Error Disconnects. |
| Customer Disconnect | The number of times customers disconnected in a flow, including the percentage of customer disconnects compared with the disconnect count. |
| Customer Short Disconnect | The number of times customers disconnected in a flow before a short disconnect time. Includes the percentage of customer short disconnects compared with the disconnect count. The default short disconnect time is less than 10 seconds, though administrators can set the short disconnect time to any threshold they want. For more information, see the Configure analytics settings section in Configure contact center analytics options. |
| Failed Outcomes | Displays a list of failed flow outcomes for the interaction. |
| Flow | The name of the flow that the interaction used. |
| Flow Disconnect | The number of times a flow disconnected entries, including the percentage of flow disconnects compared with the total number of disconnects. |
| Flow Exit | The number of times an entry exited a flow to another flow. Includes the percentage of flow exits compared with the total number of exits. |
| Incomplete Outcomes | Displays a list of incomplete flow outcomes for the interaction. |
| Outcome Attempts | The number of flow outcomes in the interaction. |
| Outcome Failure | The number of flow outcomes that were failures. Includes the percentage of failure outcomes compared with the total number of outcomes. |
| Outcome Success | The number of flow outcomes that were success. Includes the percentage of success outcomes compared with the total number of outcomes. |
| Successful Outcomes | Displays a list of successful flow outcomes for the interaction. |
| System Error Disconnect | The number of times entries disconnected in a flow due to a system error. This column includes the percentage of system error disconnects compared with the total number of disconnects. |
Journey
| Column | Description |
|---|---|
| Column | Description |
| Has Customer Journey Data | Whether an interaction has Predictive Engagement customer journey data associated with it. |
| Proactive | Whether Predictive Engagement offered a chat during a customer’s website visit based on the Predictive Engagement action map settings. |
External Contact
| Column | Description |
|---|---|
| Column | Description |
| External Contact | Displays the first and last name of the contact. |
| External Organization | Displays the organization name. |
Campaign Performance Detail view
Campaign
| Column | Column Description |
|---|---|
| Campaign connect rate | The total number of outbound campaign-connected conversations divided by the total number of campaign attempts for the selected interval. |
| Compliance abandon rate | The percentage of interactions that did not reach the agent within the configured compliance abandon threshold compared with the configurable interactions subject to the compliance abandon rate. See Outbound settings. For more information, see Outbound abandoned calls. |
| Contact abandon | The number of times a contact connected to the platform, but was not connected to an agent within the Compliance Abandon Threshold. For more information about abandoned calls, see Outbound abandoned calls. |
| Contact abandon rate | The percentage of Compliance Abandons divided by total contacts. |
| Contacts | The number of times a contact is connected to an agent. |
| Dial abandon rate | The percentage of abandons divided by the total dials. |
| Dials | The number of interactions initiated by the campaign. |
| Division | The number of interactions for a specific division. |
| True Abandon | The number of interactions attempted to route to an available agent, but the contact ended the call before reaching an agent. For more information, see Outbound abandoned calls. |
| True Abandon Rate | The percentage of interactions attempted to route to an available agent, but the contact ended the call before reaching an agent. |
Performance
| Column | Description |
|---|---|
| Offered | The number of interactions routed into the queue for an agent to answer. Offered interactions are either answered, abandoned, or flow-out interactions. |
| Avg Agent Response | The average time the agent takes to turn the conversation back to the customer. Calculated by (total average agent response time / total number of agent chat sessions). |
| Avg Customer Response | The average time the customer takes to turn the conversation back to the agent. Calculated by (total average customer response time / total number of customer chat sessions). |
| Total First Response | The total amount of time the agents take to send their first message after connecting to a chat. Calculated by the total duration between the agent's session connecting and the agent's first message sent. |
| Message Turns | The total number of times the conversation turns from one participant to another, that is, a complete communication where one person sends one or more messages and the other responds. |
| Avg Time to First Response | The average time the agent takes to send a message once they connect to the conversation. |
| Total First Engagement | The time the customer takes to receive an engagement from an agent. It is determined from the time difference between the first customer message at the beginning of the chat and the first message that they received from an agent. Messages from the bots are not considered for calculation. |
| Avg Time to First Engagement | The average time it takes for a customer to receive an engagement from an agent. Calculated by (the total duration between the customer's first message and the first agent response / the number of first engagements). Messages from the bots are not considered for calculation. |
| Avg Message Turns | The average amount of the back and forth messages per conversation session. Calculated by (the total number of message turns / the total count of number of message turns). |
| Answer | A measurement of the number of assigned ACD interactions answered by an agent in a given period. Answered increments when the agent is the first to connect to the interaction. |
| Answered (in Answered % column) | The percentage of offered interactions that an agent answered. Calculated by: (Answered / Offered) * 100 |
| Flow-Out | Flow-outs are interactions that enter and leave a queue without getting answered by an agent and without getting disconnected. Flow-outs are an indication of customer service level and queue productivity. High numbers of flow-outs can indicate staffing issues or ineffective agents when used with high handle times (bullseye matching metrics). Flow-outs can include transfers to voicemail, callbacks, and any system-driven events such as in-queue flows that transfer to another queue or external party after a certain amount of time. Flow-outs can also occur if the caller opts to exit out of the queue and return to the IVR. Offered interactions are either flow-out, answered, or abandoned interactions. |
| ASA |
The average amount of time an interaction waits in the campaign before an agent answers it. This metric excludes the interactions that the agents do not answer. ASA is directly associated with service level and provides insight into the customer service your company provides. ASA is recorded in the interval in which the agent answered the interaction. Calculated by: Total Time to Answer / Number Answered |
| Avg Wait | The average amount of time an interaction is in a queue before an agent answers it, before the interaction moves out of the queue, or before the customer abandons the interaction. Calculated by: Total Wait Time / Interactions |
| Handle | The total number of ACD and non-ACD interactions that agents were involved in for the selected media type. Handle increments in the interval in which the interaction ends, after the agent completes any after call work and completes the interaction. |
| Avg Handle |
The average amount of time agents spent handling interactions. This calculation includes talk time, hold time, and after-call work. For outbound calls it also includes dialing and contacting time. Calculated by: (cumulative talk time + cumulative hold time + cumulative after-call work + cumulative dialing time + cumulative contacting time) / Number of interactions handled Note: The interactions can span multiple time intervals. For example, a 45-minute call spans two 30-minute intervals. However, metrics are assigned a single timestamp and reported in the interval into which this timestamp falls. The timestamps are assigned based on when the metric calculation is complete.
For instance, handle time will use the timestamp of after call work completion. In the example of a 45-minute call, the handle time falls in the second 30-minute interval because the handle time was calculated at the end of the call when ACW was submitted. In these views, the Avg Talk, Avg Hold, and Avg ACW columns do not equal the Avg Handle column because only some interactions include holds. This view calculates the average handle column using cumulative counts rather than averages. |
| Avg Talk | The average number of seconds spent interacting on a media type. Calculated by: Total Talk time / Count of interactions with Talk time |
| Avg Hold | The average number of seconds that interactions were placed on hold. Calculated by: Total Hold Time / Count of interactions with holds |
| Avg ACW | The average amount of time agents spent completing after-call work. Calculated by: Total ACW / Interactions with ACW |
| Total Handle | The total amount of time agents spend on an interaction including time spent contacting, time spent dialing, talk time, hold time, and after call work. |
| Total Talk | The total amount of time spent interacting on all the conversations by the agent, within an interval. For example, in an interaction, where an agent accepts an interaction, talks to the customer for two minutes, places the customer on hold for one minute, and then talks to the customer again for two minutes, the Total Talk equals 4 minutes. |
| Total Hold | The cumulative hold time for all interactions. |
| Total ACW | The cumulative time spent in after-call work (ACW) on all interactions. After-call work is the work that an agent performs immediately following an interaction. Work may involve keying activity codes, updating customer databases, filling out forms, or initiating outbound contact. As a metric, it indicates the total time an agent takes to finish working on a call. If an agent must complete work before the agent can handle the next contact, then ACW is factored into the average handle time. |
| Hold | The number of interactions with holds. |
| Transfer | A measurement of the number of interactions an agent answered in one queue and then transferred. A transfer counts for the queue in which an agent answers the interaction. This measurement is calculated by the number of interactions blind transferred or consult transferred. |
| Blind Transfer | The number of interactions an agent answered in one queue and then blind transferred. A blind transfer counts for the queue in which an agent answers the interaction. |
| Consult | The number of interactions an agent answered and then consulted with another participant with or without fully transferring the interaction. A consult counts for the queue in which an agent answers the interaction, even if they consult with another queue. |
| Consult Transfer | The number of call interactions an agent answered in one queue and then consult transferred, meaning they connected with a person or queue before transferring the call. A consult transfer counts for the queue in which an agent answers the interaction. See Consult transfer a call. |
| Total Wait | The total amount of time an interaction is in a queue before an agent answers it, it flows out, or the customer abandons it. Genesys Cloud calculates the wait time in milliseconds. |
| Avg Abandon | The average amount of time before a customer disconnects in an ACD campaign before connecting with an agent. For example, the customer hangs up before an agent answers, or the system disconnects the interaction. |
| Total Abandon | The total amount of time interactions are in queue waiting for an agent to answer them before customers abandoned the interactions. |
| Total Alert | The total time Genesys Cloud alerts the agent before the agent accepts or declines an interaction. |
| Total Alert – No Answer | The total number of seconds Genesys Cloud offered an agent an interaction before the agent declined the interaction or the interaction timed out. |
| Connection | The number of interactions that initially connected to the contact center in a particular location, such as a queue or IVR. |
| Transfer % | The number of transfers compared with the total number of interactions answered. Calculated by: (No. of transfers / interactions answered) * 100 |
| Alert | The number of times agents receive an alert for interactions. |
| Alert – No Answer | The number of times the agent did not answer an offered interaction while On Queue or Interacting. While Not Responding, the agent does not receive new interactions, but the agent could still be handling and completing other previous interactions. |
| Max Alert | The maximum amount of time an agent was being alerted. |
| Max Alert – No Answer | The maximum amount of time an agent was being alerted without responding to an interaction. |
| Max Handle | The maximum amount of time agents were involved in ACD and non-ACD interactions, including answered interactions, transfers, callbacks, and outbound calls. |
| Max Abandon | The maximum time of an abandoned interaction for the selected interval. |
| Min Abandon | The minimum time of an abandoned interaction for the selected interval. |
| Max Wait | The maximum amount of time spent waiting in queue for the selected interval. |
| Min Alert | The minimum amount of time an agent was being alerted. |
| Min Alert – No Answer | The minimum amount of time an agent was being alerted without responding to an interaction. |
| Min Handle | The minimum amount of time agents were involved in ACD and non-ACD interactions, including answered interactions, transfers, callbacks, and outbound calls. |
| Min Wait | The minimum amount of time spent waiting in queue for the selected interval. |
| Max Talk | The maximum amount of time spent interacting for the selected interval. |
| Min Talk | The minimum amount of time spent interacting for the selected interval. |
| Max Hold | The maximum amount of time spent on hold for the selected interval. |
| Min Hold | The minimum amount of time spent on hold for the selected interval. |
| Max ACW | The maximum amount of time spent on after call work for the selected interval. |
| Min ACW | The minimum amount of time spent on after call work for the selected interval. |
| Over SLA | Number of interactions that were over the defined Service Level. |
| Short Abandon | Number of interactions that were short abandoned. |
| Short Abandon % | Percent of interactions that were short abandoned. |
| Abandon – No Short | Number of abandons excluding the short abandons. |
| Abandon – No Short % | Percent of abandons excluding the short abandons. |
Campaign Performance Summary view
Performance
| Column | Description |
|---|---|
| Column | Column Description |
| Offer | The number of interactions routed into the queue for an agent to answer. Offered interactions are either answered, abandoned, or flow-out interactions. |
| Answer % | The percentage of offered interactions that an agent answered. Calculated by: (Answered / Offered) * 100 |
| Answer | A measurement of the number of assigned ACD interactions answered by an agent in a given period. Answered increments when the agent is the first to connect to the interaction. |
| Avg Agent Response | The average time the agent takes to turn the conversation back to the customer. Calculated by (total average agent response time / total number of agent chat sessions). |
| Avg Customer Response | The average time the customer takes to turn the conversation back to the agent. Calculated by (total average customer response time / total number of customer chat sessions). |
| Total First Response | The total amount of time the agents take to send their first message after connecting to a chat. Calculated by the total duration between the agent's session connecting and the agent's first message sent. |
| Message Turns | The total number of times the conversation turns from one participant to another, that is, a complete communication where one person sends one or more messages and the other responds. |
| Avg Time to First Response | The average amount of time the agents take to send their first message after connecting to a chat. Calculated from the duration between the agent's session connecting and the agent's first message sent. Calculated by (the total duration of time of first response messages / the total number of first response messages). Messages from the bots are not considered for calculation. |
| Total First Engagement | The time the customer takes to receive an engagement from an agent. It is determined from the time difference between the first customer message at the beginning of the chat and the first message that they received from an agent. Messages from the bots are not considered for calculation. |
| Avg Time to First Engagement | The average time it takes for a customer to receive an engagement from an agent. Calculated by (the total duration between the customer's first message and the first agent response / the number of first engagements). Messages from the bots are not considered for calculation. |
| Avg Message Turns | The average amount of the back and forth messages per conversation session. Calculated by (the total number of message turns / the total count of number of message turns). |
| Flow-Out | Flow-outs are interactions that enter and leave a queue without getting answered by an agent and without getting disconnected. Flow-outs are an indication of customer service level and queue productivity. High numbers of flow-outs can indicate staffing issues or ineffective agents when used with high handle times (bullseye matching metrics). Flow-outs can include transfers to voicemail, callbacks, and any system-driven events such as in-queue flows that transfer to another queue or external party after a certain amount of time. Flow-outs can also occur if the caller opts to exit out of the queue and return to the IVR. Offered interactions are either flow-out, answered, or abandoned interactions. |
| ASA |
The average amount of time an interaction waits in a campaign before an agent answers it. This metric does not include interactions that agents do not answer. ASA is directly associated with service level and provides insight into the customer service your company provides. ASA is recorded in the interval in which the agent answered the interaction. Calculated by: Total Time to Answer / Number Answered |
| Avg Wait | The average amount of time an interaction is in a queue before an agent answers it, before the interaction moves out of the queue, or before the customer abandons the interaction. Calculated by: Total Wait Time / Interactions |
| Handle | The total number of ACD and non-ACD interactions that agents were involved in for the selected media type. Handle increments in the interval in which the interaction ends, after the agent completes any after call work and completes the interaction. |
| Avg Handle |
The average amount of time agents spent handling interactions. This calculation includes talk time, hold time, and after-call work. For outbound calls it also includes dialing and contacting time. Calculated by: (cumulative talk time + cumulative hold time + cumulative after-call work + cumulative dialing time + cumulative contacting time) / Number of interactions handled Note: The interactions can span multiple time intervals. For example, a 45-minute call spans two 30-minute intervals. However, metrics are assigned a single timestamp and reported in the interval into which this timestamp falls. The timestamps are assigned based on when the metric calculation is complete.
For instance, handle time will use the timestamp of after call work completion. In the example of a 45-minute call, the handle time falls in the second 30-minute interval because the handle time was calculated at the end of the call when ACW was submitted. In these views, the Avg Talk, Avg Hold, and Avg ACW columns do not equal the Avg Handle column because only some interactions include holds. This view calculates the average handle column using cumulative counts rather than averages. |
| Avg Talk | The average number of seconds spent interacting on a media type. Calculated by: Total Talk time / Count of interactions with Talk time |
| Avg Hold | The average number of seconds that interactions were placed on hold. Calculated by: Total Hold Time / Count of interactions with holds |
| Avg ACW | The average amount of time agents spent completing after-call work. Calculated by: Total ACW / Interactions with ACW |
| Total Handle |
The total amount of time agents spend on an interaction including time spent contacting, time spent dialing, talk time, hold time, and after call work. In some cases, as after-call work overlaps with talk time or hold time, this sum of cumulative metrics represented in Total Handle is not the same as the tHandle metric, which eliminates any overlap. |
| Total Talk | The total amount of time spent interacting on all the conversations by the agent, within an interval. For example, in an interaction, where an agent accepts an interaction, talks to the customer for two minutes, places the customer on hold for one minute, and then talks to the customer again for two minutes, the Total Talk equals 4 minutes. |
| Total Hold | The cumulative hold time for all interactions. |
| Total ACW | The cumulative time spent in after-call work (ACW) on all interactions. After-call work is the work that an agent performs immediately following an interaction. Work may involve keying activity codes, updating customer databases, filling out forms, or initiating outbound contact. As a metric, it indicates the total time an agent takes to finish working on a call. If an agent must complete work before the agent can handle the next contact, then ACW is factored into the average handle time. |
| Hold | The number of interactions with holds. |
| Transfer | A measurement of the number of interactions an agent answered in one queue and then transferred. A transfer counts for the queue in which an agent answers the interaction. This measurement is calculated by the number of interactions blind transferred or consult transferred. |
| Blind Transfer | The number of interactions an agent answered in one queue and then blind transferred. A blind transfer counts for the queue in which an agent answers the interaction. |
| Consult | The number of interactions an agent answered and then consulted with another participant with or without fully transferring the interaction. A consult counts for the queue in which an agent answers the interaction, even if they consult with another queue. |
| Consult Transfer | The number of call interactions an agent answered in one queue and then consult transferred, meaning they connected with a person or queue before transferring the call. A consult transfer counts for the queue in which an agent answers the interaction. See Consult transfer a call. |
| Avg Abandon | The average amount of time before a customer disconnects in an ACD campaign before connecting with an agent. For example, the customer hangs up before an agent answers, or the system disconnects the interaction. |
| Total Wait | The total amount of time an interaction is in a queue before an agent answers it, it flows out, or the customer abandons it. Genesys Cloud calculates the wait time in milliseconds. |
| Total Abandon | The total amount of time interactions are in queue waiting for an agent to answer them before customers abandoned the interactions. |
| Connection | The number of interactions that initially connected to the contact center in a particular location, such as a queue or IVR. |
| Transfer % | The number of transfers compared with the total number of interactions answered. Calculated by: (No. of transfers / interactions answered) * 100 |
| Max Abandon | The maximum time of an abandoned interaction for the selected interval. |
| Min Abandon | The minimum time of an abandoned interaction for the selected interval. |
| Max Wait | The maximum amount of time spent waiting in queue for the selected interval. |
| Min Wait | The minimum amount of time spent waiting in queue for the selected interval. |
| Max Talk | The maximum amount of time spent interacting for the selected interval. |
| Min Talk | The minimum amount of time spent interacting for the selected interval. |
| Max Hold | The maximum amount of time spent on hold for the selected interval. |
| Min Hold | The minimum amount of time spent on hold for the selected interval. |
| Max ACW | The maximum amount of time spent on after call work for the selected interval. |
| Min ACW | The minimum amount of time spent on after call work for the selected interval. |
| Over SLA | Number of interactions that were over the defined Service Level. |
| Short Abandon | Number of interactions that were short abandoned. |
| Short Abandon % | Percent of interactions that were short abandoned. |
| Abandon – No Short | Number of abandons excluding the short abandons. |
| Abandon – No Short % | Percent of abandons excluding the short abandons. |
| Alert | The number of times agents receive an alert for interactions. |
| Alert – No Answer | The number of times an agent was alerted to a conversation but did not answer the conversation. Note: This metric does not specifically count the number of times an agent was placed in a Not Responding routing status. An agent is transitioned to Not Responding status after a specific alert time threshold for ACD-routed conversations. Alert – No Answer can be incremented for all conversation types for any situation where an alert was not followed by an answer event. |
| Max Alert | The maximum amount of time an agent was being alerted. |
| Max Alert – No Answer | The maximum amount of time an agent was being alerted without responding to an interaction. |
| Max Handle | The maximum amount of time agents were involved in ACD and non-ACD interactions, including answered interactions, transfers, callbacks, and outbound calls. |
| Min Alert | The minimum amount of time an agent was being alerted. |
| Min Alert – No Answer | The minimum amount of time an agent was being alerted without responding to an interaction. |
| Min Handle | The minimum amount of time agents were involved in ACD and non-ACD interactions, including answered interactions, transfers, callbacks, and outbound calls. |
| Total Alert | The total time Genesys Cloud alerts agents before the agent accepts or declines an interaction. |
| Total Alert – No Answer | The total number of seconds Genesys Cloud offered an agent an interaction before the agent declined the interaction or the interaction timed out. |
Campaign
| Column | Column Description |
|---|---|
| Campaign Connect Rate | The total number of outbound campaign-connected conversations divided by the total number of campaign attempts for the selected interval. |
| Campaign Name | The campaign’s given name. |
| Compliance Abandon Rate |
The percentage of interactions that did not reach the agent within the configured compliance abandon threshold, compared with the configurable interactions subject to the compliance abandon rate. For more information, see Outbound settings, and Outbound abandoned calls. |
| Contact Abandon |
The number of times a contact connected to the platform, but was not connected to an agent within the Compliance Abandon Threshold. For more information about abandoned calls, see Outbound abandoned calls. |
| Contact Abandon Rate |
The percentage of Compliance Abandons divided by total contacts. |
| Contacts |
The number of times a contact is connected to an agent. |
| Dialing Mode | The type of dialing mode set for the campaign. The different types of dialing modes supported include Preview, Progressive, Power, and Predictive dialing modes. |
| Connect Rate | The percentage ratio of the total number of outbound dialer calls attempted to the total number of outbound campaigns calls connected. Calculated by (total number of outbound dialer calls/total number of outbound campaigns calls connected)*100. |
| Progress | The percentage of contact records with callable numbers dialed for the campaign. The contact records do not include the contacts on a DNC list, contacts without a number, contacts with wrap-up mapping applied, or contacts with attempt limits or rules set. It measures the progress of the campaign and helps to determine whether more data or agents are to be assigned to the queue/campaign. |
| Idle Agents | The number of available agents currently not on campaign calls. This metric helps monitor the agents who are not busy and assign them to another campaign or queue, or add more data to the campaign to ensure that the agents are busy. |
| Effective Idle Agents | The total portion of idle agents who are dedicated to a specific campaign. Use this metric to view the number of agents associated to that specific campaign. |
| Adjusted Calls/Agent | The ratio of the target abandon rate and the current abandon rate for the campaign. Use this metric to view the current abandon rate for a specific campaign. |
| Outstanding Calls | The current number of in-progress outbound calls. This metric indicates the number of calls that are active without resolution during the stop or start of the campaigns. When a campaign starts, the system includes the outstanding calls in the outstanding call count and retains the call count until the agent or system completes the wrap-up. Recalls and scheduled callbacks are not counted as outstanding calls. |
| Scheduled Calls | The outstanding scheduled callbacks for the campaign. This metric monitors the number of callbacks scheduled and associated to a specific campaign. |
| Outbound Lines | The number of lines assigned to the campaign. Use this metric to view my line allocation to a specific campaign and manage my campaigns more efficiently. |
| RPC Count | The total number of Right Party Contacts (RPC). This metric measures how successful or unsuccessful my campaign is running in terms of RPCs. |
| RPC Failure % | The percentage of Right Party Contact (RPC) failures. |
| RPC Failure Count | The total number of Right Party Contact (RPC) failures. |
| RPC Neutral % | The percentage of the total number of neutral counts (that is, not successful or unsuccessful) of Right Party Contacts (RPC). This metric measures the number of neutral counts that my campaign is running in terms of RPC. |
| RPC Neutral Count | The total number of neutral counts (that is, not successful or unsuccessful) of Right Party Contacts (RPC). This metric measures the number of neutral counts that my campaign is running in terms of RPC. |
| RPC Success % | The percentage of successful Right Party Contacts (RPC). Calculated by (RPC % / campaign dials). |
| RPC Success Count | The total number of successful Right Party Contacts (RPC). |
| Dial Abandon Rate |
The percentage of abandons divided by the total dials. |
| Dials |
The number of interactions initiated by the campaign. |
|
Division |
The number of campaigns for a specific division. |
| True Abandon |
The number of interactions attempted to route to an available agent, but the contact ended the call before reaching an agent. For more information, see Outbound abandoned calls. |
| True Abandon Rate |
The percentage of interactions attempted to route to an available agent, but the contact ended the call before reaching an agent. |
Content Exploration view
Acoustic Metrics
| Column | Description |
|---|---|
| ACD % |
The percentage of time during the interaction when the customer is waiting in a queue. |
| Agent Talk % |
The percentage of time during the interaction when only the agent is talking. |
| Customer Talk % |
The percentage of time during the interaction when only the customer is talking. |
| Hold/Music % | The percentage of hold time and music time across interactions. |
| IVR % | The percentage of IVR interactions. |
| Overtalk % | The percentage of time during the interaction when both the customer and agent speak at the same time for 2 or more seconds. The number in brackets indicates the number of times overtalk occurred during the interaction. |
| Overtalk Instances | The total number of instances when both participants are speaking at the same time for more than 2 seconds. |
| Silence % | The percentage of silence time during the interaction. |
| Total ACD | The total number of ACD interactions. |
| Total Agent Talk | The total agent talk time. |
| Total Customer Talk | The total customer talk time. |
| Total Hold/Music | The total hold/talk time of interactions. |
| Total IVR | The total IVR time of interactions. |
| Total Overtalk | The total overtalk time of interactions. |
| Total Silence | The total silence time of interactions. |
Interactions
| Column | Description |
|---|---|
| ANI | The number of the person who dialed. The main row displays the ANI information from the oldest transcript. |
| Conversation Duration |
The length of the interaction. Calculated by: (Conversation End – Conversation Start) The main row displays the total conversation time obtained by adding the duration of all transcripts. |
| Conversation ID | The specific conversation ID for the interaction. |
| Date | The date at which the interaction started. The main row displays the start time of the oldest transcript. The sub rows display the individual transcript start times. |
| Division | The divisions associated with the interaction. See About access control. |
| DNIS | The original number dialed for the interaction. The main row displays the DNIS information from the oldest transcript. |
| External Tag |
Displays the external tag that is attached to the conversation record. Note: This data is not available for web chat interactions.
|
| Flow | The name of the flow used to route the interaction. |
| From | Displays information for interactions sent from the selected phone number or email addresses. The main row displays the From information from the oldest transcript. The sub rows show the From information details for each transcript. |
| Initial Direction | Whether the interaction started as inbound or outbound. |
| Media Type | The type of media used. |
| Queue | The associated queues. The main row displays an expandable list of all unique queues. The sub rows display the detailed listings of the queues. |
| Subject | The subject associated with the interaction. |
| To | Displays information for interactions sent to the selected phone number or email address. The main row displays the To information from the oldest transcript. The sub rows show the To information details for each transcript. |
| Total Handle | The total amount of time agents spend on an interaction including time spent contacting, time spent dialing, talk time, hold time, and after call work. |
| Users | The internal users who are alerted or involved. |
| Wrap-up | The wrap-up code selected by the agent. |
| Wrap-up Notes | Whether an agent wrote a wrap-up note or not. If the agent wrote a note, a preview of the note displays when you hover over the column. |
Transcript
| Column | Description |
|---|---|
| Detected Category | Displays the specific category of the interaction. |
| Empathy Score |
This score of an agent’s level of empathy and emotional intelligence during customer interactions, from -100 to 100. For more information, see Understanding agent empathy analysis. The main row displays the list of unique scores sorted by oldest to newest. The sub rows do not display the empathy score. Empathy score = 100 * [(Number of empathetic phrases – Number of unhelpful phrases) / (Total number of empathetic and unhelpful phrases)] For example, if an interaction has two empathetic phrases from an agent and three unhelpful phrases the score is calculated as follows: |
| Program | Displays the specific program of the interaction. |
| Sentiment Score | The score of the positive and negative markers in an interaction voice transcript, from -100 to 100. See About sentiment analysis. The main row displays only one score. The sub rows do not display the sentiment score. |
| Sentiment Trend | The comparison of the sentiment in the first half of the interaction with the sentiment in the second half of the interaction. For more information, see What is the customer sentiment trend? |
| Topics | Up to 25 defined topics are included in the transcript. Displays the topics detected on both the internal and external channels. The main row displays an expandable list of all unique topics. The sub rows display the detailed listings of the topics. |
| Topics (External) | Displays the topics detected on the external channel. |
| Topics (Internal) | Displays the topics detected on the internal channel. |
| Transcript Date | The specific transcript date for the interaction. |
| Transcript Duration | The specific transcript duration for the interaction in H:M:S. |
| Transcript ID | The specific transcript ID for the interaction. |
Content Search view
Acoustic Metrics
| Column | Description |
|---|---|
| ACD % |
The percentage of time during the interaction when the customer is waiting in a queue. |
| Agent Talk % |
The percentage of time during the interaction when only the agent is talking. |
| Customer Talk % |
The percentage of time during the interaction when only the customer is talking. |
| Hold/Music % | The percentage of hold time and music time across interactions. |
| IVR % | The percentage of IVR interactions. |
| Overtalk % | The percentage of time during the interaction when both the customer and agent speak at the same time for 2 or more seconds. The number in brackets indicates the number of times overtalk occurred during the interaction. |
| Overtalk Instances | The total number of instances when both participants are speaking at the same time for more than 2 seconds. |
| Silence % | The percentage of silence time during the interaction. |
| Total ACD | The total number of ACD interactions. |
| Total Agent Talk | The total agent talk time. |
| Total Customer Talk | The total customer talk time. |
| Total Hold/Music | The total hold/talk time of interactions. |
| Total IVR | The total IVR time of interactions. |
| Total Overtalk | The total overtalk time of interactions. |
| Total Silence | The total silence time of interactions. |
Interactions
| Column | Description |
|---|---|
| ANI | The number of the person who dialed. The main row displays the ANI information from the oldest transcript. |
| Conversation Duration |
The length of the interaction. Calculated by: (Conversation End – Conversation Start) The main row displays the total conversation time obtained by adding the duration of all transcripts. |
| Conversation ID | The specific conversation ID for the interaction. |
| Date | The date at which the interaction started. The main row displays the start time of the oldest transcript. The sub rows display the individual transcript start times. |
| Division | The divisions associated with the interaction. See About access control. |
| DNIS | The original number dialed for the interaction. The main row displays the DNIS information from the oldest transcript. |
| External Tag |
Displays the external tag that is attached to the conversation record. Note: This data is not available for web chat interactions.
|
| Flow | The name of the flow used to route the interaction. |
| From | Displays information for interactions sent from the selected phone number or email addresses. The main row displays the From information from the oldest transcript. The sub rows show the From information details for each transcript. |
| Initial Direction | Whether the interaction started as inbound or outbound. |
| Media Type | The type of media used. |
| Queue | The associated queues. The main row displays an expandable list of all unique queues. The sub rows display the detailed listings of the queues. |
| Subject | The subject associated with the interaction. |
| To | Displays information for interactions sent to the selected phone number or email address. The main row displays the To information from the oldest transcript. The sub rows show the To information details for each transcript. |
| Total Handle | The total amount of time agents spend on an interaction including time spent contacting, time spent dialing, talk time, hold time, and after call work. |
| Users | The internal users who are alerted or involved. |
| Wrap-up | The wrap-up code selected by the agent. |
| Wrap-up Notes | Whether an agent wrote a wrap-up note or not. If the agent wrote a note, a preview of the note displays when you hover over the column. |
Transcript
| Column | Description |
|---|---|
| Detected Category | Displays the specific category of the interaction. |
| Empathy Score |
This score of an agent’s level of empathy and emotional intelligence during customer interactions, from -100 to 100. For more information, see Understanding agent empathy analysis. The main row displays the list of unique scores sorted by oldest to newest. The sub rows do not display the empathy score. Empathy score = 100 * [(Number of empathetic phrases – Number of unhelpful phrases) / (Total number of empathetic and unhelpful phrases)] For example, if an interaction has two empathetic phrases from an agent and three unhelpful phrases the score is calculated as follows: |
| Program | Displays the specific program of the interaction. |
| Sentiment Score | The score of the positive and negative markers in an interaction voice transcript, from -100 to 100. See About sentiment analysis. The main row displays only one score. The sub rows do not display the sentiment score. |
| Sentiment Trend | The comparison of the sentiment in the first half of the interaction with the sentiment in the second half of the interaction. For more information, see What is the customer sentiment trend? |
| Topics | Up to 25 defined topics are included in the transcript. Displays the topics detected on both the internal and external channels. The main row displays an expandable list of all unique topics. The sub rows display the detailed listings of the topics. |
| Topics (External) | Displays the topics detected on the external channel. |
| Topics (Internal) | Displays the topics detected on the internal channel. |
| Transcript Date | The specific transcript date for the interaction. |
| Transcript Duration | The specific transcript duration for the interaction in H:M:S. |
| Transcript ID | The specific transcript ID for the interaction. |
Data Actions Performance Detail view
| Column | Description |
|---|---|
| Interval | The time interval for the row. The interval for each row depends on the date filter settings. For example, if you set the date filter to a day, then 30-minute intervals display for each row. |
| Executions | The number of attempts to execute this action. This metric includes successful and unsuccessful executions. |
| Avg Duration | The average time, in seconds, that the action took to execute. |
| Min Duration | The minimum time, in seconds, that the action took to execute. |
| Max Duration | The maximum time, in seconds, that the action took to execute. |
| Total Duration | The sum of the durations of all executions of this action. |
| 95% Duration | The 95th percentile duration for this action, in seconds. This means that 95% of actions were completed in this amount of time. This is useful for finding actions with occasionally long execution times. |
| 99% Duration | The 99th percentile duration for this action, in seconds. This means that 99% of actions were completed in this amount of time. This is useful for finding actions with occasionally long execution times. |
| Errors | The total number of executions that resulted in a non-200 level HTTP result. Some expected errors including a 404 response when a lookup does not yield results. |
| Error % | Percentage of execution attempts that resulted in any error response. |
| Remote Endpoint Errors | Errors due to a non-200 level response from the remote endpoint. It is an expected behavior including a failed lookup returning a 404 response. |
| Remote Endpoint Error % | Error % due to a non-200 level response from the remote endpoint. It is an expected behavior including a failed lookup returning a 404 response. |
| Processing Errors | Errors due to failures in processing the action configuration. These errors indicate that the action is misconfigured or unable to handle some inputs or results from the remote web service. Test the action with test mode or contact support for additional details |
| Processing Error % | Error % due to failures in processing the action configuration. A non-zero percentage indicates that the action is misconfigured or unable to handle some inputs or results from the remote web service. Test the action with test mode or contact support for additional details. |
| Authentication Errors | Errors due to an authentication error. A large number of errors likely indicate that the credentials in use are invalid or have expired. |
| Authentication Error % | Error % due to an authentication error. A 100% error percentage likely indicates that the credentials in use are invalid or have expired. |
| Concurrency Rate Limit Errors | Errors due to too many data action executions attempted concurrently. These errors along with a high value for the 99% duration or 95% duration indicate that the remote endpoint should be investigated for slow responses. Contact support for further troubleshooting |
| Concurrency Rate Limit Error % | Error % due to too many data action executions attempted concurrently. A substantial percentage along with a high value for the 99% Duration or 95% Duration indicates that the remote endpoint should be investigated for slow responses. Contact support for further troubleshooting. |
| Volume Rate Limit Errors | Errors due to the per-minute data action limit being exceeded. Assuming the rate of data action executions is expected, contact support to request that the volume limit be increased. |
| Volume Rate Limit Rate | Error % due to the per-minute data action limit being exceeded. Assuming the rate of data action executions is expected, contact support to request that the volume limit be increased. |
| Remote Endpoint 429 Errors | Errors due to the remote endpoint returning a 429 (Rate limited) response. You may consider caching responses from that endpoint to reduce calls to the endpoint or request an increase in your rate limit from that provider. For more information, see Designing Architect flow data actions for resiliency. |
| Remote Endpoint 429 % | Error % due to the remote endpoint returning a 429 (Rate limited) response. You may consider caching responses from that endpoint to reduce calls to the endpoint or request an increase in your rate limit from that provider. For more information, see Design and implement a data action response cache. |
| Success Count | The number of executions that were successful. |
| Success % | The percentage of executions that were successful. |
| Remote Endpoint 4XX Errors | Errors due to the remote endpoint returning a 400-level HTTP status code. |
| Remote Endpoint 5XX Errors | Errors due to the remote endpoint returning a 500-level HTTP status code. |
Data Actions Performance Summary view
| Column | Description |
|---|---|
| Action Category | The category configured for the action. This metric is typically the name of the integration that contains the action. |
| Action Name | The name given to the data action. |
| Executions | The number of attempts to execute this action/category. This includes successful and unsuccessful executions. |
| Avg Duration | The average time, in seconds, taken to execute the action/category. |
| Min Duration | The minimum time, in seconds, taken to execute the action/category. |
| Max Duration | The maximum time, in seconds, taken to execute the action/category. |
| Total Duration | The sum of the durations of all executions of this action/category. |
| 95% Duration | The 95th percentile duration for this action/category, in seconds. This means that 95% of actions were completed in this amount of time. This is useful for finding actions with occasionally long execution times. |
| 99% Duration | The 99th percentile duration for this action/category, in seconds. This means that 99% of actions were completed in this amount of time. This is useful for finding actions with occasionally long execution times. |
| Errors | The total number of executions that resulted in a non-200 level HTTP result. Some errors may be expected including a 404 response when a lookup does not yield results. |
| Error % | Percentage of execution attempts that resulted in any error response. |
| Remote Endpoint Errors | Errors due to a non-200 level response from the remote endpoint. This could be expected behavior including a failed lookup returning a 404 response. |
| Remote Endpoint Error % | Error % due to a non-200 level response from the remote endpoint. This could be expected behavior including a failed lookup returning a 404 response. |
| Processing Errors | Errors due to failures in processing the action configuration. These errors indicate that the action is misconfigured or unable to handle some inputs or results from the remote web service. Test the action with test mode or contact support for additional details |
| Processing Error % | Error % due to failures in processing the action configuration. A non-zero percentage indicates that the action is misconfigured or unable to handle some inputs or results from the remote web service. Test the action with test mode or contact support for additional details. |
| Authentication Errors | Errors due to an authentication error. A large number of errors likely indicate that the credentials in use are invalid or have expired. |
| Authentication Error % | Error % due to an authentication error. A 100% error percentage likely indicates that the credentials in use are invalid or have expired. |
| Concurrency Rate Limit Errors | Errors due to too many data action executions attempted concurrently. These errors along with a high value for the 99% duration or 95% duration indicate that the remote endpoint should be investigated for slow responses. Contact support for further troubleshooting |
| Concurrency Rate Limit Error % | Error % due to too many data action executions attempted concurrently. A substantial percentage along with a high value for the 99% Duration or 95% Duration indicates that the remote endpoint should be investigated for slow responses. Contact support for further troubleshooting. |
| Volume Rate Limit Errors | Errors due to the per-minute data action limit being exceeded. Assuming the rate of data action executions is expected, contact support to request that the volume limit be increased. |
| Volume Rate Limit Rate | Error % due to the per-minute data action limit being exceeded. Assuming the rate of data action executions is expected, contact support to request that the volume limit be increased. |
| Remote Endpoint 429 Errors | Errors due to the remote endpoint returning a 429 (Rate limited) response. You may consider caching responses from that endpoint to reduce calls to the endpoint or request an increase in your rate limit from that provider. For more information, see Designing Architect flow data actions for resiliency. |
| Remote Endpoint 429 % | Error % due to the remote endpoint returning a 429 (Rate limited) response. You may consider caching responses from that endpoint to reduce calls to the endpoint or request an increase in your rate limit from that provider. For more information, see Design and implement a data action response cache. |
| Success Count | The number of executions that were successful. |
| Success % | The percentage of executions that were successful. |
| Remote Endpoint 4XX Errors | Errors due to the remote endpoint returning a 400-level HTTP status code. |
| Remote Endpoint 5XX Errors | Errors due to the remote endpoint returning a 500-level HTTP status code. |
DNIS Performance Detail view
| Column | Description |
|---|---|
| Column | Description |
| Offer | The number of interactions routed into the queue for an agent to answer. Offered interactions are either answered, abandoned, or flow-out interactions. |
| Answer % | The percentage of offered interactions that an agent answered. Calculated by: (Answered / Offered) * 100 |
| Answered (in Answered % column) | A measurement of the number of assigned ACD interactions answered by an agent in a given period. Answered increments when the agent is the first to connect to the interaction. |
| Abandon % | The percentage of offered interactions in which the customer disconnected before connecting with an agent. The abandon rate can identify queues that require extra staff to handle interactions in a timely manner. Calculated by: (Abandoned Count / Offered Count) * 100 |
| Flow-Out | Flow-outs are interactions that enter and leave a queue without getting answered by an agent and without getting disconnected. Flow-outs are an indication of customer service level and queue productivity. High numbers of flow-outs can indicate staffing issues or ineffective agents when used with high handle times (bullseye matching metrics). Flow-outs can include transfers to voicemail, callbacks, and any system-driven events such as in-queue flows that transfer to another queue or external party after a certain amount of time. Flow-outs can also occur if the caller opts to exit out of the queue and return to the IVR. Offered interactions are either flow-out, answered, or abandoned interactions. |
| ASA | The average amount of time an interaction waits in the queue before an agent answers. This metric does not include interactions that agents do not answer. Average Speed of Answer (ASA) is directly associated with the service level and provides insight into the customer service your organization provides. ASA is recorded in the interval in which the agent answered the interaction. Calculated by: Total Answered (tAnswered Sum) / Answered Count (tAnswered Count) Note: Raw values are provided in milliseconds. |
| Service Level % | Service level target is a contact center performance statistic expressed as “X percent of conversations answered in Y seconds.” For example, a goal of answering 80% of voice calls within 20 seconds provides a service level target of 80/20. You can set the service level target for each media type in a queue. Analytics uses this service level target to calculate whether you are within the service level % defined by your service level agreement (SLA). For more information about setting the service level target, see Create queues or Edit or delete queues. Note: In the performance views that are not queue-specific, the Service Level % is calculated by queue and displayed as a – on the aggregated group row since SLA targets vary by queue. The affected views are DNIS Performance Summary and Skills Performance views. To view individual queue service level %, click the + to expand the row.
The service level % is the percentage of interactions that meet your contact center's service level target. The formula to calculate the service level % is:
Number of Conversations Answered within SLA The numerator is calculated by taking the total answered conversations and subtracting the conversations that were not answered within the SLA threshold. Calculated by: (Answered Count – SLA Violation Count) Total Number of Conversations The Service Level Options configuration determines the denominator. With all the options below unchecked, the denominator is the count of answered conversations.
As the service level calculation depends on an organization’s configured options, the final formula to calculate the service level is:
Notes:
|
| Handle | The total number of ACD and non-ACD interactions that agents were involved in for the selected media type. Handle increments in the interval in which the interaction ends, after the agent completes any after call work and completes the interaction. |
| IVR | The number of times interactions entered an IVR. An interaction can enter an IVR more than one time. |
| Avg IVR | The average amount of time interactions that enter an IVR stay in an IVR. Calculated by (Total IVR time / number of interactions with IVR) |
| Total IVR | The total amount of time that interactions spent in IVRs. |
| Avg Handle |
The average amount of time agents spent handling interactions. This calculation includes talk time, hold time, and after-call work. For outbound calls it also includes dialing and contacting time. Calculated by: (cumulative talk time + cumulative hold time + cumulative after-call work + cumulative dialing time + cumulative contacting time) / Number of interactions handled Note: The interactions can span multiple time intervals. For example, a 45-minute call spans two 30-minute intervals. However, metrics are assigned a single timestamp and reported in the interval into which this timestamp falls. The timestamps are assigned based on when the metric calculation is complete.
For instance, handle time will use the timestamp of after call work completion. In the example of a 45-minute call, the handle time falls in the second 30-minute interval because the handle time was calculated at the end of the call when ACW was submitted. In these views, the Avg Talk, Avg Hold, and Avg ACW columns do not equal the Avg Handle column because only some interactions include holds. This view calculates the average handle column using cumulative counts rather than averages. |
| Avg Talk | The average number of seconds spent interacting on a media type. Calculated by: Total Talk time / Count of interactions with Talk time |
| Avg Hold | The average number of seconds that interactions were placed on hold. Calculated by: Total Hold Time / Count of interactions with holds |
| Avg ACW | The average amount of time agents spent completing after-call work. Calculated by: Total ACW / Interactions with ACW |
| Total Handle | The total amount of time agents spend on an interaction including time spent contacting, time spent dialing, talk time, hold time, and after call work. |
| Total Talk | The total amount of time spent interacting on all the conversations by the agent, within an interval. For example, in an interaction, where an agent accepts an interaction, talks to the customer for two minutes, places the customer on hold for one minute, and then talks to the customer again for two minutes, the Total Talk equals 4 minutes. |
| Total Hold | The cumulative hold time for all interactions. |
| Total ACW | The cumulative time spent in after-call work (ACW) on all interactions. After-call work is the work that an agent performs immediately following an interaction. Work may involve keying activity codes, updating customer databases, filling out forms, or initiating outbound contact. As a metric, it indicates the total time an agent takes to finish working on a call. If an agent must complete work before the agent can handle the next contact, then ACW is factored into the average handle time. |
| Hold | The number of interactions with holds. |
| Transfer | A measurement of the number of interactions an agent answered in one queue and then transferred. A transfer counts for the queue in which an agent answers the interaction. This measurement is calculated by the number of interactions blind transferred or consult transferred. |
| Connection | The number of interactions that initially connected to the contact center in a particular location, such as a queue or IVR. |
| Transfer % | The number of transfers compared with the total number of interactions answered. Calculated by: (No. of transfers / interactions answered) * 100 |
| Max Abandon | The maximum time of an abandoned interaction for the selected interval. |
| Min Abandon | The minimum time of an abandoned interaction for the selected interval. |
| Max Wait | The maximum amount of time spent waiting in queue for the selected interval. |
| Min Wait | The minimum amount of time spent waiting in queue for the selected interval. |
| Max Talk | The maximum amount of time spent interacting for the selected interval. |
| Min Talk | The minimum amount of time spent interacting for the selected interval. |
| Max Hold | The maximum amount of time spent on hold for the selected interval. |
| Min Hold | The minimum amount of time spent on hold for the selected interval. |
| Max ACW | The maximum amount of time spent on after call work for the selected interval. |
| Min ACW | The minimum amount of time spent on after call work for the selected interval. |
| Over SLA | Number of interactions that were over the defined Service Level. |
| Met SLA | Number of interactions that met the defined service level. |
| Short Abandon | Number of interactions that were short abandoned. |
| Short Abandon % | Percent of interactions that were short abandoned. |
| Abandon – No Short | Number of abandons excluding the short abandons. |
| Abandon – No Short % | Percent of abandons excluding the short abandons. |
| Voicemail | Count of voicemails received. |
|
Abandon |
The number of times an end user abandoned an interaction in a queue. For example, the customer hangs up before an agent answers, or the system disconnects the interaction. |
|
ACW |
The number of times after-call work (ACW) was completed. After-call work is the work that an agent performs immediately following an interaction. Work may involve keying activity codes, updating customer databases, filling out forms, or initiating outbound contact. As a metric, it indicates the total time an agent takes to finish working on a call. If an agent must complete work before the agent can handle the next contact, then ACW is factored into the average handle time. Note: By default, the summary of metrics displayed includes all activity for the agent. To filter down to the activities specific to a queue, you can apply a filter. |
|
Max Handle |
The maximum amount of time agents were involved in ACD and non-ACD interactions, including answered interactions, transfers, callbacks, and outbound calls. |
|
Min Handle |
The minimum amount of time agents were involved in ACD and non-ACD interactions, including answered interactions, transfers, callbacks, and outbound calls. |
|
Max IVR |
The maximum amount of time interactions that enter an IVR stay in an IVR. |
|
Min IVR |
The minimum amount of time interactions that enter an IVR stay in an IVR. |
|
Talk |
The number of sessions where the user(s) interacted during conversations. A session includes the point where the agent joins the conversation to the point where they disconnect. |
|
Total Abandon |
The total amount of time interactions are in queue waiting for an agent to answer them before customers abandoned the interactions. |
|
Total Wait |
The total amount of time an interaction is in a queue before an agent answers it, it flows out, or the customer abandons it. Genesys Cloud calculates the wait time in milliseconds. |
|
Wait |
The number of interactions that waited in the queue. |
|
Avg Flow-Out |
The average amount of time an interaction spends in queue before it flows out. Calculated by: Total Flow Out Time / Count of interactions with flow-outs For more information, see Queues Performance Summary view. |
|
Max Flow-Out |
The maximum amount of time an interaction spends in queue before it flows out. For more information, see Queues Performance Summary view. |
|
Min Flow-Out |
The minimum amount of time an interaction spends in queue before it flows out. For more information, see Queues Performance Summary view. |
DNIS Performance Summary view
| Column | Description |
|---|---|
| Column | Description |
| DNIS | The number dialed by the calling party. |
| Offer | The number of interactions routed into the queue for an agent to answer. Offered interactions are either answered, abandoned, or flow-out interactions. |
| Answer % | The percentage of offered interactions that an agent answered. Calculated by: (Answered / Offered) * 100 |
| Answered (in Answered % column) | A measurement of the number of assigned ACD interactions answered by an agent in a given period. Answered increments when the agent is the first to connect to the interaction. |
| Abandon % | The percentage of offered interactions in which the customer disconnected before connecting with an agent. The abandon rate can identify queues that require extra staff to handle interactions in a timely manner. Calculated by: (Abandoned Count / Offered Count) * 100 |
| Flow-Out | Flow-outs are interactions that enter and leave a queue without getting answered by an agent and without getting disconnected. Flow-outs are an indication of customer service level and queue productivity. High numbers of flow-outs can indicate staffing issues or ineffective agents when used with high handle times (bullseye matching metrics). Flow-outs can include transfers to voicemail, callbacks, and any system-driven events such as in-queue flows that transfer to another queue or external party after a certain amount of time. Flow-outs can also occur if the caller opts to exit out of the queue and return to the IVR. Offered interactions are either flow-out, answered, or abandoned interactions. |
| Avg Abandon | The average amount of time before a customer disconnects in an ACD queue before connecting with an agent. For example, the customer hangs up before an agent answers, or the system disconnects the interaction. |
| Avg Wait |
The average amount of time an interaction is in a queue before an agent answers it, it flows out, or the customer abandons it. Calculated by: Total Wait Time / Interactions. |
| ASA | The average amount of time an interaction waits in the queue before an agent answers. This metric does not include interactions that agents do not answer. Average Speed of Answer (ASA) is directly associated with the service level and provides insight into the customer service your organization provides. ASA is recorded in the interval in which the agent answered the interaction. Calculated by: Total Answered (tAnswered Sum) / Answered Count (tAnswered Count) Note: Raw values are provided in milliseconds. |
| Service Level % |
Service level target is a contact center performance statistic expressed as “X percent of conversations answered in Y seconds.” For example, a goal of answering 80% of voice calls within 20 seconds provides a service level target of 80/20. You can set the service level target for each media type in a queue. Analytics uses this service level target to calculate whether you are within the service level % defined by your service level agreement (SLA). For more information about setting the service level target, see Create queues or Edit or delete queues. Note: In the performance views that are not queue-specific, the Service Level % is calculated by queue and displayed as a – on the aggregated group row since SLA targets vary by queue. The affected views are DNIS Performance Summary and Skills Performance views. To view individual queue service level %, click the + to expand the row.
The service level % is the percentage of interactions that meet your contact center's service level target. The formula to calculate the service level % is:
Number of Conversations Answered within SLA The numerator is calculated by taking the total answered conversations and subtracting the conversations that were not answered within the SLA threshold. Calculated by: (Answered Count – SLA Violation Count) Total Number of Conversations The Service Level Options configuration determines the denominator. With all the options below unchecked, the denominator is the count of answered conversations.
As the service level calculation depends on an organization’s configured options, the final formula to calculate the service level is:
Notes:
In this view, the service level set for the queue appears as a gray number beside the service level percentage for the interval. If the service level percentage for the interval is lower than the set service level, then the service level percentage is red. |
| IVR | The number of times interactions entered an IVR. An interaction can enter an IVR more than one time. |
| Avg IVR |
The average amount of time interactions that enter an IVR stay in an IVR. Calculated by (Total IVR time / number of interactions with IVR) |
| Total IVR | The total amount of time that interactions spent in IVRs. |
| Handle | The total number of ACD and non-ACD interactions that agents were involved in for the selected media type. Handle increments in the interval in which the interaction ends, after the agent completes any after call work and completes the interaction. |
| Avg Handle |
The average amount of time agents spent handling interactions. This calculation includes talk time, hold time, and after-call work. For outbound calls it also includes dialing and contacting time. Calculated by: (cumulative talk time + cumulative hold time + cumulative after-call work + cumulative dialing time + cumulative contacting time) / Number of interactions handled Note: The interactions can span multiple time intervals. For example, a 45-minute call spans two 30-minute intervals. However, metrics are assigned a single timestamp and reported in the interval into which this timestamp falls. The timestamps are assigned based on when the metric calculation is complete.
For instance, handle time will use the timestamp of after call work completion. In the example of a 45-minute call, the handle time falls in the second 30-minute interval because the handle time was calculated at the end of the call when ACW was submitted. In these views, the Avg Talk, Avg Hold, and Avg ACW columns do not equal the Avg Handle column because only some interactions include holds. This view calculates the average handle column using cumulative counts rather than averages. |
| Avg Talk | The average number of seconds spent interacting on a media type. Calculated by: Total Talk time / Count of interactions with Talk time |
| Avg Hold | The average number of seconds that interactions were placed on hold. Calculated by: Total Hold Time / Count of interactions with holds |
| Avg ACW | The average amount of time agents spent completing after-call work. Calculated by: Total ACW / Interactions with ACW |
| Total Handle | The total amount of time agents spend on an interaction including time spent contacting, time spent dialing, talk time, hold time, and after call work. |
| Total Talk | The total amount of time spent interacting on all the conversations by the agent, within an interval. For example, in an interaction, where an agent accepts an interaction, talks to the customer for two minutes, places the customer on hold for one minute, and then talks to the customer again for two minutes, the Total Talk equals 4 minutes. |
| Total Hold | The cumulative hold time for all interactions. |
| Total ACW | The cumulative time spent in after-call work (ACW) on all interactions. After-call work is the work that an agent performs immediately following an interaction. Work may involve keying activity codes, updating customer databases, filling out forms, or initiating outbound contact. As a metric, it indicates the total time an agent takes to finish working on a call. If an agent must complete work before the agent can handle the next contact, then ACW is factored into the average handle time. |
| Hold | The number of interactions with holds. |
| Transfer | A measurement of the number of interactions an agent answered in one queue and then transferred. A transfer counts for the queue in which an agent answers the interaction. This measurement is calculated by the number of interactions blind transferred or consult transferred. |
| Connection | The number of interactions that initially connected to the contact center in a particular location, such as a queue or IVR. |
| Transfer % | The number of transfers compared with the total number of interactions answered. Calculated by: (No. of transfers / interactions answered) * 100 |
| Max Abandon | The maximum time of an abandoned interaction for the selected interval. |
| Min Abandon | The minimum time of an abandoned interaction for the selected interval. |
| Max Wait | The maximum amount of time spent waiting in queue for the selected interval. |
| Min Wait | The minimum amount of time spent waiting in queue for the selected interval. |
| Max Talk | The maximum amount of time spent interacting for the selected interval. |
| Min Talk | The minimum amount of time spent interacting for the selected interval. |
| Max Hold | The maximum amount of time spent on hold for the selected interval. |
| Min Hold | The minimum amount of time spent on hold for the selected interval. |
| Max ACW | The maximum amount of time spent on after call work for the selected interval. |
| Min ACW | The minimum amount of time spent on after call work for the selected interval. |
| Over SLA | Number of interactions that were over the defined Service Level. |
| Met SLA | Number of interactions that met the defined service level. |
| Short Abandon | Number of interactions that were short abandoned. |
| Short Abandon % | Percent of interactions that were short abandoned. |
| Abandon – No Short | Number of abandons excluding the short abandons. |
| Abandon – No Short % | Percent of abandons excluding the short abandons. |
| Voicemail | Count of voicemails received. |
|
Abandon |
The number of times an end user abandoned an interaction in a queue. For example, the customer hangs up before an agent answers, or the system disconnects the interaction. |
|
ACW |
The number of times after-call work (ACW) was completed. After-call work is the work that an agent performs immediately following an interaction. Work may involve keying activity codes, updating customer databases, filling out forms, or initiating outbound contact. As a metric, it indicates the total time an agent takes to finish working on a call. If an agent must complete work before the agent can handle the next contact, then ACW is factored into the average handle time. Note: By default, the summary of metrics displayed includes all activity for the agent. To filter down to the activities specific to a queue, you can apply a filter. |
|
Max Handle |
The maximum amount of time agents were involved in ACD and non-ACD interactions, including answered interactions, transfers, callbacks, and outbound calls. |
|
Min Handle |
The minimum amount of time agents were involved in ACD and non-ACD interactions, including answered interactions, transfers, callbacks, and outbound calls. |
|
Max IVR |
The maximum amount of time interactions that enter an IVR stay in an IVR. |
|
Min IVR |
The minimum amount of time interactions that enter an IVR stay in an IVR. |
|
Talk |
The number of sessions where the user(s) interacted during conversations. A session includes the point where the agent joins the conversation to the point where they disconnect. |
|
Total Abandon |
The total amount of time interactions are in queue waiting for an agent to answer them before customers abandoned the interactions. |
|
Total Wait |
The total amount of time an interaction is in a queue before an agent answers it, it flows out, or the customer abandons it. Genesys Cloud calculates the wait time in milliseconds. |
|
Wait |
The number of interactions that waited in the queue. |
|
Avg Flow-Out |
The average amount of time an interaction spends in queue before it flows out. Calculated by: Total Flow Out Time / Count of interactions with flow-outs For more information, see Queues Performance Summary view. |
|
Max Flow-Out |
The maximum amount of time an interaction spends in queue before it flows out. For more information, see Queues Performance Summary view. |
|
Min Flow-Out |
The minimum amount of time an interaction spends in queue before it flows out. For more information, see Queues Performance Summary view. |
Email Agent Performance Detail view
Performance
| Metric | Definition |
|---|---|
| Metric | Definition |
| Answer | A measurement of the number of assigned ACD interactions answered by an agent in a given period. Answered increments when the agent is the first to connect to the interaction. |
| ASA | The average amount of time an interaction waits in the queue before an agent answers. This metric does not include interactions that agents do not answer. Average Speed of Answer (ASA) is directly associated with the service level and provides insight into the customer service your organization provides. ASA is recorded in the interval in which the agent answered the interaction. Calculated by: Total Answered (tAnswered Sum) / Answered Count (tAnswered Count) Note: Raw values are provided in milliseconds. |
| Handle | The total number of ACD and non-ACD interactions that agents were involved in for the selected media type. Handle increments in the interval in which the interaction ends, after the agent completes any after call work and completes the interaction. |
| Avg Handle | The average amount of time agents spent handling interactions. This calculation includes talk time, hold time, and after-call work. For outbound calls it also includes dialing and contacting time. Calculated by: (cumulative talk time + cumulative hold time + cumulative after-call work + cumulative dialing time + cumulative contacting time) / Number of interactions handled Note: The interactions can span multiple time intervals. For example, a 45-minute call spans two 30-minute intervals. However, metrics are assigned a single timestamp and reported in the interval into which this timestamp falls. The timestamps are assigned based on when the metric calculation is complete.
For instance, handle time will use the timestamp of after call work completion. In the example of a 45-minute call, the handle time falls in the second 30-minute interval because the handle time was calculated at the end of the call when ACW was submitted. |
| Adherence | The current adherence status of the user, including In Adherence, Out of Adherence, Unscheduled, Ignored, or Unknown. |
| Adherence Duration | The amount of time represented in days, hours, minutes, and seconds, of the adherence exception. |
| Avg Park | The average amount of time an email was parked by an agent. |
| Department | Department of the user as defined within Genesys Cloud. |
Email address configured for the user. |
|
| Location | Location for the user as defined in Genesys Cloud. |
| Max Park | The maximum amount of time an email was parked by an agent. |
| Min Park | The minimum amount of time an email was parked by an agent. |
| Park | The number of emails parked by an agent. |
| Total Park | The total amount of time an email was parked by an agent. |
| Reports To | The manager as defined for the user within Genesys Cloud. |
| Time in Routing Status |
The amount of time agents have been in their current routing status. |
| Routing Status |
The current routing status of an agent. |
| Scheduled Activity | The activity for which the user is currently scheduled, including On Queue Work, Break, Meal, Meeting, Off Queue Work, Time Off, Training, Unavailable, or Unscheduled. |
| Secondary Status |
The current secondary status of an agent. If there is no secondary status, then this column displays the agent’s primary status. |
| Status |
The current primary status of an agent, such as Available, Away, or Busy. |
|
Time in Status |
The amount of time agents have been in their current primary status. |
| Title | Title of the user as defined within Genesys Cloud. |
| ID | The specific conversation ID for the interaction. |
| Interval | The time period. |
| Avg Interact | The average number of seconds spent interacting on an email. |
| Avg ACW | The average amount of time agents spent completing after-call work. Calculated by: Total ACW / Interactions with ACW |
| Total Handle | The total amount of time agents spend on an interaction including time spent contacting, time spent dialing, talk time, hold time, and after call work. |
| Total Interact | The total amount of time spent interacting on all the email conversations by the agent, within an interval. |
| Total ACW | The cumulative time spent in after-call work (ACW) on all interactions. After-call work is the work that an agent performs immediately following an interaction. Work may involve keying activity codes, updating customer databases, filling out forms, or initiating outbound contact. As a metric, it indicates the total time an agent takes to finish working on a call. If an agent must complete work before the agent can handle the next contact, then ACW is factored into the average handle time. |
| Error | The number of errors that occurred on conversations. |
| Transfer | A measurement of the number of interactions an agent answered in one queue and then transferred. A transfer counts for the queue in which an agent answers the interaction. This measurement is calculated by the number of interactions blind transferred or consult transferred. |
| Outbound | This metric represents the number of outbound interactions placed on behalf of queue. |
| Alert – No Answer | The number of times an agent was alerted to a conversation but did not answer the conversation. Note: This metric does not specifically count the number of times an agent was placed in a Not Responding routing status. An agent is transitioned to Not Responding status after a specific alert time threshold for ACD-routed conversations. Alert – No Answer can be incremented for all conversation types for any situation where an alert was not followed by an answer event. |
| Total Alert – No Answer | The total number of seconds Genesys Cloud offered an agent an interaction before the agent declined the interaction or the interaction timed out. |
| Alert | The number of times agents receive an alert for interactions. |
| Total Alert | The total time Genesys Cloud alerts agents before the agent accepts or declines an interaction. |
| Transfer % | The number of transfers compared with the total number of interactions answered. Calculated by: (No. of transfers / interactions answered) * 100 |
| Min Alert | The minimum amount of time an agent was being alerted. |
| Max Alert | The maximum amount of time an agent was being alerted. |
| Min Alert – No Answer | The minimum amount of time an agent was being alerted without responding to an interaction. |
| Max Alert – No Answer | The maximum amount of time an agent was being alerted without responding to an interaction. |
| Min Handle | The minimum amount of time agents were involved in ACD and non-ACD interactions, including answered interactions, transfers, callbacks, and outbound calls. |
| Max Handle | The maximum amount of time agents were involved in ACD and non-ACD interactions, including answered interactions, transfers, callbacks, and outbound calls. |
| Min Interact | The minimum amount of time spent interacting on an email for the selected interval. |
| Max Interact | The maximum amount of time spent interacting on an email for the selected interval. |
| Min Answer | The minimum amount of time an agent spent answering assigned ACD interactions for the selected interval. |
| Max Answer | The maximum amount of time an agent spent answering assigned ACD interactions for the selected interval. |
| Min ACW | The minimum amount of time spent on after call work for the selected interval. |
| Max ACW | The maximum amount of time spent on after call work for the selected interval. |
| Blind Transfer | The number of interactions an agent answered in one queue and then blind transferred. A blind transfer counts for the queue in which an agent answers the interaction. |
| Blind Transfer % | The percentage of interactions an agent answered in one queue and then blind transferred. |
| Avg ACW Handled | The average time any interaction spent in ACW. This calculation takes into account all interactions handled, not just those that had ACW. Calculated by: Total ACW Time / Number of Interactions Handled |
|
ACW |
The number of times after-call work (ACW) was completed. After-call work is the work that an agent performs immediately following an interaction. Work may involve keying activity codes, updating customer databases, filling out forms, or initiating outbound contact. As a metric, it indicates the total time an agent takes to finish working on a call. If an agent must complete work before the agent can handle the next contact, then ACW is factored into the average handle time. |
|
Interact |
The number of sessions where the user(s) interacted during email conversations. A session includes the point where the agent joins the email conversation to the point where they disconnect. |
Routing
For an overview of routing methods, see Routing and evaluation methods.
| Column | Description | Columns live update |
|---|---|---|
| Bullseye Requested | The number of interactions in which bullseye routing was requested. |
No |
| Bullseye Requested % | The rate of answered interactions in which bullseye routing was requested in comparison to all answered interactions. |
No |
| Bullseye Used | The number of answered interactions in which bullseye routing was used. |
No |
| Bullseye Used % | The rate of interactions in which bullseye routing was used in comparison to all answered interactions. |
No |
|
Conditional Requested |
The number of interactions in which conditional routing was requested. | No |
|
Conditional Requested % |
The rate of answered interactions in which conditional routing routing was requested in comparison to all answered interactions. | No |
|
Conditional Used |
The number of interactions in which conditional routing was used. | No |
|
Conditional Used % |
The rate of interactions in which conditional routing was used in comparison to all answered interactions. | No |
| Direct Requested | The number of interactions in which direct routing was requested. | No |
|
Direct Requested % |
The rate of answered interactions in which direct routing was requested in comparison to all answered interactions. | No |
|
Direct Used |
The number of answered interactions in which direct routing was used. | No |
|
Direct Used % |
The rate of interactions in which direct routing was used in comparison to all answered interactions. | No |
| Last Requested | The number of answered interactions in which last routing was used. See Last agent handling. |
No |
| Last Requested % | The rate of interactions in which last routing was requested in comparison to all answered interactions. See Last agent handling. |
No |
| Last Used | The number of answered interactions in which last routing was used. See Last agent handling. |
No |
| Last Used % | The rate of interactions in which last routing was used in comparison to all answered interactions. See Last agent handling. |
No |
| Manual Used | The number of answered interactions in which manual routing was used. |
No |
| Manual Used % | The rate of interactions in which manual routing was used in comparison to all answered interactions. |
No |
| Predictive Requested | The number of answered interactions in which predictive routing was requested. |
No |
| Predictive Requested % | The rate of interactions in which predictive routing was requested in comparison with all answered interactions. |
No |
| Predictive Used | The number of answered interactions in which predictive routing was used. |
No |
| Predictive Used % | The rate of interactions in which predictive routing was used in comparison with all answered interactions. |
No |
| Preferred Requested | The number of answered interactions in which preferred agent routing was used. |
No |
| Preferred Requested % | The rate of interactions in which preferred agent routing was requested in comparison with all answered interactions. |
No |
| Preferred Used | The number of answered interactions in which preferred agent routing was used. |
No |
| Preferred Used % | The rate of interactions in which preferred agent routing was used in comparison to all answered interactions. |
No |
| Standard Requested | The number of answered interactions in which standard routing was requested. |
No |
| Standard Requested % | The rate of interactions in which standard routing was requested in comparison to all answered interactions. |
No |
| Standard Used | The number of answered interactions in which standard routing was used. |
No |
| Standard Used % | The rate of interactions in which standard routing was used in comparison to all answered interactions. |
No |
Speech and text analytics
| Column | Column Description |
|---|---|
| Avg Sentiment | Average customer sentiment score (-100 to 100) in the specified interval with the provided filters. |
| Negative Sentiment Instances | The number of negative sentiment instances. For more information, see Understand sentiment analysis. |
| Overall Avg Sentiment Score | The average overall sentiment score of the interactions. Calculated by: oSentimentScore.sum / oSentimentScore.count |
| Positive Sentiment Instances | The number of positive sentiment instances. For more information, see Understand sentiment analysis. |
| Sentiment Instances | Number of instances of sentiment in the given interval with the provided filters. |
Email Agent Performance Summary view
Performance
| Column | Description |
|---|---|
| Column | Description |
|
Time in Status |
The amount of time agents have been in their current primary status. |
| Transfer | A measurement of the number of interactions an agent answered in one queue and then transferred. A transfer counts for the queue in which an agent answers the interaction. This measurement is calculated by the number of interactions blind transferred or consult transferred. |
| ASA | The average amount of time an interaction waits in the queue before an agent answers. This metric does not include interactions that agents do not answer. Average Speed of Answer (ASA) is directly associated with the service level and provides insight into the customer service your organization provides. ASA is recorded in the interval in which the agent answered the interaction. Calculated by: Total Answered (tAnswered Sum) / Answered Count (tAnswered Count) Note: Raw values are provided in milliseconds. |
| Transfer % | The number of transfers compared with the total number of interactions answered. Calculated by: (No. of transfers / interactions answered) * 100 |
| Status |
The current primary status of an agent, such as Available, Away, or Busy. |
| Presence | Displays a colored dot related to the agent’s current status. For more information, see Presence, status, and activity indicators overview and Agent presence, status, and activity indicators. |
| Secondary Status |
The current secondary status of an agent. If there is no secondary status, then this column displays the agent’s primary status. |
| Time in Routing Status |
The amount of time agents have been in their current routing status. |
| Routing Status |
The current routing status of an agent. |
| Agent | The full name for the user. |
| ID | Unique system ID for the user. |
Email address configured for the user. |
|
| Reports To | The manager as defined for the user within Genesys Cloud. |
| Location | Location for the user as defined in Genesys Cloud. |
| Title | Title of the user as defined within Genesys Cloud. |
| Department | Department of the user as defined within Genesys Cloud. |
| Adherence | The current adherence status of the user, including In Adherence, Out of Adherence, Unscheduled, Ignored, or Unknown. |
| Scheduled Activity | The activity for which the user is currently scheduled, including On Queue Work, Break, Meal, Meeting, Off Queue Work, Time Off, Training, Unavailable, or Unscheduled. |
| Adherence Duration | The amount of time represented in days, hours, minutes, and seconds, of the adherence exception. |
| Answer | A measurement of the number of assigned ACD interactions answered by an agent in a given period. Answered increments when the agent is the first to connect to the interaction. |
| Handle | The total number of ACD and non-ACD interactions that agents were involved in for the selected media type. Handle increments in the interval in which the interaction ends, after the agent completes any after call work and completes the interaction. |
| Avg Handle | The average amount of time agents spent handling interactions. This calculation includes talk time, hold time, and after-call work. For outbound calls it also includes dialing and contacting time. Calculated by: (cumulative talk time + cumulative hold time + cumulative after-call work + cumulative dialing time + cumulative contacting time) / Number of interactions handled Note: The interactions can span multiple time intervals. For example, a 45-minute call spans two 30-minute intervals. However, metrics are assigned a single timestamp and reported in the interval into which this timestamp falls. The timestamps are assigned based on when the metric calculation is complete.
For instance, handle time will use the timestamp of after call work completion. In the example of a 45-minute call, the handle time falls in the second 30-minute interval because the handle time was calculated at the end of the call when ACW was submitted. |
| Avg Interact | The average number of seconds spent interacting on an email. |
| Avg ACW | The average amount of time agents spent completing after-call work. Calculated by: Total ACW / Interactions with ACW |
| Total Handle | The total amount of time agents spend on an interaction including time spent contacting, time spent dialing, talk time, hold time, and after call work. |
| Total Interact | The total amount of time spent interacting on all the email conversations by the agent, within an interval. |
| Total ACW | The cumulative time spent in after-call work (ACW) on all interactions. After-call work is the work that an agent performs immediately following an interaction. Work may involve keying activity codes, updating customer databases, filling out forms, or initiating outbound contact. As a metric, it indicates the total time an agent takes to finish working on a call. If an agent must complete work before the agent can handle the next contact, then ACW is factored into the average handle time. |
| Error | The number of errors that occurred on conversations. |
| Outbound | This metric represents the number of outbound interactions placed on behalf of queue. |
| Alert – No Answer | The number of times an agent was alerted to a conversation but did not answer the conversation. Note: This metric does not specifically count the number of times an agent was placed in a Not Responding routing status. An agent is transitioned to Not Responding status after a specific alert time threshold for ACD-routed conversations. Alert – No Answer can be incremented for all conversation types for any situation where an alert was not followed by an answer event. |
| Total Alert – No Answer | The total number of seconds Genesys Cloud offered an agent an interaction before the agent declined the interaction or the interaction timed out. |
| Alert | The number of times agents receive an alert for interactions. |
| Total Alert | The total time Genesys Cloud alerts agents before the agent accepts or declines an interaction. |
| Division | Displays the name of a division that an agent or queue belongs to. For more information, see About access control. |
| Min Alert | The minimum amount of time an agent was being alerted. |
| Max Alert | The maximum amount of time an agent was being alerted. |
| Min Alert – No Answer | The minimum amount of time an agent was being alerted without responding to an interaction. |
| Max Alert – No Answer | The maximum amount of time an agent was being alerted without responding to an interaction. |
| Min Handle | The minimum amount of time agents were involved in ACD and non-ACD interactions, including answered interactions, transfers, callbacks, and outbound calls. |
| Max Handle | The maximum amount of time agents were involved in ACD and non-ACD interactions, including answered interactions, transfers, callbacks, and outbound calls. |
| Min Interact | The maximum amount of time spent interacting on an email for the selected interval. |
| Max Interact | The minimum amount of time spent interacting on an email for the selected interval. |
| Min Answer | The minimum amount of time an agent spent answering assigned ACD interactions for the selected interval. |
| Max Answer | The maximum amount of time an agent spent answering assigned ACD interactions for the selected interval. |
| Min ACW | The minimum amount of time spent on after call work for the selected interval. |
| Max ACW | The maximum amount of time spent on after call work for the selected interval. |
| Blind Transfer | The number of interactions an agent answered in one queue and then blind transferred. A blind transfer counts for the queue in which an agent answers the interaction. |
| Blind Transfer % | The percentage of interactions an agent answered in one queue and then blind transferred. |
| Avg ACW Handled | The average time any interaction spent in ACW. This calculation takes into account all interactions handled, not just those that had ACW. Calculated by: Total ACW Time / Number of Interactions Handled |
|
ACW |
The number of times after-call work (ACW) was completed. After-call work is the work that an agent performs immediately following an interaction. Work may involve keying activity codes, updating customer databases, filling out forms, or initiating outbound contact. As a metric, it indicates the total time an agent takes to finish working on a call. If an agent must complete work before the agent can handle the next contact, then ACW is factored into the average handle time. |
|
Interact |
The number of sessions where the user(s) interacted during email conversations. A session includes the point where the agent joins the email conversation to the point where they disconnect. |
| Avg Park | The average amount of time an email was parked by an agent. |
| Max Park | The maximum amount of time an email was parked by an agent. |
| Min Park | The minimum amount of time an email was parked by an agent. |
| Park | The number of emails parked by an agent. |
| Total Park | The total amount of time an email was parked by an agent. |
Routing
For an overview of routing methods, see Routing and evaluation methods.
| Column | Description | Columns live update |
|---|---|---|
| Bullseye Requested | The number of interactions in which bullseye routing was requested. |
No |
| Bullseye Requested % | The rate of answered interactions in which bullseye routing was requested in comparison to all answered interactions. |
No |
| Bullseye Used | The number of answered interactions in which bullseye routing was used. |
No |
| Bullseye Used % | The rate of interactions in which bullseye routing was used in comparison to all answered interactions. |
No |
|
Conditional Requested |
The number of interactions in which conditional routing was requested. | No |
|
Conditional Requested % |
The rate of answered interactions in which conditional routing routing was requested in comparison to all answered interactions. | No |
|
Conditional Used |
The number of interactions in which conditional routing was used. | No |
|
Conditional Used % |
The rate of interactions in which conditional routing was used in comparison to all answered interactions. | No |
| Direct Requested | The number of interactions in which direct routing was requested. | No |
|
Direct Requested % |
The rate of answered interactions in which direct routing was requested in comparison to all answered interactions. | No |
|
Direct Used |
The number of answered interactions in which direct routing was used. | No |
|
Direct Used % |
The rate of interactions in which direct routing was used in comparison to all answered interactions. | No |
| Last Requested | The number of answered interactions in which last routing was used. See Last agent handling. |
No |
| Last Requested % | The rate of interactions in which last routing was requested in comparison to all answered interactions. See Last agent handling. |
No |
| Last Used | The number of answered interactions in which last routing was used. See Last agent handling. |
No |
| Last Used % | The rate of interactions in which last routing was used in comparison to all answered interactions. See Last agent handling. |
No |
| Manual Used | The number of answered interactions in which manual routing was used. |
No |
| Manual Used % | The rate of interactions in which manual routing was used in comparison to all answered interactions. |
No |
| Predictive Requested | The number of answered interactions in which predictive routing was requested. |
No |
| Predictive Requested % | The rate of interactions in which predictive routing was requested in comparison with all answered interactions. |
No |
| Predictive Used | The number of answered interactions in which predictive routing was used. |
No |
| Predictive Used % | The rate of interactions in which predictive routing was used in comparison with all answered interactions. |
No |
| Preferred Requested | The number of answered interactions in which preferred agent routing was used. |
No |
| Preferred Requested % | The rate of interactions in which preferred agent routing was requested in comparison with all answered interactions. |
No |
| Preferred Used | The number of answered interactions in which preferred agent routing was used. |
No |
| Preferred Used % | The rate of interactions in which preferred agent routing was used in comparison to all answered interactions. |
No |
| Standard Requested | The number of answered interactions in which standard routing was requested. |
No |
| Standard Requested % | The rate of interactions in which standard routing was requested in comparison to all answered interactions. |
No |
| Standard Used | The number of answered interactions in which standard routing was used. |
No |
| Standard Used % | The rate of interactions in which standard routing was used in comparison to all answered interactions. |
No |
Speech and text analytics
| Column | Column Description |
|---|---|
| Avg Sentiment | Average customer sentiment score (-100 to 100) in the specified interval with the provided filters. |
| Negative Sentiment Instances | The number of negative sentiment instances. For more information, see Understand sentiment analysis. |
| Overall Avg Sentiment Score | The average overall sentiment score of the interactions. Calculated by: oSentimentScore.sum / oSentimentScore.count |
| Positive Sentiment Instances | The number of positive sentiment instances. For more information, see Understand sentiment analysis. |
| Sentiment Instances | Number of instances of sentiment in the given interval with the provided filters. |
Email Queue Performance Detail view
Performance
| Column | Description |
|---|---|
| Column | Description |
| Answer % | The percentage of offered interactions that an agent answered. Calculated by: (Answered / Offered) * 100 |
| Outbound | This metric represents the number of outbound interactions placed on behalf of queue. |
| Flow-Out | Flow-outs are interactions that enter and leave a queue without getting answered by an agent and without getting disconnected. Flow-outs are an indication of customer service level and queue productivity. High numbers of flow-outs can indicate staffing issues or ineffective agents when used with high handle times (bullseye matching metrics). Flow-outs can include transfers to voicemail, callbacks, and any system-driven events such as in-queue flows that transfer to another queue or external party after a certain amount of time. Flow-outs can also occur if the caller opts to exit out of the queue and return to the IVR. Offered interactions are either flow-out, answered, or abandoned interactions. |
| ASA | The average amount of time an interaction waits in the queue before an agent answers. This metric does not include interactions that agents do not answer. Average Speed of Answer (ASA) is directly associated with the service level and provides insight into the customer service your organization provides. ASA is recorded in the interval in which the agent answered the interaction. Calculated by: Total Answered (tAnswered Sum) / Answered Count (tAnswered Count) Note: Raw values are provided in milliseconds. |
| Service Level % |
Service level target is a contact center performance statistic expressed as “X percent of conversations answered in Y seconds.” For example, a goal of answering 80% of voice calls within 20 seconds provides a service level target of 80/20. You can set the service level target for each media type in a queue. Analytics uses this service level target to calculate whether you are within the service level % defined by your service level agreement (SLA). For more information about setting the service level target, see Create queues or Edit or delete queues. Note: In the performance views that are not queue-specific, the Service Level % is calculated by queue and displayed as a – on the aggregated group row since SLA targets vary by queue. The affected views are DNIS Performance Summary and Skills Performance views. To view individual queue service level %, click the + to expand the row.
The service level % is the percentage of interactions that meet your contact center's service level target. The formula to calculate the service level % is:
Number of Conversations Answered within SLA The numerator is calculated by taking the total answered conversations and subtracting the conversations that were not answered within the SLA threshold. Calculated by: (Answered Count – SLA Violation Count) Total Number of Conversations The Service Level Options configuration determines the denominator. With all the options below unchecked, the denominator is the count of answered conversations.
As the service level calculation depends on an organization’s configured options, the final formula to calculate the service level is:
Notes:
In this view, the service level set for the queue appears as a gray number beside the service level percentage for the interval. If the service level percentage for the interval is lower than the set service level, then the service level percentage is red. |
| Avg Wait | The average amount of time an interaction is in a queue before an agent answers it, before the interaction moves out of the queue, or before the customer abandons the interaction. Calculated by: Total Wait Time / Interactions |
| Handle | The total number of ACD and non-ACD interactions that agents were involved in for the selected media type. Handle increments in the interval in which the interaction ends, after the agent completes any after call work and completes the interaction. |
| Avg Handle |
The average amount of time agents spent handling interactions. This calculation includes talk time, hold time, and after-call work. For outbound calls it also includes dialing and contacting time. Calculated by: (cumulative talk time + cumulative hold time + cumulative after-call work + cumulative dialing time + cumulative contacting time) / Number of interactions handled Note: The interactions can span multiple time intervals. For example, a 45-minute call spans two 30-minute intervals. However, metrics are assigned a single timestamp and reported in the interval into which this timestamp falls. The timestamps are assigned based on when the metric calculation is complete.
For instance, handle time will use the timestamp of after call work completion. In the example of a 45-minute call, the handle time falls in the second 30-minute interval because the handle time was calculated at the end of the call when ACW was submitted. In these views, the Avg Talk, Avg Hold, and Avg ACW columns do not equal the Avg Handle column because only some interactions include holds. This view calculates the average handle column using cumulative counts rather than averages. |
| Avg Interact | The average number of seconds spent interacting on an email. |
| Avg ACW | The average amount of time agents spent completing after-call work. Calculated by: Total ACW / Interactions with ACW |
| Total Handle | The total amount of time agents spend on an interaction including time spent contacting, time spent dialing, talk time, hold time, and after call work. |
| Total Interact | The total amount of time spent interacting on all the email conversations by the agent, within an interval. |
| Transfer | A measurement of the number of interactions an agent answered in one queue and then transferred. A transfer counts for the queue in which an agent answers the interaction. This measurement is calculated by the number of interactions blind transferred or consult transferred. |
| Blind Transfer | The number of interactions an agent answered in one queue and then blind transferred. A blind transfer counts for the queue in which an agent answers the interaction. |
| Total Wait | The total amount of time an interaction is in a queue before an agent answers it, it flows out, or the customer abandons it. Genesys Cloud calculates the wait time in milliseconds. |
| Connection | The number of interactions that initially connected to the contact center in a particular location, such as a queue or IVR. |
| Transfer % | The number of transfers compared with the total number of interactions answered. Calculated by: (No. of transfers / interactions answered) * 100 |
| Max Wait | The maximum amount of time spent waiting in queue for the selected interval. |
| Min Wait | The minimum amount of time spent waiting in queue for the selected interval. |
| Max Interact | The maximum amount of time spent interacting on an email for the selected interval. |
| Min Interact | The minimum amount of time spent interacting on an email for the selected interval. |
| Max ACW | The maximum amount of time spent on after call work for the selected interval. |
| Min ACW | The minimum amount of time spent on after call work for the selected interval. |
| Over SLA | Number of interactions that were over the defined Service Level. |
| Met SLA | Number of interactions that met the defined service level. |
| Error | The number of errors that occurred on the queue conversations. |
| SL % | The service level percentage for the queue. |
| SL Target % | The service level target percentage for the queue. |
| Avg ACW Handled | The average time any interaction spent in ACW. This calculation takes into account all interactions handled, not just those that had ACW. Calculated by: Total ACW Time / Number of Interactions Handled |
|
ACW |
The number of times after-call work (ACW) was completed. After-call work is the work that an agent performs immediately following an interaction. Work may involve keying activity codes, updating customer databases, filling out forms, or initiating outbound contact. As a metric, it indicates the total time an agent takes to finish working on a call. If an agent must complete work before the agent can handle the next contact, then ACW is factored into the average handle time. |
|
Interact |
The number of sessions where the user(s) interacted during email conversations. A session includes the point where the agent joins the email conversation to the point where they disconnect. |
|
Wait |
The number of interactions that waited in the queue. |
|
Avg Flow-Out |
The average amount of time an interaction spends in queue before it flows out. Calculated by: Total Flow Out Time / Count of interactions with flow-outs For more information, see Queues Performance Summary view. |
|
Max Flow-Out |
The maximum amount of time an interaction spends in queue before it flows out. For more information, see Queues Performance Summary view. |
|
Min Flow-Out |
The minimum amount of time an interaction spends in queue before it flows out. For more information, see Queues Performance Summary view. |
|
Avg Park |
The average amount of time an email was parked by an agent. |
|
Interval |
The time period. |
|
Max Park |
The maximum amount of time an email was parked by an agent. |
|
Min Park |
The minimum amount of time an email was parked by an agent. |
|
Offer |
The number of interactions routed into the queue for an agent to answer. Offered interactions are either answered, abandoned, or flow-out interactions. |
|
Park |
The number of emails parked by an agent. |
|
Total Park |
The total amount of time an email was parked by an agent. |
|
Total ACW |
The cumulative time spent in after-call work (ACW) on all interactions. After-call work is the work that an agent performs immediately following an interaction. Work may involve keying activity codes, updating customer databases, filling out forms, or initiating outbound contact. As a metric, it indicates the total time an agent takes to finish working on a call. If an agent must complete work before the agent can handle the next contact, then ACW is factored into the average handle time. |
Routing
For an overview of routing methods, see Routing and evaluation methods.
| Column | Description | Columns live update |
|---|---|---|
| Bullseye Requested | The number of interactions in which bullseye routing was requested. |
No |
| Bullseye Requested % | The rate of answered interactions in which bullseye routing was requested in comparison to all answered interactions. |
No |
| Bullseye Used | The number of answered interactions in which bullseye routing was used. |
No |
| Bullseye Used % | The rate of interactions in which bullseye routing was used in comparison to all answered interactions. |
No |
|
Conditional Requested |
The number of interactions in which conditional routing was requested. | No |
|
Conditional Requested % |
The rate of answered interactions in which conditional routing routing was requested in comparison to all answered interactions. | No |
|
Conditional Used |
The number of interactions in which conditional routing was used. | No |
|
Conditional Used % |
The rate of interactions in which conditional routing was used in comparison to all answered interactions. | No |
| Direct Requested | The number of interactions in which direct routing was requested. | No |
|
Direct Requested % |
The rate of answered interactions in which direct routing was requested in comparison to all answered interactions. | No |
|
Direct Used |
The number of answered interactions in which direct routing was used. | No |
|
Direct Used % |
The rate of interactions in which direct routing was used in comparison to all answered interactions. | No |
| Last Requested | The number of answered interactions in which last routing was used. See Last agent handling. |
No |
| Last Requested % | The rate of interactions in which last routing was requested in comparison to all answered interactions. See Last agent handling. |
No |
| Last Used | The number of answered interactions in which last routing was used. See Last agent handling. |
No |
| Last Used % | The rate of interactions in which last routing was used in comparison to all answered interactions. See Last agent handling. |
No |
| Manual Used | The number of answered interactions in which manual routing was used. |
No |
| Manual Used % | The rate of interactions in which manual routing was used in comparison to all answered interactions. |
No |
| Predictive Requested | The number of answered interactions in which predictive routing was requested. |
No |
| Predictive Requested % | The rate of interactions in which predictive routing was requested in comparison with all answered interactions. |
No |
| Predictive Used | The number of answered interactions in which predictive routing was used. |
No |
| Predictive Used % | The rate of interactions in which predictive routing was used in comparison with all answered interactions. |
No |
| Preferred Requested | The number of answered interactions in which preferred agent routing was used. |
No |
| Preferred Requested % | The rate of interactions in which preferred agent routing was requested in comparison with all answered interactions. |
No |
| Preferred Used | The number of answered interactions in which preferred agent routing was used. |
No |
| Preferred Used % | The rate of interactions in which preferred agent routing was used in comparison to all answered interactions. |
No |
| Standard Requested | The number of answered interactions in which standard routing was requested. |
No |
| Standard Requested % | The rate of interactions in which standard routing was requested in comparison to all answered interactions. |
No |
| Standard Used | The number of answered interactions in which standard routing was used. |
No |
| Standard Used % | The rate of interactions in which standard routing was used in comparison to all answered interactions. |
No |
Speech and text analytics
| Column | Column Description |
|---|---|
| Avg Sentiment | Average customer sentiment score (-100 to 100) in the specified interval with the provided filters. |
| Negative Sentiment Instances | The number of negative sentiment instances. For more information, see Understand sentiment analysis. |
| Overall Avg Sentiment Score | The average overall sentiment score of the interactions. Calculated by: oSentimentScore.sum / oSentimentScore.count |
| Positive Sentiment Instances | The number of positive sentiment instances. For more information, see Understand sentiment analysis. |
| Sentiment Instances | Number of instances of sentiment in the given interval with the provided filters. |
Surveys
| Column | Column Description |
|---|---|
| Response Rate | The number of surveys that customers complete compared with the total number of surveys sent. Surveys sent includes successfully delivered survey invitations and survey invitations that Genesys Cloud attempted to send but could not deliver due to an error, such as an invalid email address or invalid survey form. Calculated by: (Surveys Completed / Surveys Sent) * 100 |
| Sent | The number of surveys sent. This metric includes successfully delivered survey invitations and survey invitations that Genesys Cloud attempted to send but could not deliver due to an error, such as an invalid email address or invalid survey form. |
| In Progress | The number of surveys that customers opened but did not submit. This metric does not include surveys that customers opened but did not submit before the survey expired. |
| Complete | The number of surveys customers have opened and submitted. |
| Survey Abandon | The number of surveys that customers opened but did not submit before the survey expired. |
| Survey Expire | The number of surveys that expired before the customer opened it. |
| Survey Errors | The number of surveys that Genesys Cloud attempted but failed due to an error. The error includes errors in delivery such as an invalid email address, errors that occurred during the Survey Invite Flow, or other errors in the survey creation. |
| Avg Survey Score | The average of completed surveys' percentage scores. The average score does not include NPS. Calculated by (Sum of completed survey percentage scores / number of completed surveys) * 100 |
| Complaint |
The number of errors related to email recipient, system blocking, or identifying the survey sender as spam. |
| Outstanding |
The number of outstanding surveys. Calculated by (Number of surveys sent) – completed – expired – abandoned – bounced – complaints |
| NPS | The Net Promoter ScoreSM (NPS) of completed surveys. The score can range from -100 to 100. Calculated by (Promoters - Detractors) / number of responses) * 100 For more information about Promoters, Detractors, and NPS, see Net Promoter Score web survey question overview. |
| Full response | The number of full survey responses with all required questions that were answered by the customers. |
| Partial Response | The number of partial survey responses with any required questions that were unanswered by the customers. |
| Voice Survey | The number of voice surveys. |
| Web Survey | The number of web surveys. |
| Bounce | The number of times a survey was sent out and returned by the recipient's email server, usually caused by an invalid email address. |
Email Queue Performance Summary view
Performance
| Column | Description |
|---|---|
| Column | Column Description |
| ACW | The number of times after-call work (ACW) was completed. After-call work is the work that an agent performs immediately following an interaction. Work may involve keying activity codes, updating customer databases, filling out forms, or initiating outbound contact. As a metric, it indicates the total time an agent takes to finish working on a call. If an agent must complete work before the agent can handle the next contact, then ACW is factored into the average handle time. |
| Answer % | The percentage of offered interactions that an agent answered. Calculated by: (Answered / Offered) * 100 |
| ASA | The average amount of time an interaction waits in the queue before an agent answers. This metric does not include interactions that agents do not answer. Average Speed of Answer (ASA) is directly associated with the service level and provides insight into the customer service your organization provides. ASA is recorded in the interval in which the agent answered the interaction. Calculated by: Total Answered (tAnswered Sum) / Answered Count (tAnswered Count) Note: Raw values are provided in milliseconds. |
| Avg ACW | The average amount of time agents spent completing after-call work. Calculated by: Total ACW / Interactions with ACW |
| Avg Interact | The average number of seconds spent interacting on an email. |
| Total Park | The total amount of time an email was parked by an agent. |
| Avg ACW Handled | The average time any interaction spent in ACW. This calculation takes into account all interactions handled, not just those that had ACW. Calculated by: Total ACW Time / Number of Interactions Handled |
| Offer | The number of interactions routed into the queue for an agent to answer. Offered interactions are either answered, abandoned, or flow-out interactions. |
| Outbound | This metric represents the number of outbound interactions placed on behalf of queue. |
| Flow-Out | Flow-outs are interactions that enter and leave a queue without getting answered by an agent and without getting disconnected. Flow-outs are an indication of customer service level and queue productivity. High numbers of flow-outs can indicate staffing issues or ineffective agents when used with high handle times (bullseye matching metrics). Flow-outs can include transfers to voicemail, callbacks, and any system-driven events such as in-queue flows that transfer to another queue or external party after a certain amount of time. Flow-outs can also occur if the caller opts to exit out of the queue and return to the IVR. Offered interactions are either flow-out, answered, or abandoned interactions. |
| Service Level % |
Service level target is a contact center performance statistic expressed as “X percent of conversations answered in Y seconds.” For example, a goal of answering 80% of voice calls within 20 seconds provides a service level target of 80/20. You can set the service level target for each media type in a queue. Analytics uses this service level target to calculate whether you are within the service level % defined by your service level agreement (SLA). For more information about setting the service level target, see Create queues or Edit or delete queues. Note: In the performance views that are not queue-specific, the Service Level % is calculated by queue and displayed as a – on the aggregated group row since SLA targets vary by queue. The affected views are DNIS Performance Summary and Skills Performance views. To view individual queue service level %, click the + to expand the row.
The service level % is the percentage of interactions that meet your contact center's service level target. The formula to calculate the service level % is:
Number of Conversations Answered within SLA The numerator is calculated by taking the total answered conversations and subtracting the conversations that were not answered within the SLA threshold. Calculated by: (Answered Count – SLA Violation Count) Total Number of Conversations The Service Level Options configuration determines the denominator. With all the options below unchecked, the denominator is the count of answered conversations.
As the service level calculation depends on an organization’s configured options, the final formula to calculate the service level is:
Notes:
In this view, the service level set for the queue appears as a gray number beside the service level percentage for the interval. If the service level percentage for the interval is lower than the set service level, then the service level percentage is red. |
| Avg Wait | The average amount of time an interaction is in a queue before an agent answers it, before the interaction moves out of the queue, or before the customer abandons the interaction. Calculated by: Total Wait Time / Interactions |
| Handle | The total number of ACD and non-ACD interactions that agents were involved in for the selected media type. Handle increments in the interval in which the interaction ends, after the agent completes any after call work and completes the interaction. |
| Avg Handle |
The average amount of time agents spent handling interactions. This calculation includes talk time, hold time, and after-call work. For outbound calls it also includes dialing and contacting time. Calculated by: (cumulative talk time + cumulative hold time + cumulative after-call work + cumulative dialing time + cumulative contacting time) / Number of interactions handled Note: The interactions can span multiple time intervals. For example, a 45-minute call spans two 30-minute intervals. However, metrics are assigned a single timestamp and reported in the interval into which this timestamp falls. The timestamps are assigned based on when the metric calculation is complete.
For instance, handle time will use the timestamp of after call work completion. In the example of a 45-minute call, the handle time falls in the second 30-minute interval because the handle time was calculated at the end of the call when ACW was submitted. In these views, the Avg Talk, Avg Hold, and Avg ACW columns do not equal the Avg Handle column because only some interactions include holds. This view calculates the average handle column using cumulative counts rather than averages. |
| Total Handle |
The total amount of time agents spend on an interaction including time spent contacting, time spent dialing, talk time, hold time, and after call work. Sometimes, as after-call work overlaps with the talk time or the hold time, this sum of the cumulative metrics represented in Total Handle is not the same as the Handle metric, which eliminates any overlap. |
| Total Interact | The total amount of time spent interacting on all the email conversations by the agent, within an interval. |
| Total ACW | The cumulative time spent in after-call work (ACW) on all interactions. After-call work is the work that an agent performs immediately following an interaction. Work may involve keying activity codes, updating customer databases, filling out forms, or initiating outbound contact. As a metric, it indicates the total time an agent takes to finish working on a call. If an agent must complete work before the agent can handle the next contact, then ACW is factored into the average handle time. |
| Transfer | A measurement of the number of interactions an agent answered in one queue and then transferred. A transfer counts for the queue in which an agent answers the interaction. This measurement is calculated by the number of interactions blind transferred or consult transferred. |
| Blind Transfer | The number of interactions an agent answered in one queue and then blind transferred. A blind transfer counts for the queue in which an agent answers the interaction. |
| Total Wait | The total amount of time an interaction is in a queue before an agent answers it, it flows out, or the customer abandons it. Genesys Cloud calculates the wait time in milliseconds. |
| Division | Displays the name of a division that an agent or queue belongs to. For more information, see About access control. |
| ID | The specific conversation ID for the interaction. |
| Max Park | The maximum amount of time an email was parked by an agent. |
| Min Park | The minimum amount of time an email was parked by an agent. |
| Name | The name of the queue. |
| Park | The number of emails parked by an agent. |
| Avg Park | The average amount of time an email was parked by an agent. |
| Connection | The number of interactions that initially connected to the contact center in a particular location, such as a queue or IVR. |
| Transfer % | The number of transfers compared with the total number of interactions answered. Calculated by: (No. of transfers / interactions answered) * 100 |
| Max Wait | The maximum amount of time spent waiting in queue for the selected interval. |
| Min Wait | The minimum amount of time spent waiting in queue for the selected interval. |
| Max Interact | The maximum amount of time spent interacting on an email for the selected interval. |
| Min Interact | The minimum amount of time spent interacting on an email for the selected interval. |
| Max ACW | The maximum amount of time spent on after call work for the selected interval. |
| Min ACW | The minimum amount of time spent on after call work for the selected interval. |
| Over SLA | Number of interactions that were over the defined Service Level. |
| Met SLA | Number of interactions that met the defined service level. |
| Error | The number of errors that occurred on the queue conversations. |
| SL % | The service level percentage for the queue. |
| SL Target % | The service level target percentage for the queue. |
| Interact | The number of sessions where the user(s) interacted during email conversations. A session includes the point where the agent joins the email conversation to the point where they disconnect. |
|
Wait |
The number of interactions that waited in the queue. |
|
Avg Flow-Out |
The average amount of time an interaction spends in queue before it flows out. Calculated by: Total Flow Out Time / Count of interactions with flow-outs For more information, see Queues Performance Summary view. |
|
Max Flow-Out |
The maximum amount of time an interaction spends in queue before it flows out. For more information, see Queues Performance Summary view. |
|
Min Flow-Out |
The minimum amount of time an interaction spends in queue before it flows out. For more information, see Queues Performance Summary view. |
Routing
For an overview of routing methods, see Routing and evaluation methods.
| Column | Description | Columns live update |
|---|---|---|
| Bullseye Requested | The number of interactions in which bullseye routing was requested. |
No |
| Bullseye Requested % | The rate of answered interactions in which bullseye routing was requested in comparison to all answered interactions. |
No |
| Bullseye Used | The number of answered interactions in which bullseye routing was used. |
No |
| Bullseye Used % | The rate of interactions in which bullseye routing was used in comparison to all answered interactions. |
No |
|
Conditional Requested |
The number of interactions in which conditional routing was requested. | No |
|
Conditional Requested % |
The rate of answered interactions in which conditional routing routing was requested in comparison to all answered interactions. | No |
|
Conditional Used |
The number of interactions in which conditional routing was used. | No |
|
Conditional Used % |
The rate of interactions in which conditional routing was used in comparison to all answered interactions. | No |
| Direct Requested | The number of interactions in which direct routing was requested. | No |
|
Direct Requested % |
The rate of answered interactions in which direct routing was requested in comparison to all answered interactions. | No |
|
Direct Used |
The number of answered interactions in which direct routing was used. | No |
|
Direct Used % |
The rate of interactions in which direct routing was used in comparison to all answered interactions. | No |
| Last Requested | The number of answered interactions in which last routing was used. See Last agent handling. |
No |
| Last Requested % | The rate of interactions in which last routing was requested in comparison to all answered interactions. See Last agent handling. |
No |
| Last Used | The number of answered interactions in which last routing was used. See Last agent handling. |
No |
| Last Used % | The rate of interactions in which last routing was used in comparison to all answered interactions. See Last agent handling. |
No |
| Manual Used | The number of answered interactions in which manual routing was used. |
No |
| Manual Used % | The rate of interactions in which manual routing was used in comparison to all answered interactions. |
No |
| Predictive Requested | The number of answered interactions in which predictive routing was requested. |
No |
| Predictive Requested % | The rate of interactions in which predictive routing was requested in comparison with all answered interactions. |
No |
| Predictive Used | The number of answered interactions in which predictive routing was used. |
No |
| Predictive Used % | The rate of interactions in which predictive routing was used in comparison with all answered interactions. |
No |
| Preferred Requested | The number of answered interactions in which preferred agent routing was used. |
No |
| Preferred Requested % | The rate of interactions in which preferred agent routing was requested in comparison with all answered interactions. |
No |
| Preferred Used | The number of answered interactions in which preferred agent routing was used. |
No |
| Preferred Used % | The rate of interactions in which preferred agent routing was used in comparison to all answered interactions. |
No |
| Standard Requested | The number of answered interactions in which standard routing was requested. |
No |
| Standard Requested % | The rate of interactions in which standard routing was requested in comparison to all answered interactions. |
No |
| Standard Used | The number of answered interactions in which standard routing was used. |
No |
| Standard Used % | The rate of interactions in which standard routing was used in comparison to all answered interactions. |
No |
Speech and text analytics
| Column | Column Description |
|---|---|
| Avg Sentiment | Average customer sentiment score (-100 to 100) in the specified interval with the provided filters. |
| Negative Sentiment Instances | The number of negative sentiment instances. For more information, see Understand sentiment analysis. |
| Overall Avg Sentiment Score | The average overall sentiment score of the interactions. Calculated by: oSentimentScore.sum / oSentimentScore.count |
| Positive Sentiment Instances | The number of positive sentiment instances. For more information, see Understand sentiment analysis. |
| Sentiment Instances | Number of instances of sentiment in the given interval with the provided filters. |
Surveys
| Column | Column Description |
|---|---|
| Response Rate | The number of surveys that customers complete compared with the total number of surveys sent. Surveys sent includes successfully delivered survey invitations and survey invitations that Genesys Cloud attempted to send but could not deliver due to an error, such as an invalid email address or invalid survey form. Calculated by: (Surveys Completed / Surveys Sent) * 100 |
| Sent | The number of surveys sent. This metric includes successfully delivered survey invitations and survey invitations that Genesys Cloud attempted to send but could not deliver due to an error, such as an invalid email address or invalid survey form. |
| In Progress | The number of surveys that customers opened but did not submit. This metric does not include surveys that customers opened but did not submit before the survey expired. |
| Complete | The number of surveys customers have opened and submitted. |
| Survey Abandon | The number of surveys that customers opened but did not submit before the survey expired. |
| Survey Expire | The number of surveys that expired before the customer opened it. |
| Survey Errors | The number of surveys that Genesys Cloud attempted but failed due to an error. The error includes errors in delivery such as an invalid email address, errors that occurred during the Survey Invite Flow, or other errors in the survey creation. |
| Avg Survey Score | The average of completed surveys' percentage scores. The average score does not include NPS. Calculated by (Sum of completed survey percentage scores / number of completed surveys) * 100 |
| Complaint |
The number of errors related to email recipient, system blocking, or identifying the survey sender as spam. |
| Outstanding |
The number of outstanding surveys. Calculated by (Number of surveys sent) – completed – expired – abandoned – bounced – complaints |
| NPS | The Net Promoter ScoreSM (NPS) of completed surveys. The score can range from -100 to 100. Calculated by (Promoters - Detractors) / number of responses) * 100 For more information about Promoters, Detractors, and NPS, see Net Promoter Score web survey question overview. |
| Full response | The number of full survey responses with all required questions that were answered by the customers. |
| Partial Response | The number of partial survey responses with any required questions that were unanswered by the customers. |
| Voice Survey | The number of voice surveys. |
| Web Survey | The number of web surveys. |
| Bounce | The number of times a survey was sent out and returned by the recipient's email server, usually caused by an invalid email address. |
Flow Milestone Detail view
| Column | Description |
|---|---|
| % Total hits | The hits from the row as a percentage of the total number of hits. |
| Hits | The total number of hits of a milestone. |
| Max Hits | The maximum number of hits of a milestone in a single execution. |
| Milestone | The name of the milestone. |
| Min Hits | The minimum number of hits of a milestone in a single execution. |
| Repeated | The number of times a milestone was hit more than once in a single execution. |
Flow Milestone Interval Detail view
| Column | Description |
|---|---|
| % Total hits | The hits from the row as a percentage of the total number of hits. |
| Hits | The total number of hits of a milestone. |
| Max Hits | The maximum number of hits of a milestone in a single execution. |
| Interval | The start date or time of the interval for the row. |
| Min Hits | The minimum number of hits of a milestone in a single execution. |
| Repeated | The number of times a milestone was hit more than once in a single execution. |
Flow Outcomes Detail view
The result of an outcome resets anytime an interaction encounters the same outcome again, even if the outcome was originally successful. The system only tracks and displays the last result of an outcome.
If the interaction ends without encountering a successful result, then the system considers the outcome started but incomplete. Outcomes that are incomplete automatically have a failure result.
| Column | Description |
|---|---|
| Attempts | The number of times that an outcome occurred. |
| Avg Duration | The average amount of time that a call spent in a flow and flow outcome. |
| Avg Milestone | The average number of milestones per flow and flow outcome. |
| Failure | The number of flow outcomes that were failures. Includes the percentage of failure outcomes compared with the total number of outcome attempts. |
| Max Duration | The longest amount of time that a call spent in a flow and flow outcome. |
| Milestones | The total number of Milestones. |
| Min Duration | The shortest amount of time that a call spent in a flow and flow outcome. |
| Outcome | The name of the flow outcome. For more information about flow outcomes, see Add a flow outcome. |
| Success | The number of flow outcomes that were success. Includes the percentage of success outcomes compared with the total number of outcome attempts. |
| Total Duration | The total amount of time that calls spent in a flow and flow outcome. |
Flow Outcomes Interval Detail view
The result of an outcome resets anytime an interaction encounters the same outcome again, even if the outcome was originally successful. The system only tracks and displays the last result of an outcome.
If the interaction ends without encountering a successful result, then the system considers the outcome started but incomplete. Outcomes that are incomplete automatically have a failure result.
| Column | Description |
|---|---|
| Attempts | The number of times that an outcome occurred. |
| Avg Duration | The average amount of time that a call spent in a flow and flow outcome. |
| Avg Milestones | The average number of milestones per flow and flow outcome. |
| Failure | The number of flow outcomes that were failures. Includes the percentage of failure outcomes compared with the total number of outcome attempts. |
| Interval | The time interval for the row. The interval for each row depends on the date filter settings. For example, if you set the date filter to a day, then 30-minute intervals display for each row. |
| Max Duration | The longest amount of time that a call spent in a flow and flow outcome. |
| Milestones | The total number of Milestones. |
| Min Duration | The shortest amount of time that a call spent in a flow and flow outcome. |
| Success | The number of flow outcomes that were success. Includes the percentage of success outcomes compared with the total number of outcome attempts. |
| Total Duration | The total amount of time that calls spent in a flow and flow outcome. |
Flow Outcomes Summary view
The result of an outcome resets anytime an interaction encounters the same outcome again, even if the outcome was originally successful. The system only tracks and displays the last result of an outcome.
If the interaction ends without encountering a successful result, then the system considers the outcome started but incomplete. Outcomes that are incomplete automatically have a failure result.
| Column | Description |
|---|---|
| Attempts | The number of times that an outcome occurred. |
| Avg Duration | The average amount of time that a call spent in a flow and flow outcome. |
| Avg Milestones | The average number of milestones per flow and flow outcome. |
| Failure | The number of flow outcomes that were failures. Includes the percentage of failure outcomes compared with the total number of outcome attempts. |
| Max Duration | The longest amount of time that a call spent in a flow and flow outcome. |
| Milestones | The total number of Milestones. |
| Min Duration | The shortest amount of time that a call spent in a flow and flow outcome. |
| Outcome | The name of the flow outcome. For more information about flow outcomes, see Add a flow outcome. |
| Success % | The number of flow outcomes that were success. Includes the percentage of success outcomes compared with the total number of outcome attempts. |
| Total Duration | The total amount of time that calls spent in a flow and flow outcome. |
Flow Topics Detail view
If you use the date filter to show the current date, then these columns show current data. If you use the date filter to show a past date, then these columns display historical data.
To add a column for a specific topic or for a topic based on a specific dialect, click and type the topic name or dialect name in the field provided at the bottom of the column list. If you enter a dialect name, the topic list only contains topics associated with the specific dialect. From the list that appears, select the topic that you want to add to the view and click Add Columns.
| Column | Description |
|---|---|
| Topic | The name of the speech and text analytics topic. |
| Interactions | The number of agent communications in which the topic was detected. |
| Interactions % | The percentage of agent communications in which the topic was detected out of the total number of communications the agent handled. |
| Dialect | The dialect the topic was created for. |
| Participant | The participant the topic is targeting. The values can be internal (for example, IVR, agent), or external (for example, customer). |
| Average Sentiment Score | The average sentiment score of interactions. |
| Negative Interactions | The number of interactions during which the average sentiment is < -20. |
| Negative Interactions % | The percent of all interactions that have an overall negative sentiment score (< -20). |
| Neutral Interactions | The number of interactions during which the average sentiment is >= -20 and < +20. |
| Neutral Interactions % | The percent of all interactions that have an overall neutral sentiment score (>= -20 and < +20). |
| Positive Interactions | The number of interactions during which the average sentiment is >= +20. |
| Positive Interactions % | The percent of all interactions that have an overall positive sentiment score (>= +20). |
| Avg Agent Talk | The average agent talk time. |
| Avg Agent Talk % | The average agent talk time as a percentage of interactions. |
| Avg Customer Talk | The average customer talk time. |
| Avg Customer Talk % | The average customer talking time as a percentage of interactions. |
| Avg Hold/Music | The average of hold time and music time across interactions. |
| Avg Hold/Music % | The average hold and music time as a percentage of interactions. |
| Avg Overtalk | The average overtalk time across interactions, where both the agent and customer talk at the same time. |
| Avg Overtalk % | The average overtalk time as a percentage of interactions, where both the agent and customer talk at the same time. |
| Avg Silence | The average silent time across interactions. |
| Avg Silence % | The average silent time as a percentage of interactions. |
| Avg Talk and Silence | The average of both the talking time and silent time. |
| Overtalk Instances | The number of instances of overtalk time, where both the agent and customer talk at the same time. |
| Sentiment | Shows the spread of sentiment for the topics shown. |
Flow Topics Summary view
If you use the date filter to show the current date, then these columns show current data. If you use the date filter to show a past date, then these columns display historical data.
To add a column for a specific topic or for a topic based on a specific dialect, click and type the topic name or dialect name in the field provided at the bottom of the column list. If you enter a dialect name, the topic list only contains topics associated with the specific dialect. From the list that appears, select the topic that you want to add to the view and click Add Columns.
| Column | Description |
|---|---|
| Flow | The name of the flow. Expand the flow row to see the flow version. |
| Entries | The total number of times calls enter the flow or flow version. A call can enter a flow multiple times. |
| Avg Flow | The average amount of time that an entry spent in the flow. |
| Interactions Analyzed | The number of interactions transcribed and/or analyzed by speech and text analytics for each individual agent. |
| <Topic name> | The selected topics and the number of interactions analyzed for each. |
| No Topics Detected | The number of interactions without a topic. |
| Average Sentiment Score | The average sentiment score of interactions. |
| Negative Interactions | The number of interactions during which the average sentiment is < -20. |
| Negative Interactions % | The percent of all interactions that have an overall negative sentiment score (< -20). |
| Neutral Interactions | The number of interactions during which the average sentiment is >= -20 and < +20. |
| Neutral Interactions % | The percent of all interactions that have an overall neutral sentiment score (>= -20 and < +20). |
| Positive Interactions | The number of interactions during which the average sentiment is >= +20. |
| Positive Interactions % | The percent of all interactions that have an overall positive sentiment score (>= +20). |
| Avg Agent Talk | The average agent talk time. |
| Avg Agent Talk % | The average agent talk time as a percentage of interactions. |
| Avg Customer Talk | The average customer talk time. |
| Avg Customer Talk % | The average customer talking time as a percentage of interactions. |
| Avg Hold/Music | The average of hold time and music time across interactions. |
| Avg Hold/Music % | The average hold and music time as a percentage of interactions. |
| Avg Overtalk | The average overtalk time across interactions, where both the agent and customer talk at the same time. |
| Avg Overtalk % | The average overtalk time as a percentage of interactions, where both the agent and customer talk at the same time. |
| Avg Silence | The average silent time across interactions. |
| Avg Silence % | The average silent time as a percentage of interactions. |
| Avg Talk and Silence | The average of both the talking time and silent time. |
| Overtalk Instances | The number of instances of overtalk time, where both the agent and customer talk at the same time. |
| Sentiment | Shows the spread of sentiment for the topics shown. |
Flows Performance Detail view
Flow
| Column | Description |
|---|---|
| Avg Flow | The average amount of time that an entry spent in the flow. |
| Avg Milestones | The average number of milestones per flow and flow outcome. |
| Entries | The total number of times that calls enter the flow or flow version. A call can enter a flow multiple times. |
| Interval | The time period. |
| Max Flow | The longest amount of time that an entry spent in the flow. |
| Milestones | The total number of Milestones. |
| Total Flow | The total time entries spent in the flow. |
Disconnects
| Column | Description |
|---|---|
| Avg Disconnect | The average amount of time until an entry disconnected in a flow. |
| Customer Disconnect | The number of times customers disconnected in a flow, including the percentage of customer disconnects compared with the disconnect count. |
| Customer Short Disconnect | The number of times customers disconnected in a flow before a short disconnect time. Includes the percentage of customer short disconnects compared with the disconnect count. The default short disconnect time is less than 10 seconds, though administrators can set the short disconnect time to any threshold they want. For more information, see the Configure analytics settings section in Configure contact center analytics options. |
| Disconnect | The number of entries that disconnected in the flow, including the percentage of entries that disconnected compared with the total number of entries. |
| Flow Disconnect | The number of times a flow disconnected entries, including the percentage of flow disconnects compared with the total number of disconnects. |
| Max Disconnect | The longest amount of time that an entry spent in the flow before disconnecting. |
| System Error Disconnect | The number of times entries disconnected in a flow due to a system error. This column includes the percentage of system error disconnects compared with the total number of disconnects. |
| Total Disconnect | The total amount of time an entry spent in a flow until it disconnected. |
Exits
| Column | Description |
|---|---|
| ACD Exit | The number of times an entry exited a flow to an ACD queue. Includes the percentage of ACD exits compared with the total number of exits. |
| ACD Voicemail Exit | The number of times an entry exited a flow to an ACD voicemail. Includes the percentage of ACD voicemail exits compared with the total number of exits. |
| Avg Exit | The average amount of time that an entry spent in a flow before exiting. |
| Exit | The number of entries that exited the flow to another destination, such as an ACD queue, ACD voicemail, or user. Includes the percentage of exits compared with the total number of entries. |
| Flow Exit | The number of times an entry exited a flow to another flow. Includes the percentage of flow exits compared with the total number of exits. |
| Group Exit | The number of times an entry exited a flow to a group. Includes the percentage of group exits compared with the total number of exits. |
| Group Voicemail Exit | The number of times an entry exited a flow to a group voicemail. Includes the percentage of group voicemail exits compared with the total number of exits. |
| Max Exit | The longest amount of time that an entry spent in the flow before exiting. |
| Number Exit | The number of times an entry exited a flow to a number. Includes the percentage of number exits compared with the total number of exits. |
| Secure Flow Exit | The number of times an entry exited a flow to a secure flow. Includes the percentage of secure flow exits compared with the total number of exits. |
| Total Exit | The total amount of time an entry spent in a flow until it exited the flow to another destination, such as an ACD queue, ACD voicemail, or user. |
| User Exit | The number of times an entry exited a flow to a user. Includes the percentage of user exits compared with the total number of exits. |
| User Voicemail Exit | The number of times an entry exited a flow to a user's voicemail. Includes the percentage of user voicemail exits compared with the total number of exits. |
Outcomes
The result of an outcome resets anytime an interaction encounters the same outcome again, even if the outcome was originally successful. The system only tracks and displays the last result of an outcome.
If the interaction ends without encountering a successful result, then the system considers the outcome started but incomplete. Outcomes that are incomplete automatically have a failure result.
| Column | Description |
|---|---|
| Avg Outcomes | The average number of flow outcomes per entries into the flow. Calculated by: number of flow outcomes / number of entries |
| Failure | The number of flow outcomes that were failures. Includes the percentage of failure outcomes compared with the total number of outcomes. |
| Outcome | The number of flow outcomes. |
| Success | The number of flow outcomes that were success. Includes the percentage of success outcomes compared with the total number of outcomes. |
Speech and text analytics
| Column | Column Description |
|---|---|
| Avg Sentiment | Average customer sentiment score (-100 to 100) in the specified interval with the provided filters. |
| Negative Sentiment Instances | The number of negative sentiment instances. For more information, see Understand sentiment analysis. |
| Overall Avg Sentiment Score | The average overall sentiment score of the interactions. Calculated by: oSentimentScore.sum / oSentimentScore.count |
| Positive Sentiment Instances | The number of positive sentiment instances. For more information, see Understand sentiment analysis. |
| Sentiment Instances | Number of instances of sentiment in the given interval with the provided filters. |
Flows Performance Summary view
Flow
| Column | Description |
|---|---|
| Avg Flow | The average amount of time that an entry spent in the flow. |
| Avg Milestones | The average number of milestones per flow and flow outcome. |
| Entries | The total number of times that calls enter the flow or flow version. A call can enter a flow multiple times. |
| Flow | The name of the flow. If you have the flow row expanded, this column also shows the flow version. |
| Max Flow | The longest amount of time that an entry spent in the flow. |
| Milestones | The total number of Milestones. |
| Total Flow | The total time entries spent in the flow. |
| Type | The type of flow: inbound call, outbound call, or secure call. |
Disconnects
| Column | Description |
|---|---|
| Avg Disconnect | The average amount of time until an entry disconnected in a flow. |
| Customer Disconnect | The number of times customers disconnected in a flow, including the percentage of customer disconnects compared with the disconnect count. |
| Customer Short Disconnect | The number of times customers disconnected in a flow before a short disconnect time. Includes the percentage of customer short disconnects compared with the disconnect count. The default short disconnect time is less than 10 seconds, though administrators can set the short disconnect time to any threshold they want. For more information, see the Configure analytics settings section in Configure contact center analytics options. |
| Disconnect | The number of entries that disconnected in the flow, including the percentage of entries that disconnected compared with the total number of entries. |
| Flow Disconnect | The number of times a flow disconnected entries, including the percentage of flow disconnects compared with the total number of disconnects. |
| Max Disconnect | The longest amount of time that an entry spent in the flow before disconnecting. |
| System Error Disconnect | The number of times entries disconnected in a flow due to a system error. This column includes the percentage of system error disconnects compared with the total number of disconnects. |
| Total Disconnect | The total amount of time an entry spent in a flow until it disconnected. |
Exits
| Column | Description |
|---|---|
| ACD Exit | The number of times an entry exited a flow to an ACD queue. Includes the percentage of ACD exits compared with the total number of exits. |
| ACD Voicemail Exit | The number of times an entry exited a flow to an ACD voicemail. Includes the percentage of ACD voicemail exits compared with the total number of exits. |
| Avg Exit | The average amount of time that an entry spent in a flow before exiting. |
| Exit | The number of entries that exited the flow to another destination, such as an ACD queue, ACD voicemail, or user. Includes the percentage of exits compared with the total number of entries. |
| Flow Exit | The number of times an entry exited a flow to another flow. Includes the percentage of flow exits compared with the total number of exits. |
| Group Exit | The number of times an entry exited a flow to a group. Includes the percentage of group exits compared with the total number of exits. |
| Group Voicemail Exit | The number of times an entry exited a flow to a group voicemail. Includes the percentage of group voicemail exits compared with the total number of exits. |
| Max Exit | The longest amount of time that an entry spent in the flow before exiting. |
| Number Exit | The number of times an entry exited a flow to a number. Includes the percentage of number exits compared with the total number of exits. |
| Secure Flow Exit | The number of times an entry exited a flow to a secure flow. Includes the percentage of secure flow exits compared with the total number of exits. |
| Total Exit | The total amount of time an entry spent in a flow until it exited the flow to another destination, such as an ACD queue, ACD voicemail, or user. |
| User Exit | The number of times an entry exited a flow to a user. Includes the percentage of user exits compared with the total number of exits. |
| User Voicemail Exit | The number of times an entry exited a flow to a user's voicemail. Includes the percentage of user voicemail exits compared with the total number of exits. |
Outcomes
The result of an outcome resets anytime an interaction encounters the same outcome again, even if the outcome was originally successful. The system only tracks and displays the last result of an outcome.
If the interaction ends without encountering a successful result, then the system considers the outcome started but incomplete. Outcomes that are incomplete automatically have a failure result.
| Column | Description |
|---|---|
| Avg Outcomes | The average number of flow outcomes per entries into the flow. Calculated by: number of flow outcomes / number of entries |
| Failure | The number of flow outcomes that were failures. Includes the percentage of failure outcomes compared with the total number of outcomes. |
| Outcome | The number of flow outcomes. |
| Success | The number of flow outcomes that were success. Includes the percentage of success outcomes compared with the total number of outcomes. |
Speech and text analytics
| Column | Column Description |
|---|---|
| Avg Sentiment | Average customer sentiment score (-100 to 100) in the specified interval with the provided filters. |
| Negative Sentiment Instances | The number of negative sentiment instances. For more information, see Understand sentiment analysis. |
| Overall Avg Sentiment Score | The average overall sentiment score of the interactions. Calculated by: oSentimentScore.sum / oSentimentScore.count |
| Positive Sentiment Instances | The number of positive sentiment instances. For more information, see Understand sentiment analysis. |
| Sentiment Instances | Number of instances of sentiment in the given interval with the provided filters. |
Interactions view
Evaluations
| Column | Description |
|---|---|
| Column | Description |
| Evaluated Agent | A comma-separated list of names of evaluated agents for any associated evaluations. |
| Evaluation Assignee | A comma-separated list of names of evaluation assignees for the associated evaluations. |
| Evaluation Created | Displays whether the interaction has an evaluation associated with it. |
| Evaluation Critical Score | The status and value of the evaluation critical score. See Evaluation scoring. |
| Evaluation Score | The score for any associated evaluations. |
| Evaluation Status | The status for any associated evaluations. |
| Evaluator | A comma-separated list of names of evaluators for the associated evaluations. |
External Contact
| Column | Description |
|---|---|
| Column | Description |
| External Contact | Displays the first and last name of the contact. |
| External Organization | Displays the organization name. |
Flows
| Column | Description |
|---|---|
| Column | Description |
| All Flow Disconnect | The total number of times a flow disconnected entries, including: Customer Disconnects, Flow Disconnects, and System Error Disconnects. |
| Customer Disconnect | The number of times customers disconnected in a flow, including the percentage of customer disconnects compared with the disconnect count. |
| Customer Short Disconnect | The number of times customers disconnected in a flow before a short disconnect time. Includes the percentage of customer short disconnects compared with the disconnect count. The default short disconnect time is less than 10 seconds, though administrators can set the short disconnect time to any threshold they want. For more information, see the Configure analytics settings section in Configure contact center analytics options. |
| Failed Outcomes | Displays a list of failed flow outcomes for the interaction. |
| Flow | The name of the flow that the interaction used. |
| Flow Disconnect | The number of times a flow disconnected entries, including the percentage of flow disconnects compared with the total number of disconnects. |
| Flow Exit | The number of times an entry exited a flow to another flow. Includes the percentage of flow exits compared with the total number of exits. |
| Incomplete Outcomes | Displays a list of incomplete flow outcomes for the interaction. |
| Outcome Attempts | The number of flow outcomes in the interaction. |
| Outcome Failure | The number of flow outcomes that were failures. Includes the percentage of failure outcomes compared with the total number of outcomes. |
| Outcome Success | The number of flow outcomes that were success. Includes the percentage of success outcomes compared with the total number of outcomes. |
| Successful Outcomes | Displays a list of successful flow outcomes for the interaction. |
| System Error Disconnect | The number of times entries disconnected in a flow due to a system error. This column includes the percentage of system error disconnects compared with the total number of disconnects. |
Interactions
| Column | Description |
|---|---|
| Column | Description |
| Media Type | The type of media used. |
| Inbound Audio | The number of inbound audio or voice messages received from a customer. Notes: Since messaging is asynchronous, in rare instances, when an agent ends an interaction while an end customer finishes recording and sending a voice note, the last audio file attachment or voice note is not considered for analytics. The audio attachment of the conversation remains intact and is preserved as part of the conversation. There is no data loss. The agent still receives and views the voice note. You can see the impact only in the count of the inbound audio metric. The inbound audio metric can be undercounted. |
| Outbound Audio | The number of outbound audio or voice messages sent by an agent. |
| MOS | The estimated average Mean Opinion Score (MOS) for the voice interaction among all the audio streams within the conversation. MOS is a measure of audio quality at specific measurement points of voice interaction. Potential measurement points include premises-based and cloud-based Edge devices. The measurement is based on codec type, average jitter, latency, and packet loss. Genesys Cloud displays the lowest MOS for each communication that occurs during the whole call. MOS ranges from 1 (bad) to 5 (excellent). Scores below 3.5 indicate unacceptable quality, and scores above 4.3 indicate high quality. |
| Media | The total number of inbound and outbound media for an interaction. |
| Fax | Displays Yes if a fax was present during the interaction. Displays No if a fax was not present during the interaction. |
| Group Ring | Displays the group name for the voice interactions alerted via group ring. |
| Users | The internal users alerted or involved. |
| Screen Recorded | Yes indicates that the conversation was initially screen recorded. It does not consider whether the customer's policies retained it. No indicates that the conversation was not screen recorded. |
| Remote | Information about the external participants. |
| Date | The date the interaction started. |
| Conversation Duration |
The length of the interaction. Calculated by: (Conversation End – Conversation Start) |
| Direction | Displays whether the interaction was inbound, outbound, or inbound/outbound. |
| Initial Direction | Displays whether the interaction started as inbound or outbound. |
| ANI | The number of the person who dialed. |
| DNIS | The original number dialed for the interaction. |
| Queue | The associated queues. |
| Wrap-up | The wrap-up code selected by the agent. |
| Transferred | Indicates interactions that were transferred. A transfer counts for the queue in which an agent answers the interaction. |
| Abandoned | Displays whether a customer abandoned the interaction or not. |
| Abandoned in Queue | The name of the queue in which the Abandon occurred. |
| Agent Assist | Displays whether an interaction had Agent Assist or not. |
| To | The email address or SMS number that the interaction is sent to. This field cannot have more than 10 email addresses.The maximum number of recipients displayed in the To field is 10. |
| From | The email address or SMS number from which the interaction is sent. |
| Email CC | The email addresses to which a copy of the email is sent to. This field cannot have more than 10 email addresses. The maximum number of recipients displayed in the CC field is 10. |
| Email BCC | The email addresses to which a copy of the email is sent to, but that name is not visible to other recipients of the message. This field cannot have more than 10 email addresses. The maximum number of recipients displayed in the BCC field is 10. |
| Flagged | Indicates calls flagged for voice quality issues. For more information about flagging calls, see Flag a problematic voice interaction or Flag a problematic phone call. |
| Wrap-up Notes | Whether an agent wrote a wrap-up note or not. If the agent wrote a note, a preview of the note displays when you hover over the column. |
| Blind Transferred | Displays whether the interaction had a blind transfer. |
| Barged-in | Indicates whether a supervisor barged into the conversation. |
| Cleared by Customer | Indicates whether the conversation was cleared by the customer. |
| Coached | Indicates whether a supervisor coached on the conversation. |
| Co-browse | Displays whether the interaction had a co-browse session. |
| Consulted | Displays whether the interaction had a consult. |
| Consult Transferred | Displays whether the interaction had a consult transfer. |
| Conversation ID | The specific conversation ID for the interaction. |
| Division | Displays the divisions associated with the interaction. See About access control. |
| End Date | The time and date the interaction ended. This column is blank if the interaction is still in progress. |
| Message Type | The ACD message type used. |
| Non-ACD | Displays whether the interaction involved ACD. |
| Recording | Yes indicates that the conversation was initially recorded at the external trunk by the Edge. It does not consider whether the customer's policies actually retained it. No indicates that the conversation was not recorded at the external trunk by the Edge. N/A indicates a digital interaction. |
| Screen Share | Displays whether the interaction contains a screen share session. |
| SIP Call ID | Displays the globally unique identifier embedded in all SIP requests and responses for the interaction. |
| Users – Alerted | The agents Genesys Cloud alerted for the interaction. |
| Users – Interacted | The users who actually interacted during the interaction. |
| Voicemail | Displays whether the interaction has voicemail. Includes personal and queue voicemail. |
| Session DNIS | Any DNIS number dialed during the interaction, including the original DNIS number. |
| Inbound Media | The count of inbound media for an interaction. |
| Has Media | Indicates when message-type conversations have media (images, files, and so on) attached. |
| Provider | The source provider for the conversation. For example, Genesys Cloud EMAIL, Edge, and so on. |
| Emails Sent | Count of the number of emails sent by an agent, including Reply All and Forward. |
| Monitored | Whether the interaction was monitored. |
| First Queue | First queueID in the conversation, formatted as name. |
| Last Wrap-Up | The last wrap-up code used on the conversation. |
| Disconnect Type | The reason the interaction got disconnected.
|
| Subject | First instance of an email subject in the conversation. |
| Flow-Out Type | Shows the type of flowout for a conversation that was a flowout from a queue. |
| Error Code | The name of the error code for the interaction. For more information, see Station errors and Error codes. |
| Outbound Media | The number of outbound media for an interaction. |
| Users – Not Responding | The agents who did not answer the interaction, and the agent may have transitioned to Not Responding. |
| Authenticated | Yes for an authenticated web messaging interaction, No for a web messaging interaction that is not authenticated, or N/A if not a web messaging interaction. |
| External Tag | Displays the external tag that is attached to the conversation record. Note: This data is not available for web chat interactions. |
| Parked | Displays if the interaction has been parked. |
| Delivery Status | The status of the attempted delivery of email, SMS, and WhatsApp messages. The Email delivery status is available for the agentless emails sent via the email campaigns or Agentless Email Notification API. The SMS delivery status is available for all outbound SMS messages including agentless and agent-sent SMS messages. The WhatsApp delivery Status is available for all inbound and outbound WhatsApp messages, including agentless and agent-sent WhatsApp messages. Supported Delivery Status metrics for email and SMS messages include:
Supported Delivery Status metrics for WhatsApp messages include:
|
| Delivery Status Details | Additional details about the delivery, including engagement metrics. For more information, see SMS delivery receipts, Email delivery receipts, and WhatsApp delivery receipts. |
| Conversation Initiator | Displays interactions initiated by a selected initiator (external, user, workflow, customer, or agent). |
| Customer Participation | Displays email and message interactions during which a customer participated, or a customer did not participate. |
| Social Classification | Displays the type of social listening data such as Public or Private. Lists one value for each interaction. The social listening data is classified as public or private based on the type of first conversation received. For example:
|
Journey
| Column | Description |
|---|---|
| Column | Description |
| Has Customer Journey Data | Displays whether an interaction has Predictive Engagement customer journey data associated with it. |
| Proactive | Displays whether Predictive Engagement offered a chat during a customer’s website visit based on the Predictive Engagement action map settings. |
Metrics
| Column | Description |
|---|---|
| Column | Description |
| Alert Segments | The number of alerts. |
| Avg Agent Response | The average time the agent takes to turn the conversation back to the customer. Calculated by (total average agent response time / total number of agent chat sessions). |
| Messages | The total number of individual messages exchanged during a conversation. This number includes both the inbound and outbound messages sent by both the customer and the agent. |
| Avg Customer Response | The average time the customer takes to turn the conversation back to the agent. Calculated by (total average customer response time / total number of customer chat sessions). |
| Total First Response | The total amount of time the agents take to send their first message after connecting to a chat. Calculated by the total duration between the agent's session connecting and the agent's first message sent. |
| Message Turns | The total number of times the conversation turns from one participant to another, that is, a complete communication where one person sends one or more messages and the other responds. |
| Avg Time to First Response | The average time the agent takes to send a message once they connect to the conversation. |
| Total First Engagement | The time the customer takes to receive an engagement from an agent. It is determined from the time difference between the first customer message at the beginning of the chat and the first message that they received from an agent. Messages from the bots are not considered for calculation. |
| Avg Time to First Engagement | The average time it takes for a customer to receive an engagement from an agent. Calculated by (the total duration between the customer's first message and the first agent response / the number of first engagements). Messages from the bots are not considered for calculation. |
| Avg Message Turns | The average amount of the back and forth messages per conversation session. Calculated by (the total number of message turns / the total count of number of message turns). |
| Inbound Messages | The number of individual messages exchanged during a conversation where the session’s direction is inbound. It includes all messages sent by both the customer and the agent. |
| Outbound Messages | The number of individual messages exchanged during a conversation where the session’s direction is outbound. It includes all messages sent by both the customer and the agent. |
| Inbound SMS/MMS Segments | The number of message segments based on their segment count. |
| Outbound SMS/MMS Segments | The number of message segments based on their segment count. |
| Agentless Emails | The number of emails sent by a campaign excluding the emails sent by an agent. |
| Blind Transfers | The number of interactions an agent answered in one queue and then blind transferred. A blind transfer counts for the queue in which an agent answers the interaction. |
|
Callback – Time to first connect |
The amount of time between the start of the callback ACD and the start of the first interaction segment on the voice channel. Note: This metric tracks the time from ACD to agent connect. If a callback is directly transferred from one agent to another agent, the callback is not associated with that ACD queue, and the time to connect is not calculated. |
|
Callback – Time to first dial |
The amount of time between the start of the callback ACD and the start of the first dialing segment on the voice channel. Note: This metric tracks the time from ACD to agent dial. If a callback is directly transferred from one agent to another agent, the callback is not associated with that ACD queue, and the time to dial is not calculated. |
| Consults | The number of interactions an agent answered and then consulted with another participant with or without fully transferring the interaction. A consult counts for the queue in which an agent answers the interaction, even if they consult with another queue. |
| Consult Transfers | The number of call interactions an agent answered in one queue and then consult transferred, meaning they connected with a person or queue before transferring the call. A consult transfer counts for the queue in which an agent answers the interaction. See Consult transfer a call. |
| Contacting Segments | The number of times during an interaction where the system was connecting to the agent’s phone before dialing out. |
| Dialing Segments | The number of times during an interaction that the system dials out. |
| Hold Segments | The number of times the agent places the customer on hold. |
| IVR Segments | The number of times the interaction enters an IVR. |
| Queue Segments | The number of times an interaction enters a queue. For example, if an agent accepts an interaction in queue A, transfers it to queue B, and then an agent transfers the interaction back to queue A, then Queue Segments equal 3. |
| Talk Segments | The number of times an agent and customer talk. For example, in an interaction where an agent accepts an interaction, talks to the customer, places the customer on hold, and then talks the customer again, the Talk Segment equals 2. |
| Total ACW | The cumulative time spent in after-call work (ACW) on all interactions. After-call work is the work that an agent performs immediately following an interaction. Work may involve keying activity codes, updating customer databases, filling out forms, or initiating outbound contact. As a metric, it indicates the total time an agent takes to finish working on a call. If an agent must complete work before the agent can handle the next contact, then ACW is factored into the average handle time. |
| Total Alert | The total time Genesys Cloud alerts agents before the agent accepts or declines an interaction. |
| Total Contacting | The total time an interaction spent connecting to the agent’s phone before dialing out. |
| Total Dialing | The total time spent dialing out. |
| Total Handle | The total amount of time agents spend on an interaction including time spent contacting, time spent dialing, talk time, hold time, and after call work. |
| Total Hold | The total amount of time the customer was on hold. |
| Total IVR | The total amount of time spent in IVR. |
| Total Queue | The amount of time the interaction spent waiting on an Automatic Call Distributor before connecting to an agent. |
| Total Talk |
The total amount of time the agent spends talking to the customer. For example, in an interaction where an agent accepts an interaction, talks to the customer for two minutes, places the customer on hold for one minute, and then talks to the customer again for two minutes, the Total Talk equals 4 minutes. Note: The total Talk times for Callbacks currently include both the agents’ Callback session and agents’ Call session, which results in an inflated time. For more information on callback analytics improvements, see Callback analytics improvements. |
| Transfers | A measurement of the number of interactions an agent answered in one queue and then transferred. A transfer counts for the queue in which an agent answers the interaction. This measurement is calculated by the number of interactions blind transferred or consult transferred. |
| Time to Abandon | The duration of time until the conversation was abandoned. |
| Total Barge-In | Total time spent on the interaction after barging into the conversation. |
| Total Coaching | Total time spent coaching in the conversation. |
| Total Voicemail | Total duration of voicemails included in the conversation. |
| User Segments | The number of times an agent (user) was on an interaction. For example, if agent A answered an email interaction twice, and agent B answered the same email interaction once, then user segments would be 3. |
| Wrap-up Segments | The number of times an interaction was in wrap-up. |
| Total Monitor | Total time that the user spent monitoring interactions. |
| Error Count | The number of errors for the interaction. |
| Active Total Callback | Active total callback duration is the sum of all calling activity for the call portions of the callback. For example, the active total callback duration could include all durations from the call portion of a callback: tContacting --> tDialing --> tTalk --> tHeld --> tTalk --> tAcw. |
| Active Park | Displays the duration of the interaction that is currently parked. |
| Total Park | Displays the total parked duration of the completed interaction. |
| Not Responding | The number of times an agent did not respond to the interaction. |
Outbound
| Column | Description |
|---|---|
| Column | Description |
| Campaign Name | The name of the campaign associated with the interaction. |
| Contact List | The name of the contact list associated with the interaction. |
| Contact ID | The contact ID associated with the interaction. |
| Call Analysis Result |
The type of call detected based on call analysis. Results include disconnect, live voice, busy, machine, no answer, SIT callable, fax, line connected, speech, SIT uncallable, and not found. |
| Outbound Attempt | The number of attempts made to call the customer. |
| Campaign | Whether an interaction has a campaign associated with it. |
| Campaign Start | The start date of the first outbound call of a campaign. |
| Time to Flow | The amount of time it took for the campaign call to enter a flow. |
| Time to Agent | The amount of time it took for the campaign call to reach an agent. |
| Campaign Caller Name | The name of the customer being called by the campaign. |
Routing
| Column | Description |
|---|---|
| Column | Description |
| Agent Bullseye Ring | Indicates the bullseye ring an agent is assigned to. |
| Bullseye Ring | Indicates the bullseye ring in which the interaction was answered. |
| Direct Routing | Indicates whether Direct Routing was requested and/or used. |
| Languages | Displays the languages set by the routing service for the interaction. |
| Manual Agents Assigned | On-queue agents who were manually assigned this waiting interaction. |
| Manual Assigner | User with the appropriate permissions who manually assigned this interaction to a waiting agent in the queue. |
| Predictive Agent Selected | Lists the agents used during predictive routing. |
| Predictive Agents Proposed |
Lists the agents evaluated during predictive routing. Note: If your role does not include the Routing > Predictor > View permission, then the Predictive Agents Proposed column does not appear.
|
| Preferred Agents | Lists the preferred agents requested during interaction routing, even if the system was not able to route the interaction to the preferred agents. Includes the agent’s routing score. |
| Preferred Agents Requested | Displays whether an interaction had preferred agents requested due to preferred agents configuration, even if the system was not able to route the interaction to the preferred agents. |
| Preferred Rule | Indicates the rule in for the preferred agent. |
| Routing Requested | Displays the routing methods that were requested for the interaction. Gives insight into each of the routing methods the conversation went through prior to being answered, abandoned, or flow-out. The routing data is relevant beginning September 5, 2020. |
|
Routing Rule |
Indicates the routing rings associated with an interaction. |
| Routing Used | Displays the routing method that was used to get to the agent who answered the interaction. The routing data is relevant beginning September 5, 2020. |
| Skills | Displays the original skills that came from the flow. |
| Skills – Active | Displays the skills remaining on the interaction used for routing. |
| Skills — Removed | Displays skills removed from the interaction through bullseye routing. |
Surveys
| Column | Description |
|---|---|
| Column | Description |
| Has Survey Data | Displays whether an interaction is associated with survey data. |
| Promoter Score | The promoter score given by a survey respondent in a survey. Genesys Cloud uses the promoter score to calculate the survey’s overall NPS. For more information about NPS, see Net Promoter Score web survey question overview. |
| Survey Form | The name of the survey form sent. |
| Survey Score | The completed surveys’ percentage score. The score does not include NPS. |
| Survey Status |
Displays the status of the survey:
|
| Surveys | The number of surveys sent related to the interaction. |
| Survey Type | Displays the type of the survey, such as voice or web. One value is listed for each survey that is associated with the interaction. |
Journey Action Maps Summary view
| Column | Description |
|---|---|
| Name | Action map name. |
| Type | Type of web action associated to the action map, such as web chat or content offer. |
| Qualified | Number of times that the action map qualified to offer a web action to visitors. |
| Offered |
Number of times that the action map offered a web action to visitors. |
| Offered % |
Percent of qualified action maps that offered a web action (Offered/Qualified). |
| Blocked |
Number of blocked actions. Click the blocked count to view blocker constraint details for an individual action map. |
| Accepted | Number of times that visitors accepted the action map's web action. |
| Accepted % | Percent of web actions that visitors accepted (Accepted/Offered). |
| Engaged | Number of times that agents engaged with a web chat or web messaging. Note: This data is currently not available for web messenger. |
| Engaged % |
Percent of web chat or web messaging engagements that visitors accepted (Engaged/Accepted). |
| Rejected | Number of times that visitors rejected the action map's web action. |
| Rejected % | Percent of web actions that visitors rejected (Rejected/Offered). |
| Outcomes | Number of outcomes that have achievements because of the action map. Note: This data is currently not available for web messenger. |
| Outcomes Achieved | Number of times that the outcome associated to the action map was achieved. Note: This data is currently not available for web messenger. |
| Active |
Indicates whether the action map is active and ready to trigger on your website. |
| Updated |
Date the action map was last modified. |
|
Outcome value |
The outcome value achieved by each action map. |
Journey Outcomes Summary view
| Column | Description |
|---|---|
| Achieved | Number of times that the outcome was achieved. |
| Achieved w/ Engagement | Number of outcomes achieved that were associated to a web action (such as, web chat or content offer). Note: This data is currently not available for web messenger. |
| Action Maps | Number of action maps that have assisted in an outcome achievement. Note: This data is currently not available for web messenger. |
| Active | Indicates whether the outcome is ready to use on your website. |
| Name | Outcome name. |
| Outcome Value |
The outcome value achieved by each action map. Also add a row beneath this now for Outcome value with Engagement. |
| Outcome per Engagement % | Percentage of actions that achieved the outcome (Achieved with Action / number of actions). |
| Segments | Number of segments that achieved the outcome. |
| Updated | Date the outcome was last modified. |
| Value with Engagement | The outcome value achieved by each action map after the action map is engaged. Note: This data is currently not available for web messenger. |
Journey Segments Summary view
| Column | Description |
|---|---|
| Name | Segment name. |
| Segment Matches | Number of visitors matched to the segment. |
| Description | Segment description. |
| Type | Segment type (such as session or customer). |
| Action Maps | Number of action maps configured to use the segment. |
| Outcomes Achieved | Number of outcomes achieved for the segment. |
|
Outcome value |
The outcome value achieved by each action map. |
| Active | Indicates whether the segment is ready to match visitors on your website. |
| Updated | Date the outcome was last modified. |
Message Agent Performance Detail view
Performance
| Metric | Definition |
|---|---|
| Metric | Definition |
| Answer | A measurement of the number of assigned ACD interactions answered by an agent in a given period. Answered increments when the agent is the first to connect to the interaction. |
| Inbound Audio | The number of inbound audio or voice messages received from a customer. Notes: Since messaging is asynchronous, in rare instances, when an agent ends an interaction while an end customer finishes recording and sending a voice note, the last audio file attachment or voice note is not considered for analytics. The audio attachment of the conversation remains intact and is preserved as part of the conversation. There is no data loss. The agent still receives and views the voice note. You can see the impact only in the count of the inbound audio metric. The inbound audio metric can be undercounted. |
| Outbound Audio | The number of outbound audio or voice messages sent by an agent. |
| Avg Agent Response | The average time the agent takes to turn the conversation back to the customer. Calculated by (total average agent response time / total number of agent chat sessions). |
| Avg Customer Response | The average time the customer takes to turn the conversation back to the agent. Calculated by (total average customer response time / total number of customer chat sessions). |
| Total First Response | The total amount of time the agents take to send their first message after connecting to a chat. Calculated by the total duration between the agent's session connecting and the agent's first message sent. |
| Message Turns | The total number of times the conversation turns from one participant to another, that is, a complete communication where one person sends one or more messages and the other responds. |
| Avg Time to First Response | The average time the agent takes to send a message once they connect to the conversation. |
| Total First Engagement | The time the customer takes to receive an engagement from an agent. It is determined from the time difference between the first customer message at the beginning of the chat and the first message that they received from an agent. Messages from the bots are not considered for calculation. |
| Avg Time to First Engagement | The average time it takes for a customer to receive an engagement from an agent. Calculated by (the total duration between the customer's first message and the first agent response / the number of first engagements). Messages from the bots are not considered for calculation. |
| Avg Message Turns | The average amount of the back and forth messages per conversation session. Calculated by (the total number of message turns / the total count of number of message turns). |
| ASA | The average amount of time an interaction waits in the queue before an agent answers. This metric does not include interactions that agents do not answer. Average Speed of Answer (ASA) is directly associated with the service level and provides insight into the customer service your organization provides. ASA is recorded in the interval in which the agent answered the interaction. Calculated by: Total Answered (tAnswered Sum) / Answered Count (tAnswered Count) Note: Raw values are provided in milliseconds. |
| Handle | The total number of ACD and non-ACD interactions that agents were involved in for the selected media type. Handle increments in the interval in which the interaction ends, after the agent completes any after call work and completes the interaction. |
| Adherence | The current adherence status of the user, including In Adherence, Out of Adherence, Unscheduled, Ignored, or Unknown. |
| Adherence Duration | The amount of time represented in days, hours, minutes, and seconds, of the adherence exception. |
| Department | Department of the user as defined within Genesys Cloud. |
Email address configured for the user. |
|
| Location | Location for the user as defined in Genesys Cloud. |
| Reports To | The manager as defined for the user within Genesys Cloud. |
| Time in Routing Status |
The amount of time agents have been in their current routing status. |
| Routing Status |
The current routing status of an agent. |
| Scheduled Activity | The activity for which the user is currently scheduled, including On Queue Work, Break, Meal, Meeting, Off Queue Work, Time Off, Training, Unavailable, or Unscheduled. |
| Secondary Status |
The current secondary status of an agent. If there is no secondary status, then this column displays the agent’s primary status. |
| Status |
The current primary status of an agent, such as Available, Away, or Busy. |
|
Time in Status |
The amount of time agents have been in their current primary status. |
| Title | Title of the user as defined within Genesys Cloud. |
| Avg Handle | The average amount of time agents spent handling interactions. This calculation includes talk time, hold time, and after-call work. For outbound calls it also includes dialing and contacting time. Calculated by: (cumulative talk time + cumulative hold time + cumulative after-call work + cumulative dialing time + cumulative contacting time) / Number of interactions handled Note: The interactions can span multiple time intervals. For example, a 45-minute call spans two 30-minute intervals. However, metrics are assigned a single timestamp and reported in the interval into which this timestamp falls. The timestamps are assigned based on when the metric calculation is complete.
For instance, handle time will use the timestamp of after call work completion. In the example of a 45-minute call, the handle time falls in the second 30-minute interval because the handle time was calculated at the end of the call when ACW was submitted. |
| Avg Interact | The average number of seconds spent interacting on a message. |
| Interval | The time period. |
| ID | The specific conversation ID for the interaction. |
| Avg ACW | The average amount of time agents spent completing after-call work. Calculated by: Total ACW / Interactions with ACW |
| Total Handle | The total amount of time agents spend on an interaction including time spent contacting, time spent dialing, talk time, hold time, and after call work. |
| Total Interact | The total amount of time spent interacting on all the message conversations by the agent, within an interval. |
| Total ACW | The cumulative time spent in after-call work (ACW) on all interactions. After-call work is the work that an agent performs immediately following an interaction. Work may involve keying activity codes, updating customer databases, filling out forms, or initiating outbound contact. As a metric, it indicates the total time an agent takes to finish working on a call. If an agent must complete work before the agent can handle the next contact, then ACW is factored into the average handle time. |
| Error | The number of errors that occurred on conversations. |
| Transfer | A measurement of the number of interactions an agent answered in one queue and then transferred. A transfer counts for the queue in which an agent answers the interaction. This measurement is calculated by the number of interactions blind transferred or consult transferred. |
| Outbound | This metric represents the number of outbound interactions placed on behalf of queue. |
| Alert – No Answer | The number of times an agent was alerted to a conversation but did not answer the conversation. Note: This metric does not specifically count the number of times an agent was placed in a Not Responding routing status. An agent is transitioned to Not Responding status after a specific alert time threshold for ACD-routed conversations. Alert – No Answer can be incremented for all conversation types for any situation where an alert was not followed by an answer event. |
| Total Alert – No Answer | The total number of seconds Genesys Cloud offered an agent an interaction before the agent declined the interaction or the interaction timed out. |
| Alert | The number of times agents receive an alert for interactions. |
| Total Alert | The total time Genesys Cloud alerts agents before the agent accepts or declines an interaction. |
| Total Monitor | Total time that the user spent monitoring interactions. |
| Avg Monitor | Average time that the user spent monitoring interactions. |
| Max Monitor | Maximum time that the user spent monitoring interactions. |
| Min Monitor | Minimum time that the user spent monitoring interactions. |
| Monitor | Number of interactions that were monitored. |
| Transfer % | The number of transfers compared with the total number of interactions answered. Calculated by: (No. of transfers / interactions answered) * 100 |
| Min Alert | The minimum amount of time an agent was being alerted. |
| Max Alert | The maximum amount of time an agent was being alerted. |
| Min Alert – No Answer | The minimum amount of time an agent was being alerted without responding to an interaction. |
| Max Alert – No Answer | The maximum amount of time an agent was being alerted without responding to an interaction. |
| Min Handle | The minimum amount of time agents were involved in ACD and non-ACD interactions, including answered interactions, transfers, callbacks, and outbound calls. |
| Max Handle | The maximum amount of time agents were involved in ACD and non-ACD interactions, including answered interactions, transfers, callbacks, and outbound calls. |
| Min Interact | The minimum amount of time spent interacting on a message for the selected interval. |
| Max Interact | The maximum amount of time spent interacting on a message for the selected interval. |
| Min Answer | The minimum amount of time an agent spent answering assigned ACD interactions for the selected interval. |
| Max Answer | The maximum amount of time an agent spent answering assigned ACD interactions for the selected interval. |
| Min ACW | The minimum amount of time spent on after call work for the selected interval. |
| Max ACW | The maximum amount of time spent on after call work for the selected interval. |
| Blind Transfer | The number of interactions an agent answered in one queue and then blind transferred. A blind transfer counts for the queue in which an agent answers the interaction. |
| Blind Transfer % | The percentage of interactions an agent answered in one queue and then blind transferred. |
| Avg ACW Handled | The average time any interaction spent in ACW. This calculation takes into account all interactions handled, not just those that had ACW. Calculated by: Total ACW Time / Number of Interactions Handled |
|
ACW |
The number of times after-call work (ACW) was completed. After-call work is the work that an agent performs immediately following an interaction. Work may involve keying activity codes, updating customer databases, filling out forms, or initiating outbound contact. As a metric, it indicates the total time an agent takes to finish working on a call. If an agent must complete work before the agent can handle the next contact, then ACW is factored into the average handle time. |
|
Interact |
The number of sessions where the user(s) interacted during message conversations. A session includes the point where the agent joins the message conversation to the point where they disconnect. |
Routing
For an overview of routing methods, see Routing and evaluation methods.
| Column | Description | Columns live update |
|---|---|---|
| Bullseye Requested | The number of interactions in which bullseye routing was requested. |
No |
| Bullseye Requested % | The rate of answered interactions in which bullseye routing was requested in comparison to all answered interactions. |
No |
| Bullseye Used | The number of answered interactions in which bullseye routing was used. |
No |
| Bullseye Used % | The rate of interactions in which bullseye routing was used in comparison to all answered interactions. |
No |
|
Conditional Requested |
The number of interactions in which conditional routing was requested. | No |
|
Conditional Requested % |
The rate of answered interactions in which conditional routing routing was requested in comparison to all answered interactions. | No |
|
Conditional Used |
The number of interactions in which conditional routing was used. | No |
|
Conditional Used % |
The rate of interactions in which conditional routing was used in comparison to all answered interactions. | No |
| Direct Requested | The number of interactions in which direct routing was requested. | No |
|
Direct Requested % |
The rate of answered interactions in which direct routing was requested in comparison to all answered interactions. | No |
|
Direct Used |
The number of answered interactions in which direct routing was used. | No |
|
Direct Used % |
The rate of interactions in which direct routing was used in comparison to all answered interactions. | No |
| Last Requested | The number of answered interactions in which last routing was used. See Last agent handling. |
No |
| Last Requested % | The rate of interactions in which last routing was requested in comparison to all answered interactions. See Last agent handling. |
No |
| Last Used | The number of answered interactions in which last routing was used. See Last agent handling. |
No |
| Last Used % | The rate of interactions in which last routing was used in comparison to all answered interactions. See Last agent handling. |
No |
| Manual Used | The number of answered interactions in which manual routing was used. |
No |
| Manual Used % | The rate of interactions in which manual routing was used in comparison to all answered interactions. |
No |
| Predictive Requested | The number of answered interactions in which predictive routing was requested. |
No |
| Predictive Requested % | The rate of interactions in which predictive routing was requested in comparison with all answered interactions. |
No |
| Predictive Used | The number of answered interactions in which predictive routing was used. |
No |
| Predictive Used % | The rate of interactions in which predictive routing was used in comparison with all answered interactions. |
No |
| Preferred Requested | The number of answered interactions in which preferred agent routing was used. |
No |
| Preferred Requested % | The rate of interactions in which preferred agent routing was requested in comparison with all answered interactions. |
No |
| Preferred Used | The number of answered interactions in which preferred agent routing was used. |
No |
| Preferred Used % | The rate of interactions in which preferred agent routing was used in comparison to all answered interactions. |
No |
| Standard Requested | The number of answered interactions in which standard routing was requested. |
No |
| Standard Requested % | The rate of interactions in which standard routing was requested in comparison to all answered interactions. |
No |
| Standard Used | The number of answered interactions in which standard routing was used. |
No |
| Standard Used % | The rate of interactions in which standard routing was used in comparison to all answered interactions. |
No |
Speech and text analytics
| Column | Column Description |
|---|---|
| Avg Sentiment | Average customer sentiment score (-100 to 100) in the specified interval with the provided filters. |
| Negative Sentiment Instances | The number of negative sentiment instances. For more information, see Understand sentiment analysis. |
| Overall Avg Sentiment Score | The average overall sentiment score of the interactions. Calculated by: oSentimentScore.sum / oSentimentScore.count |
| Positive Sentiment Instances | The number of positive sentiment instances. For more information, see Understand sentiment analysis. |
| Sentiment Instances | Number of instances of sentiment in the given interval with the provided filters. |
Message Agent Performance Summary view
Performance
| Columns | Description |
|---|---|
| Columns | Description |
| Answer | A measurement of the number of assigned ACD interactions answered by an agent in a given period. Answered increments when the agent is the first to connect to the interaction. |
| Inbound Audio | The number of inbound audio or voice messages received from a customer. Notes: Since messaging is asynchronous, in rare instances, when an agent ends an interaction while an end customer finishes recording and sending a voice note, the last audio file attachment or voice note is not considered for analytics. The audio attachment of the conversation remains intact and is preserved as part of the conversation. There is no data loss. The agent still receives and views the voice note. You can see the impact only in the count of the inbound audio metric. The inbound audio metric can be undercounted. |
| Outbound Audio | The number of outbound audio or voice messages sent by an agent. |
| Avg Agent Response | The average time the agent takes to turn the conversation back to the customer. Calculated by (total average agent response time / total number of agent chat sessions). |
| Avg Customer Response | The average time the customer takes to turn the conversation back to the agent. Calculated by (total average customer response time / total number of customer chat sessions). |
| Total First Response | The total amount of time the agents take to send their first message after connecting to a chat. Calculated by the total duration between the agent's session connecting and the agent's first message sent. |
| Message Turns | The total number of times the conversation turns from one participant to another, that is, a complete communication where one person sends one or more messages and the other responds. |
| Avg Time to First Response | The average amount of time the agents take to send their first message after connecting to a chat. Calculated from the duration between the agent's session connecting and the agent's first message sent. Calculated by (the total duration of time of first response messages / the total number of first response messages). Messages from the bots are not considered for calculation. |
| Total First Engagement | The time the customer takes to receive an engagement from an agent. It is determined from the time difference between the first customer message at the beginning of the chat and the first message that they received from an agent. Messages from the bots are not considered for calculation. |
| Avg Time to First Engagement | The average time it takes for a customer to receive an engagement from an agent. Calculated by (the total duration between the customer's first message and the first agent response / the number of first engagements). Messages from the bots are not considered for calculation. |
| Avg Message Turns | The average amount of the back and forth messages per conversation session. Calculated by (the total number of message turns / the total count of number of message turns). |
| ASA | The average amount of time an interaction waits in the queue before an agent answers. This metric does not include interactions that agents do not answer. Average Speed of Answer (ASA) is directly associated with the service level and provides insight into the customer service your organization provides. ASA is recorded in the interval in which the agent answered the interaction. Calculated by: Total Answered (tAnswered Sum) / Answered Count (tAnswered Count) Note: Raw values are provided in milliseconds. |
| Handle | The total number of ACD and non-ACD interactions that agents were involved in for the selected media type. Handle increments in the interval in which the interaction ends, after the agent completes any after call work and completes the interaction. |
| Avg Handle | The average amount of time agents spent handling interactions. This calculation includes talk time, hold time, and after-call work. For outbound calls it also includes dialing and contacting time. Calculated by: (cumulative talk time + cumulative hold time + cumulative after-call work + cumulative dialing time + cumulative contacting time) / Number of interactions handled Note: The interactions can span multiple time intervals. For example, a 45-minute call spans two 30-minute intervals. However, metrics are assigned a single timestamp and reported in the interval into which this timestamp falls. The timestamps are assigned based on when the metric calculation is complete.
For instance, handle time will use the timestamp of after call work completion. In the example of a 45-minute call, the handle time falls in the second 30-minute interval because the handle time was calculated at the end of the call when ACW was submitted. |
| Adherence Duration | The amount of time represented in days, hours, minutes, and seconds, of the adherence exception. |
| Adherence | The current adherence status of the user, including In Adherence, Out of Adherence, Unscheduled, Ignored, or Unknown. |
| Agent | The full name for the user. |
| Department | Department of the user as defined within Genesys Cloud. |
Email address configured for the user. |
|
| Location | Location for the user as defined in Genesys Cloud. |
| Reports To | The manager as defined for the user within Genesys Cloud. |
| ID | Unique system ID for the user. |
| Routing Status |
The current routing status of an agent. |
| Secondary Status |
The current secondary status of an agent. If there is no secondary status, then this column displays the agent’s primary status. |
| Scheduled Activity | The activity for which the user is currently scheduled, including On Queue Work, Break, Meal, Meeting, Off Queue Work, Time Off, Training, Unavailable, or Unscheduled. |
|
Time in Status |
The amount of time agents have been in their current primary status. |
| Status |
The current primary status of an agent, such as Available, Away, or Busy. |
| Title | Title of the user as defined within Genesys Cloud. |
| Time in Routing Status |
The amount of time agents have been in their current routing status. |
| Presence | Indicates the agent’s presence: green (Available), yellow (Away, Break, Meal, or Training), red (Busy or Meeting), blue (On Queue, Interacting, Not Responding, or Idle), pink (Out of Office), or gray (Offline). |
| Avg Interact | The average number of seconds spent interacting on a message. |
| Transfer | A measurement of the number of interactions an agent answered in one queue and then transferred. A transfer counts for the queue in which an agent answers the interaction. This measurement is calculated by the number of interactions blind transferred or consult transferred. |
| Transfer % | The number of transfers compared with the total number of interactions answered. Calculated by: (No. of transfers / interactions answered) * 100 |
| Avg ACW | The average amount of time agents spent completing after-call work. Calculated by: Total ACW / Interactions with ACW |
| Total Handle | The total amount of time agents spend on an interaction including time spent contacting, time spent dialing, talk time, hold time, and after call work. |
| Total Interact | The total amount of time spent interacting on all the message conversations by the agent, within an interval. |
| Total ACW | The cumulative time spent in after-call work (ACW) on all interactions. After-call work is the work that an agent performs immediately following an interaction. Work may involve keying activity codes, updating customer databases, filling out forms, or initiating outbound contact. As a metric, it indicates the total time an agent takes to finish working on a call. If an agent must complete work before the agent can handle the next contact, then ACW is factored into the average handle time. |
| Error | The number of errors that occurred on conversations. |
| Outbound | This metric represents the number of outbound interactions placed on behalf of queue. |
| Alert – No Answer | The number of times an agent was alerted to a conversation but did not answer the conversation. Note: This metric does not specifically count the number of times an agent was placed in a Not Responding routing status. An agent is transitioned to Not Responding status after a specific alert time threshold for ACD-routed conversations. Alert – No Answer can be incremented for all conversation types for any situation where an alert was not followed by an answer event. |
| Total Alert – No Answer | The total number of seconds Genesys Cloud offered an agent an interaction before the agent declined the interaction or the interaction timed out. |
| Alert | The number of times agents receive an alert for interactions. |
| Total Alert | The total time Genesys Cloud alerts agents before the agent accepts or declines an interaction. |
| Division | Displays the name of a division that an agent or queue belongs to. For more information, see About access control. |
| Total Monitor | Total time that the user spent monitoring interactions. |
| Avg Monitor | Average time that the user spent monitoring interactions. |
| Max Monitor | Maximum time that the user spent monitoring interactions. |
| Min Monitor | Minimum time that the user spent monitoring interactions. |
| Monitor | Number of interactions that were monitored. |
| Min Alert | The minimum amount of time an agent was being alerted. |
| Max Alert | The maximum amount of time an agent was being alerted. |
| Min Alert – No Answer | The minimum amount of time an agent was being alerted without responding to an interaction. |
| Max Alert – No Answer | The maximum amount of time an agent was being alerted without responding to an interaction. |
| Min Handle | The minimum amount of time agents were involved in ACD and non-ACD interactions, including answered interactions, transfers, callbacks, and outbound calls. |
| Max Handle | The maximum amount of time agents were involved in ACD and non-ACD interactions, including answered interactions, transfers, callbacks, and outbound calls. |
| Min Interact | The minimum amount of time spent interacting on a message for the selected interval. |
| Max Interact | The maximum amount of time spent interacting on a message for the selected interval. |
| Min Answer | The minimum amount of time an agent spent answering assigned ACD interactions for the selected interval. |
| Max Answer | The maximum amount of time an agent spent answering assigned ACD interactions for the selected interval. |
| Min ACW | The minimum amount of time spent on after call work for the selected interval. |
| Max ACW | The maximum amount of time spent on after call work for the selected interval. |
| Blind Transfer | The number of interactions an agent answered in one queue and then blind transferred. A blind transfer counts for the queue in which an agent answers the interaction. |
| Blind Transfer % | The percentage of interactions an agent answered in one queue and then blind transferred. |
| Avg ACW Handled | The average time any interaction spent in ACW. This calculation takes into account all interactions handled, not just those that had ACW. Calculated by: Total ACW Time / Number of Interactions Handled |
|
ACW |
The number of times after-call work (ACW) was completed. After-call work is the work that an agent performs immediately following an interaction. Work may involve keying activity codes, updating customer databases, filling out forms, or initiating outbound contact. As a metric, it indicates the total time an agent takes to finish working on a call. If an agent must complete work before the agent can handle the next contact, then ACW is factored into the average handle time. |
|
Interact |
The number of sessions where the user(s) interacted during message conversations. A session includes the point where the agent joins the message conversation to the point where they disconnect. |
Routing
For an overview of routing methods, see Routing and evaluation methods.
| Column | Description | Columns live update |
|---|---|---|
| Bullseye Requested | The number of interactions in which bullseye routing was requested. |
No |
| Bullseye Requested % | The rate of answered interactions in which bullseye routing was requested in comparison to all answered interactions. |
No |
| Bullseye Used | The number of answered interactions in which bullseye routing was used. |
No |
| Bullseye Used % | The rate of interactions in which bullseye routing was used in comparison to all answered interactions. |
No |
|
Conditional Requested |
The number of interactions in which conditional routing was requested. | No |
|
Conditional Requested % |
The rate of answered interactions in which conditional routing routing was requested in comparison to all answered interactions. | No |
|
Conditional Used |
The number of interactions in which conditional routing was used. | No |
|
Conditional Used % |
The rate of interactions in which conditional routing was used in comparison to all answered interactions. | No |
| Direct Requested | The number of interactions in which direct routing was requested. | No |
|
Direct Requested % |
The rate of answered interactions in which direct routing was requested in comparison to all answered interactions. | No |
|
Direct Used |
The number of answered interactions in which direct routing was used. | No |
|
Direct Used % |
The rate of interactions in which direct routing was used in comparison to all answered interactions. | No |
| Last Requested | The number of answered interactions in which last routing was used. See Last agent handling. |
No |
| Last Requested % | The rate of interactions in which last routing was requested in comparison to all answered interactions. See Last agent handling. |
No |
| Last Used | The number of answered interactions in which last routing was used. See Last agent handling. |
No |
| Last Used % | The rate of interactions in which last routing was used in comparison to all answered interactions. See Last agent handling. |
No |
| Manual Used | The number of answered interactions in which manual routing was used. |
No |
| Manual Used % | The rate of interactions in which manual routing was used in comparison to all answered interactions. |
No |
| Predictive Requested | The number of answered interactions in which predictive routing was requested. |
No |
| Predictive Requested % | The rate of interactions in which predictive routing was requested in comparison with all answered interactions. |
No |
| Predictive Used | The number of answered interactions in which predictive routing was used. |
No |
| Predictive Used % | The rate of interactions in which predictive routing was used in comparison with all answered interactions. |
No |
| Preferred Requested | The number of answered interactions in which preferred agent routing was used. |
No |
| Preferred Requested % | The rate of interactions in which preferred agent routing was requested in comparison with all answered interactions. |
No |
| Preferred Used | The number of answered interactions in which preferred agent routing was used. |
No |
| Preferred Used % | The rate of interactions in which preferred agent routing was used in comparison to all answered interactions. |
No |
| Standard Requested | The number of answered interactions in which standard routing was requested. |
No |
| Standard Requested % | The rate of interactions in which standard routing was requested in comparison to all answered interactions. |
No |
| Standard Used | The number of answered interactions in which standard routing was used. |
No |
| Standard Used % | The rate of interactions in which standard routing was used in comparison to all answered interactions. |
No |
Speech and text analytics
| Column | Column Description |
|---|---|
| Avg Sentiment | Average customer sentiment score (-100 to 100) in the specified interval with the provided filters. |
| Negative Sentiment Instances | The number of negative sentiment instances. For more information, see Understand sentiment analysis. |
| Overall Avg Sentiment Score | The average overall sentiment score of the interactions. Calculated by: oSentimentScore.sum / oSentimentScore.count |
| Positive Sentiment Instances | The number of positive sentiment instances. For more information, see Understand sentiment analysis. |
| Sentiment Instances | Number of instances of sentiment in the given interval with the provided filters. |
Message Queue Performance Detail view
Performance
| Column | Description |
|---|---|
| Column | Description |
| Offer | The number of interactions routed into the queue for an agent to answer. Offered interactions are either answered, abandoned, or flow-out interactions. |
| Inbound Audio | The number of inbound audio or voice messages received from a customer. Notes: Since messaging is asynchronous, in rare instances, when an agent ends an interaction while an end customer finishes recording and sending a voice note, the last audio file attachment or voice note is not considered for analytics. The audio attachment of the conversation remains intact and is preserved as part of the conversation. There is no data loss. The agent still receives and views the voice note. You can see the impact only in the count of the inbound audio metric. The inbound audio metric can be undercounted. |
| Outbound Audio | The number of outbound audio or voice messages sent by an agent. |
| Avg Agent Response | The average time the agent takes to turn the conversation back to the customer. Calculated by (total average agent response time / total number of agent chat sessions). |
| Avg Customer Response | The average time the customer takes to turn the conversation back to the agent. Calculated by (total average customer response time / total number of customer chat sessions). |
| Total First Response | The total amount of time the agents take to send their first message after connecting to a chat. Calculated by the total duration between the agent's session connecting and the agent's first message sent. |
| Message Turns | The total number of times the conversation turns from one participant to another, that is, a complete communication where one person sends one or more messages and the other responds. |
| Avg Time to First Response | The average time the agent takes to send a message once they connect to the conversation. |
| Total First Engagement | The time the customer takes to receive an engagement from an agent. It is determined from the time difference between the first customer message at the beginning of the chat and the first message that they received from an agent. Messages from the bots are not considered for calculation. |
| Avg Time to First Engagement | The average time it takes for a customer to receive an engagement from an agent. Calculated by (the total duration between the customer's first message and the first agent response / the number of first engagements). Messages from the bots are not considered for calculation. |
| Avg Message Turns | The average amount of the back and forth messages per conversation session. Calculated by (the total number of message turns / the total count of number of message turns). |
| Answer % | The percentage of offered interactions that an agent answered. Calculated by: (Answered / Offered) * 100 |
| Outbound | This metric represents the number of outbound interactions placed on behalf of queue. |
| Flow-Out | Flow-outs are interactions that enter and leave a queue without getting answered by an agent and without getting disconnected. Flow-outs are an indication of customer service level and queue productivity. High numbers of flow-outs can indicate staffing issues or ineffective agents when used with high handle times (bullseye matching metrics). Flow-outs can include transfers to voicemail, callbacks, and any system-driven events such as in-queue flows that transfer to another queue or external party after a certain amount of time. Flow-outs can also occur if the caller opts to exit out of the queue and return to the IVR. Offered interactions are either flow-out, answered, or abandoned interactions. |
| ASA | The average amount of time an interaction waits in the queue before an agent answers. This metric does not include interactions that agents do not answer. Average Speed of Answer (ASA) is directly associated with the service level and provides insight into the customer service your organization provides. ASA is recorded in the interval in which the agent answered the interaction. Calculated by: Total Answered (tAnswered Sum) / Answered Count (tAnswered Count) Note: Raw values are provided in milliseconds. |
| Service Level % |
Service level target is a contact center performance statistic expressed as “X percent of conversations answered in Y seconds.” For example, a goal of answering 80% of voice calls within 20 seconds provides a service level target of 80/20. You can set the service level target for each media type in a queue. Analytics uses this service level target to calculate whether you are within the service level % defined by your service level agreement (SLA). For more information about setting the service level target, see Create queues or Edit or delete queues. Note: In the performance views that are not queue-specific, the Service Level % is calculated by queue and displayed as a – on the aggregated group row since SLA targets vary by queue. The affected views are DNIS Performance Summary and Skills Performance views. To view individual queue service level %, click the + to expand the row.
The service level % is the percentage of interactions that meet your contact center's service level target. The formula to calculate the service level % is:
Number of Conversations Answered within SLA The numerator is calculated by taking the total answered conversations and subtracting the conversations that were not answered within the SLA threshold. Calculated by: (Answered Count – SLA Violation Count) Total Number of Conversations The Service Level Options configuration determines the denominator. With all the options below unchecked, the denominator is the count of answered conversations.
As the service level calculation depends on an organization’s configured options, the final formula to calculate the service level is:
Notes:
In this view, the service level set for the queue appears as a gray number beside the service level percentage for the interval. If the service level percentage for the interval is lower than the set service level, then the service level percentage is red. |
| Avg Wait | The average amount of time an interaction is in a queue before an agent answers it, before the interaction moves out of the queue, or before the customer abandons the interaction. Calculated by: Total Wait Time / Interactions |
| Handle | The total number of ACD and non-ACD interactions that agents were involved in for the selected media type. Handle increments in the interval in which the interaction ends, after the agent completes any after call work and completes the interaction. |
| Avg Handle |
The average amount of time agents spent handling interactions. This calculation includes talk time, hold time, and after-call work. For outbound calls it also includes dialing and contacting time. Calculated by: (cumulative talk time + cumulative hold time + cumulative after-call work + cumulative dialing time + cumulative contacting time) / Number of interactions handled Note: The interactions can span multiple time intervals. For example, a 45-minute call spans two 30-minute intervals. However, metrics are assigned a single timestamp and reported in the interval into which this timestamp falls. The timestamps are assigned based on when the metric calculation is complete.
For instance, handle time will use the timestamp of after call work completion. In the example of a 45-minute call, the handle time falls in the second 30-minute interval because the handle time was calculated at the end of the call when ACW was submitted. In these views, the Avg Talk, Avg Hold, and Avg ACW columns do not equal the Avg Handle column because only some interactions include holds. This view calculates the average handle column using cumulative counts rather than averages. |
| Avg Interact | The average number of seconds spent interacting on a message. |
| Avg ACW | The average amount of time agents spent completing after-call work. Calculated by: Total ACW / Interactions with ACW |
| Total Handle | The total amount of time agents spend on an interaction including time spent contacting, time spent dialing, talk time, hold time, and after call work. |
| Total Interact | The total amount of time spent interacting on all the message conversations by the agent, within an interval. |
| Total ACW | The cumulative time spent in after-call work (ACW) on all interactions. After-call work is the work that an agent performs immediately following an interaction. Work may involve keying activity codes, updating customer databases, filling out forms, or initiating outbound contact. As a metric, it indicates the total time an agent takes to finish working on a call. If an agent must complete work before the agent can handle the next contact, then ACW is factored into the average handle time. |
| Transfer | A measurement of the number of interactions an agent answered in one queue and then transferred. A transfer counts for the queue in which an agent answers the interaction. This measurement is calculated by the number of interactions blind transferred or consult transferred. |
| Blind Transfer | The number of interactions an agent answered in one queue and then blind transferred. A blind transfer counts for the queue in which an agent answers the interaction. |
| Total Wait | The total amount of time an interaction is in a queue before an agent answers it, it flows out, or the customer abandons it. Genesys Cloud calculates the wait time in milliseconds. |
| Connection | The number of interactions that initially connected to the contact center in a particular location, such as a queue or IVR. |
| Inbound Media | The count of inbound media for an interaction. |
| Transfer % | The number of transfers compared with the total number of interactions answered. Calculated by: (No. of transfers / interactions answered) * 100 |
| Max Wait | The maximum amount of time spent waiting in queue for the selected interval. |
| Min Wait | The minimum amount of time spent waiting in queue for the selected interval. |
| Max Interact | The maximum amount of time spent interacting on a message for the selected interval. |
| Min Interact | The minimum amount of time spent interacting on a message for the selected interval. |
| Max ACW | The maximum amount of time spent on after call work for the selected interval. |
| Min ACW | The minimum amount of time spent on after call work for the selected interval. |
| Over SLA | Number of interactions that were over the defined Service Level. |
| Met SLA | Number of interactions that met the defined service level. |
| Outbound Attempt | Attempted outbound interactions for Dialer campaigns. |
| Error | The number of errors that occurred on the queue conversations. |
| SL % | The service level percentage for the queue. |
| SL Target % | The service level target percentage for the queue. |
| Avg ACW Handled | The average time any interaction spent in ACW. This calculation takes into account all interactions handled, not just those that had ACW. Calculated by: Total ACW Time / Number of Interactions Handled |
| Outbound Media | The number of outbound media for an interaction. |
|
ACW |
The number of times after-call work (ACW) was completed. After-call work is the work that an agent performs immediately following an interaction. Work may involve keying activity codes, updating customer databases, filling out forms, or initiating outbound contact. As a metric, it indicates the total time an agent takes to finish working on a call. If an agent must complete work before the agent can handle the next contact, then ACW is factored into the average handle time. |
|
Interact |
The number of sessions where the user(s) interacted during message conversations. A session includes the point where the agent joins the message conversation to the point where they disconnect. |
|
Interval |
The time period. |
|
Wait |
The number of interactions that waited in the queue. |
|
Avg Flow-Out |
The average amount of time an interaction spends in queue before it flows out. Calculated by: Total Flow Out Time / Count of interactions with flow-outs For more information, see Queues Performance Summary view. |
|
Max Flow-Out |
The maximum amount of time an interaction spends in queue before it flows out. For more information, see Queues Performance Summary view. |
|
Min Flow-Out |
The minimum amount of time an interaction spends in queue before it flows out. For more information, see Queues Performance Summary view. |
Routing
For an overview of routing methods, see Routing and evaluation methods.
| Column | Description | Columns live update |
|---|---|---|
| Bullseye Requested | The number of interactions in which bullseye routing was requested. |
No |
| Bullseye Requested % | The rate of answered interactions in which bullseye routing was requested in comparison to all answered interactions. |
No |
| Bullseye Used | The number of answered interactions in which bullseye routing was used. |
No |
| Bullseye Used % | The rate of interactions in which bullseye routing was used in comparison to all answered interactions. |
No |
|
Conditional Requested |
The number of interactions in which conditional routing was requested. | No |
|
Conditional Requested % |
The rate of answered interactions in which conditional routing routing was requested in comparison to all answered interactions. | No |
|
Conditional Used |
The number of interactions in which conditional routing was used. | No |
|
Conditional Used % |
The rate of interactions in which conditional routing was used in comparison to all answered interactions. | No |
| Direct Requested | The number of interactions in which direct routing was requested. | No |
|
Direct Requested % |
The rate of answered interactions in which direct routing was requested in comparison to all answered interactions. | No |
|
Direct Used |
The number of answered interactions in which direct routing was used. | No |
|
Direct Used % |
The rate of interactions in which direct routing was used in comparison to all answered interactions. | No |
| Last Requested | The number of answered interactions in which last routing was used. See Last agent handling. |
No |
| Last Requested % | The rate of interactions in which last routing was requested in comparison to all answered interactions. See Last agent handling. |
No |
| Last Used | The number of answered interactions in which last routing was used. See Last agent handling. |
No |
| Last Used % | The rate of interactions in which last routing was used in comparison to all answered interactions. See Last agent handling. |
No |
| Manual Used | The number of answered interactions in which manual routing was used. |
No |
| Manual Used % | The rate of interactions in which manual routing was used in comparison to all answered interactions. |
No |
| Predictive Requested | The number of answered interactions in which predictive routing was requested. |
No |
| Predictive Requested % | The rate of interactions in which predictive routing was requested in comparison with all answered interactions. |
No |
| Predictive Used | The number of answered interactions in which predictive routing was used. |
No |
| Predictive Used % | The rate of interactions in which predictive routing was used in comparison with all answered interactions. |
No |
| Preferred Requested | The number of answered interactions in which preferred agent routing was used. |
No |
| Preferred Requested % | The rate of interactions in which preferred agent routing was requested in comparison with all answered interactions. |
No |
| Preferred Used | The number of answered interactions in which preferred agent routing was used. |
No |
| Preferred Used % | The rate of interactions in which preferred agent routing was used in comparison to all answered interactions. |
No |
| Standard Requested | The number of answered interactions in which standard routing was requested. |
No |
| Standard Requested % | The rate of interactions in which standard routing was requested in comparison to all answered interactions. |
No |
| Standard Used | The number of answered interactions in which standard routing was used. |
No |
| Standard Used % | The rate of interactions in which standard routing was used in comparison to all answered interactions. |
No |
Speech and text analytics
| Column | Column Description |
|---|---|
| Avg Sentiment | Average customer sentiment score (-100 to 100) in the specified interval with the provided filters. |
| Negative Sentiment Instances | The number of negative sentiment instances. For more information, see Understand sentiment analysis. |
| Overall Avg Sentiment Score | The average overall sentiment score of the interactions. Calculated by: oSentimentScore.sum / oSentimentScore.count |
| Positive Sentiment Instances | The number of positive sentiment instances. For more information, see Understand sentiment analysis. |
| Sentiment Instances | Number of instances of sentiment in the given interval with the provided filters. |
Surveys
| Column | Column Description |
|---|---|
| Response Rate | The number of surveys that customers complete compared with the total number of surveys sent. Surveys sent includes successfully delivered survey invitations and survey invitations that Genesys Cloud attempted to send but could not deliver due to an error, such as an invalid email address or invalid survey form. Calculated by: (Surveys Completed / Surveys Sent) * 100 |
| Sent | The number of surveys sent. This metric includes successfully delivered survey invitations and survey invitations that Genesys Cloud attempted to send but could not deliver due to an error, such as an invalid email address or invalid survey form. |
| In Progress | The number of surveys that customers opened but did not submit. This metric does not include surveys that customers opened but did not submit before the survey expired. |
| Complete | The number of surveys customers have opened and submitted. |
| Survey Abandon | The number of surveys that customers opened but did not submit before the survey expired. |
| Survey Expire | The number of surveys that expired before the customer opened it. |
| Survey Errors | The number of surveys that Genesys Cloud attempted but failed due to an error. The error includes errors in delivery such as an invalid email address, errors that occurred during the Survey Invite Flow, or other errors in the survey creation. |
| Avg Survey Score | The average of completed surveys' percentage scores. The average score does not include NPS. Calculated by (Sum of completed survey percentage scores / number of completed surveys) * 100 |
| Complaint |
The number of errors related to email recipient, system blocking, or identifying the survey sender as spam. |
| Outstanding |
The number of outstanding surveys. Calculated by (Number of surveys sent) – completed – expired – abandoned – bounced – complaints |
| NPS | The Net Promoter ScoreSM (NPS) of completed surveys. The score can range from -100 to 100. Calculated by (Promoters - Detractors) / number of responses) * 100 For more information about Promoters, Detractors, and NPS, see Net Promoter Score web survey question overview. |
| Full response | The number of full survey responses with all required questions that were answered by the customers. |
| Partial Response | The number of partial survey responses with any required questions that were unanswered by the customers. |
| Voice Survey | The number of voice surveys. |
| Web Survey | The number of web surveys. |
| Bounce | The number of times a survey was sent out and returned by the recipient's email server, usually caused by an invalid email address. |
Message Queue Performance Summary view
Performance
| Column | Description |
|---|---|
| Column | Column Description |
| Offer | The number of interactions routed into the queue for an agent to answer. Offered interactions are either answered, abandoned, or flow-out interactions. |
| Inbound Audio | The number of inbound audio or voice messages received from a customer. Notes: Since messaging is asynchronous, in rare instances, when an agent ends an interaction while an end customer finishes recording and sending a voice note, the last audio file attachment or voice note is not considered for analytics. The audio attachment of the conversation remains intact and is preserved as part of the conversation. There is no data loss. The agent still receives and views the voice note. You can see the impact only in the count of the inbound audio metric. The inbound audio metric can be undercounted. |
| Outbound Audio | The number of outbound audio or voice messages sent by an agent. |
| Avg Agent Response | The average time the agent takes to turn the conversation back to the customer. Calculated by (total average agent response time / total number of agent chat sessions). |
| Avg Customer Response | The average time the customer takes to turn the conversation back to the agent. Calculated by (total average customer response time / total number of customer chat sessions). |
| Total First Response | The total amount of time the agents take to send their first message after connecting to a chat. Calculated by the total duration between the agent's session connecting and the agent's first message sent. |
| Message Turns | The total number of times the conversation turns from one participant to another, that is, a complete communication where one person sends one or more messages and the other responds. |
| Avg Time to First Response | The average amount of time the agents take to send their first message after connecting to a chat. Calculated from the duration between the agent's session connecting and the agent's first message sent. Calculated by (the total duration of time of first response messages / the total number of first response messages). Messages from the bots are not considered for calculation. |
| Total First Engagement | The time the customer takes to receive an engagement from an agent. It is determined from the time difference between the first customer message at the beginning of the chat and the first message that they received from an agent. Messages from the bots are not considered for calculation. |
| Avg Time to First Engagement | The average time it takes for a customer to receive an engagement from an agent. Calculated by (the total duration between the customer's first message and the first agent response / the number of first engagements). Messages from the bots are not considered for calculation. |
| Avg Message Turns | The average amount of the back and forth messages per conversation session. Calculated by (the total number of message turns / the total count of number of message turns). |
| Answer % | The percentage of offered interactions that an agent answered. Calculated by: (Answered / Offered) * 100 |
| Outbound | This metric represents the number of outbound interactions placed on behalf of queue. |
| Flow-Out | Flow-outs are interactions that enter and leave a queue without getting answered by an agent and without getting disconnected. Flow-outs are an indication of customer service level and queue productivity. High numbers of flow-outs can indicate staffing issues or ineffective agents when used with high handle times (bullseye matching metrics). Flow-outs can include transfers to voicemail, callbacks, and any system-driven events such as in-queue flows that transfer to another queue or external party after a certain amount of time. Flow-outs can also occur if the caller opts to exit out of the queue and return to the IVR. Offered interactions are either flow-out, answered, or abandoned interactions. |
| ASA | The average amount of time an interaction waits in the queue before an agent answers. This metric does not include interactions that agents do not answer. Average Speed of Answer (ASA) is directly associated with the service level and provides insight into the customer service your organization provides. ASA is recorded in the interval in which the agent answered the interaction. Calculated by: Total Answered (tAnswered Sum) / Answered Count (tAnswered Count) Note: Raw values are provided in milliseconds. |
| Service Level % |
Service level target is a contact center performance statistic expressed as “X percent of conversations answered in Y seconds.” For example, a goal of answering 80% of voice calls within 20 seconds provides a service level target of 80/20. You can set the service level target for each media type in a queue. Analytics uses this service level target to calculate whether you are within the service level % defined by your service level agreement (SLA). For more information about setting the service level target, see Create queues or Edit or delete queues. Note: In the performance views that are not queue-specific, the Service Level % is calculated by queue and displayed as a – on the aggregated group row since SLA targets vary by queue. The affected views are DNIS Performance Summary and Skills Performance views. To view individual queue service level %, click the + to expand the row.
The service level % is the percentage of interactions that meet your contact center's service level target. The formula to calculate the service level % is:
Number of Conversations Answered within SLA The numerator is calculated by taking the total answered conversations and subtracting the conversations that were not answered within the SLA threshold. Calculated by: (Answered Count – SLA Violation Count) Total Number of Conversations The Service Level Options configuration determines the denominator. With all the options below unchecked, the denominator is the count of answered conversations.
As the service level calculation depends on an organization’s configured options, the final formula to calculate the service level is:
Notes:
In this view, the service level set for the queue appears as a gray number beside the service level percentage for the interval. If the service level percentage for the interval is lower than the set service level, then the service level percentage is red. |
| Avg Wait | The average amount of time an interaction is in a queue before an agent answers it, before the interaction moves out of the queue, or before the customer abandons the interaction. Calculated by: Total Wait Time / Interactions |
| Handle | The total number of ACD and non-ACD interactions that agents were involved in for the selected media type. Handle increments in the interval in which the interaction ends, after the agent completes any after call work and completes the interaction. |
| Avg Handle |
The average amount of time agents spent handling interactions. This calculation includes talk time, hold time, and after-call work. For outbound calls it also includes dialing and contacting time. Calculated by: (cumulative talk time + cumulative hold time + cumulative after-call work + cumulative dialing time + cumulative contacting time) / Number of interactions handled Note: The interactions can span multiple time intervals. For example, a 45-minute call spans two 30-minute intervals. However, metrics are assigned a single timestamp and reported in the interval into which this timestamp falls. The timestamps are assigned based on when the metric calculation is complete.
For instance, handle time will use the timestamp of after call work completion. In the example of a 45-minute call, the handle time falls in the second 30-minute interval because the handle time was calculated at the end of the call when ACW was submitted. In these views, the Avg Talk, Avg Hold, and Avg ACW columns do not equal the Avg Handle column because only some interactions include holds. This view calculates the average handle column using cumulative counts rather than averages. |
| Avg Interact | The average number of seconds spent interacting on a message. |
| Avg ACW | The average amount of time agents spent completing after-call work. Calculated by: Total ACW / Interactions with ACW |
| Total Handle |
The total amount of time agents spend on an interaction including time spent contacting, time spent dialing, talk time, hold time, and after call work. Sometimes, as after-call work overlaps with the talk time or the hold time, this sum of the cumulative metrics represented in Total Handle is not the same as the Handle metric, which eliminates any overlap. |
| Total Interact | The total amount of time spent interacting on all the message conversations by the agent, within an interval. |
| Total ACW | The cumulative time spent in after-call work (ACW) on all interactions. After-call work is the work that an agent performs immediately following an interaction. Work may involve keying activity codes, updating customer databases, filling out forms, or initiating outbound contact. As a metric, it indicates the total time an agent takes to finish working on a call. If an agent must complete work before the agent can handle the next contact, then ACW is factored into the average handle time. |
| Transfer | A measurement of the number of interactions an agent answered in one queue and then transferred. A transfer counts for the queue in which an agent answers the interaction. This measurement is calculated by the number of interactions blind transferred or consult transferred. |
| Blind Transfer | The number of interactions an agent answered in one queue and then blind transferred. A blind transfer counts for the queue in which an agent answers the interaction. |
| Total Wait | The total amount of time an interaction is in a queue before an agent answers it, it flows out, or the customer abandons it. Genesys Cloud calculates the wait time in milliseconds. |
| Connection | The number of interactions that initially connected to the contact center in a particular location, such as a queue or IVR. |
| Division | Displays the name of a division that an agent or queue belongs to. For more information, see About access control. |
| Inbound Media | The count of inbound media for an interaction. |
| Transfer % | The number of transfers compared with the total number of interactions answered. Calculated by: (No. of transfers / interactions answered) * 100 |
| Max Wait | The maximum amount of time spent waiting in queue for the selected interval. |
| Min Wait | The minimum amount of time spent waiting in queue for the selected interval. |
| Max Interact | The maximum amount of time spent interacting on a message for the selected interval. |
| Min Interact | The minimum amount of time spent interacting on a message for the selected interval. |
| Max ACW | The maximum amount of time spent on after call work for the selected interval. |
| Min ACW | The minimum amount of time spent on after call work for the selected interval. |
| Over SLA | Number of interactions that were over the defined Service Level. |
| Met SLA | Number of interactions that met the defined service level. |
| Outbound Attempt | Attempted outbound interactions for Dialer campaigns. |
| Error | The number of errors that occurred on the queue conversations. |
| SL % | The service level percentage for the queue. |
| SL Target % | The service level target percentage for the queue. |
| Avg ACW Handled | The average time any interaction spent in ACW. This calculation takes into account all interactions handled, not just those that had ACW. Calculated by: Total ACW Time / Number of Interactions Handled |
| Outbound Media | The number of outbound media for an interaction. |
|
ACW |
The number of times after-call work (ACW) was completed. After-call work is the work that an agent performs immediately following an interaction. Work may involve keying activity codes, updating customer databases, filling out forms, or initiating outbound contact. As a metric, it indicates the total time an agent takes to finish working on a call. If an agent must complete work before the agent can handle the next contact, then ACW is factored into the average handle time. |
|
Interact |
The number of sessions where the user(s) interacted during message conversations. A session includes the point where the agent joins the message conversation to the point where they disconnect. |
|
Wait |
The number of interactions that waited in the queue. |
|
Avg Flow-Out |
The average amount of time an interaction spends in queue before it flows out. Calculated by: Total Flow Out Time / Count of interactions with flow-outs For more information, see Queues Performance Summary view. |
|
Max Flow-Out |
The maximum amount of time an interaction spends in queue before it flows out. For more information, see Queues Performance Summary view. |
|
Min Flow-Out |
The minimum amount of time an interaction spends in queue before it flows out. For more information, see Queues Performance Summary view. |
| ID | The specific conversation ID for the interaction. |
|
Name |
The name of the queue. |
Routing
For an overview of routing methods, see Routing and evaluation methods.
| Column | Description | Columns live update |
|---|---|---|
| Bullseye Requested | The number of interactions in which bullseye routing was requested. |
No |
| Bullseye Requested % | The rate of answered interactions in which bullseye routing was requested in comparison to all answered interactions. |
No |
| Bullseye Used | The number of answered interactions in which bullseye routing was used. |
No |
| Bullseye Used % | The rate of interactions in which bullseye routing was used in comparison to all answered interactions. |
No |
|
Conditional Requested |
The number of interactions in which conditional routing was requested. | No |
|
Conditional Requested % |
The rate of answered interactions in which conditional routing routing was requested in comparison to all answered interactions. | No |
|
Conditional Used |
The number of interactions in which conditional routing was used. | No |
|
Conditional Used % |
The rate of interactions in which conditional routing was used in comparison to all answered interactions. | No |
| Direct Requested | The number of interactions in which direct routing was requested. | No |
|
Direct Requested % |
The rate of answered interactions in which direct routing was requested in comparison to all answered interactions. | No |
|
Direct Used |
The number of answered interactions in which direct routing was used. | No |
|
Direct Used % |
The rate of interactions in which direct routing was used in comparison to all answered interactions. | No |
| Last Requested | The number of answered interactions in which last routing was used. See Last agent handling. |
No |
| Last Requested % | The rate of interactions in which last routing was requested in comparison to all answered interactions. See Last agent handling. |
No |
| Last Used | The number of answered interactions in which last routing was used. See Last agent handling. |
No |
| Last Used % | The rate of interactions in which last routing was used in comparison to all answered interactions. See Last agent handling. |
No |
| Manual Used | The number of answered interactions in which manual routing was used. |
No |
| Manual Used % | The rate of interactions in which manual routing was used in comparison to all answered interactions. |
No |
| Predictive Requested | The number of answered interactions in which predictive routing was requested. |
No |
| Predictive Requested % | The rate of interactions in which predictive routing was requested in comparison with all answered interactions. |
No |
| Predictive Used | The number of answered interactions in which predictive routing was used. |
No |
| Predictive Used % | The rate of interactions in which predictive routing was used in comparison with all answered interactions. |
No |
| Preferred Requested | The number of answered interactions in which preferred agent routing was used. |
No |
| Preferred Requested % | The rate of interactions in which preferred agent routing was requested in comparison with all answered interactions. |
No |
| Preferred Used | The number of answered interactions in which preferred agent routing was used. |
No |
| Preferred Used % | The rate of interactions in which preferred agent routing was used in comparison to all answered interactions. |
No |
| Standard Requested | The number of answered interactions in which standard routing was requested. |
No |
| Standard Requested % | The rate of interactions in which standard routing was requested in comparison to all answered interactions. |
No |
| Standard Used | The number of answered interactions in which standard routing was used. |
No |
| Standard Used % | The rate of interactions in which standard routing was used in comparison to all answered interactions. |
No |
Speech and text analytics
| Column | Column Description |
|---|---|
| Avg Sentiment | Average customer sentiment score (-100 to 100) in the specified interval with the provided filters. |
| Negative Sentiment Instances | The number of negative sentiment instances. For more information, see Understand sentiment analysis. |
| Overall Avg Sentiment Score | The average overall sentiment score of the interactions. Calculated by: oSentimentScore.sum / oSentimentScore.count |
| Positive Sentiment Instances | The number of positive sentiment instances. For more information, see Understand sentiment analysis. |
| Sentiment Instances | Number of instances of sentiment in the given interval with the provided filters. |
Surveys
| Column | Column Description |
|---|---|
| Response Rate | The number of surveys that customers complete compared with the total number of surveys sent. Surveys sent includes successfully delivered survey invitations and survey invitations that Genesys Cloud attempted to send but could not deliver due to an error, such as an invalid email address or invalid survey form. Calculated by: (Surveys Completed / Surveys Sent) * 100 |
| Sent | The number of surveys sent. This metric includes successfully delivered survey invitations and survey invitations that Genesys Cloud attempted to send but could not deliver due to an error, such as an invalid email address or invalid survey form. |
| In Progress | The number of surveys that customers opened but did not submit. This metric does not include surveys that customers opened but did not submit before the survey expired. |
| Complete | The number of surveys customers have opened and submitted. |
| Survey Abandon | The number of surveys that customers opened but did not submit before the survey expired. |
| Survey Expire | The number of surveys that expired before the customer opened it. |
| Survey Errors | The number of surveys that Genesys Cloud attempted but failed due to an error. The error includes errors in delivery such as an invalid email address, errors that occurred during the Survey Invite Flow, or other errors in the survey creation. |
| Avg Survey Score | The average of completed surveys' percentage scores. The average score does not include NPS. Calculated by (Sum of completed survey percentage scores / number of completed surveys) * 100 |
| Complaint |
The number of errors related to email recipient, system blocking, or identifying the survey sender as spam. |
| Outstanding |
The number of outstanding surveys. Calculated by (Number of surveys sent) – completed – expired – abandoned – bounced – complaints |
| NPS | The Net Promoter ScoreSM (NPS) of completed surveys. The score can range from -100 to 100. Calculated by (Promoters - Detractors) / number of responses) * 100 For more information about Promoters, Detractors, and NPS, see Net Promoter Score web survey question overview. |
| Full response | The number of full survey responses with all required questions that were answered by the customers. |
| Partial Response | The number of partial survey responses with any required questions that were unanswered by the customers. |
| Voice Survey | The number of voice surveys. |
| Web Survey | The number of web surveys. |
| Bounce | The number of times a survey was sent out and returned by the recipient's email server, usually caused by an invalid email address. |
My Assigned Evaluations view
Interactions Needing Attention
Completed Interactions
| Column | Description |
|---|---|
|
Assigned Date/Time
|
The date and time when the evaluation was assigned to you. |
|
Release Date/Time
|
The date and time when the evaluation was released to the agent to review. |
| Agent | The name of the evaluated user. |
|
Evaluation Form
|
The name of the evaluation form used to score the interaction. |
| Score | Displays the total score for the evaluation. |
| Calibration | Displays whether the evaluation is a calibration or not.
|
My Development view
| Column | Description |
|---|---|
| Column | Description |
| Assigned By | The name of the user who assigned the coaching appointment or learning module. |
| Assigned Date | The start date and time for the coaching appointment or learning module. |
| Assigned To | The name of the agent that the coaching appointment or learning module is assigned to. |
| Completion Date | The date the coaching appointment or learning module was completed. |
| Development Type | Displays Coaching for coaching appointments, Learning for learning modules, Assessment for standalone assessments, or Learning with Assessment for learning modules with assessments. |
| Due Date | The target date of completion for the coaching appointment or learning module. |
| Facilitator | The user responsible for leading the coaching appointment, or assigning the informational learning module to an agent. |
| Name | The name of the coaching session or the name of the learning module. |
| Overdue |
Displays Yes for coaching appointments and learning modules that have an elapsed completion date. Displays No for coaching appointments and learning modules that do not have an elapsed completion date. |
| Status | Displays the current status for a coaching appointment or for a learning module. Possible statuses are: Completed, In Progress, Invalid Schedule, and Planned. |
| Result | Displays the assessment result for the agent. Possible statuses are Pass or Fail. |
| Score | Displays the assessment score of the agent. Score is shown in percentage. |
My Evaluations view
| Column | Description |
|---|---|
| Release Date/Time | The date and time that the evaluation was released for the agent to view. Click the time to open the evaluation. |
| Score | The overall evaluation score based upon an evaluator's responses on an evaluation form. |
| Critical Score | The evaluation score based upon an evaluator's responses to critical questions on the evaluation form. |
| Evaluation Form Name | The name of the evaluation form used to score the agent. |
| Evaluator | The name of the person who completed the evaluation. |
| Reviewed By Agent | Whether the agent has reviewed the evaluation. |
| Interaction Date / Time | The date and time of the interaction. |
| Evaluation Date / Time | The date and time of the evaluation. |
| Media Type | The media type of the interaction. |
My Interactions view
Note: Some metrics in the view may not equal the duration. For example, if two agents are on a call at the same time for two minutes, Total Talk equals four minutes, even though the Conversation Duration may be less than four minutes. If an outbound interaction spent time in a contacting state before connecting to an agent, Talk Time may be less than Conversation Duration.
Interactions
| Column | Description |
|---|---|
| Column | Description |
| Media Type | The type of media used. |
| Inbound Audio | The number of inbound audio or voice messages received from a customer. Notes: Since messaging is asynchronous, in rare instances, when an agent ends an interaction while an end customer finishes recording and sending a voice note, the last audio file attachment or voice note is not considered for analytics. The audio attachment of the conversation remains intact and is preserved as part of the conversation. There is no data loss. The agent still receives and views the voice note. You can see the impact only in the count of the inbound audio metric. The inbound audio metric can be undercounted. |
| Outbound Audio | The number of outbound audio or voice messages sent by an agent. |
| MOS | The estimated average Mean Opinion Score (MOS) for the voice interaction among all the audio streams within the conversation. MOS is a measure of audio quality at specific measurement points of a voice interaction. Potential measurement points include premises-based and cloud-based Edge devices. The measurement is based on codec type, average jitter, latency, and packet loss. Genesys Cloud displays the lowest MOS for each communication that occurs during the whole call. MOS ranges from 1 (bad) to 5 (excellent). Scores below 3.5 indicate unacceptable quality, and scores above 4.3 indicate high quality. |
| Media | The total number of inbound and outbound media for an interaction. |
|
Fax |
Displays Yes if a fax was present during the interaction. Displays No if a fax was not present during the interaction. |
| Group Ring | Displays the group name for the voice interactions alerted via group ring. |
| Users | The internal users alerted or involved. |
| Remote |
Information about the external participants. Note: PII is masked in this view.
|
| Date | The date the interaction started. |
| Conversation Duration |
The length of the interaction. Calculated by: (Conversation End – Conversation Start) |
| Direction | Whether the interaction was inbound, outbound, or inbound/outbound. |
| Initial Direction | Whether the interaction started as inbound or outbound. |
| ANI |
The number of the person who dialed. Note: PII is masked in this view.
|
| DNIS |
The original number dialed for the interaction. Note: PII is masked in this view.
|
| Queue | The associated queues. |
| Wrap-up | The wrap-up code selected by the agent. |
| Transferred | Indicates interactions transferred. A transfer counts for the queue in which an agent answers the interaction. |
| Abandoned | Whether a customer abandoned the interaction or not. |
| Abandoned in Queue | The name of the queue in which the Abandon occurred. |
| Agent Assist |
Whether an interaction had Agent Assist or not. |
| To |
The email address or SMS number to which the interaction is sent to. Note: PII is masked in this view.
|
| From |
The email address or SMS number from which the interaction is sent. Note: PII is masked in this view.
|
| Flagged | Indicates calls flagged for voice quality issues. For more information about flagging calls, see Flag a problematic voice interaction or Flag a problematic phone call. |
| Wrap-up Notes | Whether an agent wrote a wrap-up note or not. If the agent wrote a note, a preview of the note displays when you hover over the column. |
| Blind Transferred | Whether the interaction had a blind transfer. |
| Barged-in | Indicates whether a supervisor barged into the conversation. |
| Cleared by Customer | Indicates whether the conversation was cleared by the customer. |
| Coached | Indicates whether a supervisor coached on the conversation. |
| Co-browse | Whether the interaction had a co-browse session. |
| Consulted | Whether the interaction had a consult. |
| Consult Transferred | Whether the interaction had a consult transfer. |
| Conversation ID | The specific conversation ID for the interaction. |
| Division | Displays the divisions associated with the interaction. See About access control. |
| End Date | The time and date the interaction ended. This column is blank if the interaction is still in progress. |
| Message Type | The ACD message type used. |
| Non-ACD | Whether the interaction involved ACD. |
| Recording | Yes indicates that the conversation was initially recorded at the external trunk by the Edge. It does not consider whether the customer's policies actually retained it. No indicates that the conversation was not recorded at the external trunk by the Edge. N/A indicates a digital interaction. |
| Screen Share | Whether the interaction contains a screen share session. |
| SIP Call ID | Displays the globally unique identifier embedded in all SIP requests and responses for the interaction. |
| Users – Alerted | The agents Genesys Cloud alerted for the interaction. |
| Users – Interacted | The users who actually interacted during the interaction. |
| Voicemail | Whether the interaction has voicemail. Includes personal and queue voicemail. |
| Session DNIS |
Any DNIS number dialed during the interaction, including the original DNIS number. Note: PII is masked in this view.
|
| Inbound Media | The count of inbound media for an interaction. |
| Has Media | Whether the interaction has media content. |
| Provider | The source provider for the conversation. For example, Genesys Cloud EMAIL, Edge, and so on. |
| Emails Sent | Count of the number of emails sent by an agent, including Reply All and Forward. |
| First Queue | First queueID in the conversation, formatted as name. |
| Last Wrap-Up | The last wrap-up code used on the conversation. |
| Disconnect Type | The reason the interaction got disconnected.
|
| Subject | First instance of an email subject in the conversation. |
| Flow-Out Type | Shows the type of flowout for a conversation that was a flowout from a queue. |
| Outbound Media | The number of outbound media for an interaction. |
| Users – Not Responding | The agents who did not answer the interaction, and the agent may have transitioned to Not Responding. |
| Authenticated | Yes for an authenticated web messaging interaction, No for a web messaging interaction that is not authenticated, or N/A if not a web messaging interaction. |
|
Delivery Status |
The status of the attempted delivery of email, SMS, and WhatsApp messages. The Email delivery status is available for the agentless emails sent via the email campaigns or Agentless Email Notification API. The SMS delivery status is available for all outbound SMS messages including agentless and agent-sent SMS messages. The WhatsApp delivery Status is available for all inbound and outbound WhatsApp messages, including agentless and agent-sent WhatsApp messages. Supported Delivery Status metrics for email and SMS messages include: Supported Delivery Status metrics for WhatsApp messages include: |
|
Delivery Status Details |
Additional details about the delivery, including engagement metrics. For more information, see SMS delivery receipts, Email delivery receipts, and WhatsApp delivery receipts. |
|
Conversation Initiator |
Displays interactions initiated by a selected initiator (external, user, workflow, customer, or agent). |
|
Customer Participation |
Displays email and message interactions during which a customer participated, or a customer did not participate. |
| Parked | Displays if the interaction has been parked. |
| Social Classification | Displays the type of social listening data such as Public or Private. Lists one value for each interaction. The social listening data is classified as public or private based on the type of first conversation received. For example:
|
Routing
| Column | Description |
|---|---|
| Column | Description |
| Direct Routing | Indicates whether Direct Routing was requested and/or used. |
| Manual Agents Assigned | On-queue agents who were manually assigned this waiting interaction. |
| Manual Assigner | User with the appropriate permissions who manually assigned this interaction to a waiting agent in the queue. |
Metrics
| Column | Description |
|---|---|
| Column | Description |
|
Callback – Time to first connect |
The amount of time between the start of the callback ACD and the start of the first interaction segment on the voice channel. Note: This metric tracks the time from ACD to agent connect. If a callback is directly transferred from one agent to another agent, the callback is not associated with that ACD queue, and the time to connect is not calculated. |
|
Callback – Time to first dial |
The amount of time between the start of the callback ACD and the start of the first dialing segment on the voice channel. Note: This metric tracks the time from ACD to agent dial. If a callback is directly transferred from one agent to another agent, the callback is not associated with that ACD queue, and the time to dial is not calculated. |
| Messages | The total number of individual messages exchanged during a conversation. This number includes both the inbound and outbound messages sent by both the customer and the agent. |
| Avg Agent Response | The average time the agent takes to turn the conversation back to the customer. Calculated by (total average agent response time / total number of agent chat sessions). |
| Avg Customer Response | The average time the customer takes to turn the conversation back to the agent. Calculated by (total average customer response time / total number of customer chat sessions). |
| Total First Response | The total amount of time the agents take to send their first message after connecting to a chat. Calculated by the total duration between the agent's session connecting and the agent's first message sent. |
| Message Turns | The total number of times the conversation turns from one participant to another, that is, a complete communication where one person sends one or more messages and the other responds. |
| Avg Time to First Response | The average time the agent takes to send a message once they connect to the conversation. |
| Total First Engagement | The time the customer takes to receive an engagement from an agent. It is determined from the time difference between the first customer message at the beginning of the chat and the first message that they received from an agent. Messages from the bots are not considered for calculation. |
| Avg Time to First Engagement | The average time it takes for a customer to receive an engagement from an agent. Calculated by (the total duration between the customer's first message and the first agent response / the number of first engagements). Messages from the bots are not considered for calculation. |
| Avg Message Turns | The average amount of the back and forth messages per conversation session. Calculated by (the total number of message turns / the total count of number of message turns). |
| Alert Segments | The number of alerts. |
| Blind Transfers | The number of interactions an agent answered in one queue and then blind transferred. A blind transfer counts for the queue in which an agent answers the interaction. |
| Consults | The number of interactions an agent answered and then consulted with another participant with or without fully transferring the interaction. A consult counts for the queue in which an agent answers the interaction, even if they consult with another queue. |
| Consult Transfers | The number of call interactions an agent answered in one queue and then consult transferred, meaning they connected with a person or queue before transferring the call. A consult transfer counts for the queue in which an agent answers the interaction. See Consult transfer a call. |
| Contacting Segments | The number of times during an interaction where the system was connecting to the agent’s phone before dialing out. |
| Inbound Messages | The number of individual messages exchanged during a conversation where the session’s direction is inbound. It includes all messages sent by both the customer and the agent. |
| Outbound Messages | The number of individual messages exchanged during a conversation where the session’s direction is outbound. It includes all messages sent by both the customer and the agent. |
| Inbound SMS/MMS Segments | The number of message segments based on their segment count. |
| Outbound SMS/MMS Segments | The number of message segments based on their segment count. |
| Agentless Emails | The number of emails sent by a campaign excluding the emails sent by an agent. |
| Dialing Segments | The number of times during an interaction that the system dials out. |
| Hold Segments | The number of times the agent places the customer on hold. |
| IVR Segments | The number of times the interaction enters an IVR. |
| Queue Segments | The number of times an interaction enters a queue. For example, if an agent accepts an interaction in queue A, transfers it to queue B, and then an agent transfers the interaction back to queue A, then Queue Segments equal 3. |
| Talk Segments | The number of times an agent and customer talk. For example, in an interaction where an agent accepts an interaction, talks to the customer, places the customer on hold, and then talks the customer again, the Talk Segment equals 2. |
| Total ACW | The cumulative time spent in after-call work (ACW) on all interactions. After-call work is the work that an agent performs immediately following an interaction. Work may involve keying activity codes, updating customer databases, filling out forms, or initiating outbound contact. As a metric, it indicates the total time an agent takes to finish working on a call. If an agent must complete work before the agent can handle the next contact, then ACW is factored into the average handle time. |
| Total Alert | The total time Genesys Cloud alerts agents before the agent accepts or declines an interaction. |
| Total Contacting | The total time an interaction spent connecting to the agent’s phone before dialing out. |
| Total Dialing | The total time spent dialing out. |
| Total Handle | The total amount of time agents spend on an interaction including time spent contacting, time spent dialing, talk time, hold time, and after call work. |
| Total Hold | The total amount of time the customer was on hold. |
| Total IVR | The total amount of time that interactions spent in IVRs. |
| Total Queue | The amount of time the interaction spent waiting on an Automatic Call Distributor before connecting to an agent. |
| Total Talk | The total amount of time spent interacting on all the conversations by the agent, within an interval. For example, in an interaction, where an agent accepts an interaction, talks to the customer for two minutes, places the customer on hold for one minute, and then talks to the customer again for two minutes, the Total Talk equals 4 minutes. |
| Transfers | A measurement of the number of interactions an agent answered in one queue and then transferred. A transfer counts for the queue in which an agent answers the interaction. This measurement is calculated by the number of interactions blind transferred or consult transferred. |
| Time to Abandon | The duration of time until the conversation was abandoned. |
| Total Barge-In | Total time spent barging into the conversation. |
| Total Coaching | Total time spent coaching in the conversation. |
| Total Voicemail | Total duration of voicemails included in the conversation. |
| User Segments | The number of times an agent (user) was on an interaction. For example, if agent A answered an email interaction twice, and agent B answered the same email interaction once, then user segments would be 3. |
| Wrap-up Segments | The number of times an interaction was in wrap-up. |
| Total Monitor | Total time that the user spent monitoring interactions. |
| Error Count | The number of errors for the interaction. |
| Active Total Callback | Active total callback duration is the sum of all calling activity for the call portions of the callback. For example, the active total callback duration could include all durations from the call portion of a callback: tContacting --> tDialing --> tTalk --> tHeld --> tTalk --> tAcw. |
| External Tag | Displays the external tag that is attached to the conversation record. Note: This data is not available for web chat interactions. |
| Active Park | Displays the duration of the interaction that is currently parked. |
| Total Park | Displays the total parked duration of the completed interaction. |
| Not Responding | The number of times an agent did not respond to the interaction. |
Surveys
| Column | Description |
|---|---|
| Column | Description |
| Has Survey Data | Whether an interaction is associated with survey data. |
| Promoter Score | The promoter score given by a survey respondent in a survey. Genesys Cloud uses the promoter score to calculate the survey’s overall NPS. For more information about NPS, see Net Promoter Score web survey question overview. |
| Survey Form | The name of the survey form sent. |
| Survey Score | The completed surveys’ percentage score. The score does not include NPS. |
| Survey Status |
Displays the status of the survey:
|
| Surveys | The number of surveys sent related to the interaction. |
| Survey Type | Displays the type of the survey, such as voice or web. One value is listed for each survey that is associated with the interaction. |
Evaluations
| Column | Description |
|---|---|
| Column | Description |
| Evaluated Agent | A comma-separated list of names of evaluated agents for any associated evaluations. |
| Evaluation Assignee | A comma-separated list of names of evaluation assignees for the associated evaluations. |
| Evaluation Created | Whether the interaction has an evaluation associated with it. |
| Evaluation Critical Score | The status and value of the evaluation critical score. See Evaluation scoring. |
| Evaluation Score | The score for any associated evaluations. |
| Evaluation Status | The status for any associated evaluations. |
| Evaluator | A comma-separated list of names of evaluators for the associated evaluations. |
Outbound
| Column | Description |
|---|---|
| Column | Description |
| Campaign Name | The name of the campaign associated with the interaction. |
| Contact List | The name of the contact list associated with the interaction. |
| Contact ID | The contact ID associated with the interaction. |
| Call Analysis Result |
The type of call detected based on call analysis. Results include disconnect, live voice, busy, machine, no answer, SIT callable, fax, line connected, speech, SIT uncallable, and not found. |
| Outbound Attempt | The number of attempts made to call the customer. |
| Campaign | Whether an interaction has a campaign associated with it. |
| Campaign Start | The start date of the first outbound call of a campaign. |
| Time to Flow | The amount of time it took for the campaign call to enter a flow. |
| Time to Agent | The amount of time it took for the campaign call to reach an agent. |
| Campaign Caller Name | The name of the customer being called by the campaign. |
Flows
| Column | Description |
|---|---|
| Column | Description |
| All Flow Disconnect | The total number of times a flow disconnected entries, including: Customer Disconnects, Flow Disconnects, and System Error Disconnects. |
| Customer Disconnect | The number of times customers disconnected in a flow, including the percentage of customer disconnects compared with the disconnect count. |
| Customer Short Disconnect | The number of times customers disconnected in a flow before a short disconnect time. Includes the percentage of customer short disconnects compared with the disconnect count. The default short disconnect time is less than 10 seconds, though administrators can set the short disconnect time to any threshold they want. For more information, see the Configure analytics settings section in Configure contact center analytics options. |
| Failed Outcomes | Displays a list of failed flow outcomes for the interaction. |
| Flow | The name of the flow that the interaction used. |
| Flow Disconnect | The number of times a flow disconnected entries, including the percentage of flow disconnects compared with the total number of disconnects. |
| Flow Exit | The number of times an entry exited a flow to another flow. Includes the percentage of flow exits compared with the total number of exits. |
| Incomplete Outcomes | Displays a list of incomplete flow outcomes for the interaction. |
| Outcome Attempts | The number of flow outcomes in the interaction. |
| Outcome Failure | The number of flow outcomes that were failures. Includes the percentage of failure outcomes compared with the total number of outcomes. |
| Outcome Success | The number of flow outcomes that were success. Includes the percentage of success outcomes compared with the total number of outcomes. |
| Successful Outcomes | Displays a list of successful flow outcomes for the interaction. |
| System Error Disconnect | The number of times entries disconnected in a flow due to a system error. This column includes the percentage of system error disconnects compared with the total number of disconnects. |
Journey
| Column | Description |
|---|---|
| Column | Description |
| Has Customer Journey Data | Whether an interaction has Predictive Engagement customer journey data associated with it. |
| Proactive | Whether Predictive Engagement offered a chat during a customer’s website visit based on the Predictive Engagement action map settings. |
External Contact
| Column | Description |
|---|---|
| Column | Description |
| External Contact | Displays the first and last name of the contact. |
| External Organization | Displays the organization name. |
My Performance view
| Column | Description | Columns live update |
|---|---|---|
| Answer | A measurement of the number of assigned ACD interactions answered by an agent in a given period. Answered increments when the agent is the first to connect to the interaction. |
Yes |
| Handle | The total number of ACD and non-ACD interactions that agents were involved in for the selected media type. Handle increments in the interval in which the interaction ends, after the agent completes any after call work and completes the interaction. |
Yes |
| Avg Handle | The average amount of time agents spent handling interactions. This calculation includes talk time, hold time, and after-call work. For outbound calls it also includes dialing and contacting time. Calculated by: (cumulative talk time + cumulative hold time + cumulative after-call work + cumulative dialing time + cumulative contacting time) / Number of interactions handled Note: The interactions can span multiple time intervals. For example, a 45-minute call spans two 30-minute intervals. However, metrics are assigned a single timestamp and reported in the interval into which this timestamp falls. The timestamps are assigned based on when the metric calculation is complete.
For instance, handle time will use the timestamp of after call work completion. In the example of a 45-minute call, the handle time falls in the second 30-minute interval because the handle time was calculated at the end of the call when ACW was submitted. |
Yes |
| Avg Talk | The average number of seconds spent interacting on a media type. Calculated by: Total Talk time / Count of interactions with Talk time |
Yes |
| Avg Hold | The average number of seconds that interactions were placed on hold. Calculated by: Total Hold Time / Count of interactions with holds |
Yes |
| Avg ACW | The average amount of time agents spent completing after-call work. Calculated by: Total ACW / Interactions with ACW |
Yes |
| Avg Dialing | The average amount of time an agent spends dialing and waiting for a contact to answer during outbound interactions.
Calculated by: (total dialing time/ total number of dialing segments) |
Yes |
| Avg Contacting | The average amount of time an outbound interaction takes to connecting to the agent’s phone. Usually, this duration is short. However, if the agent uses a remote phone the duration may be longer. |
Yes |
| Total Handle | The total amount of time agents spend on an interaction including time spent contacting, time spent dialing, talk time, hold time, and after call work. |
Yes |
| Total Talk | The total amount of time spent interacting on all the conversations by the agent, within an interval. For example, in an interaction, where an agent accepts an interaction, talks to the customer for two minutes, places the customer on hold for one minute, and then talks to the customer again for two minutes, the Total Talk equals 4 minutes. |
Yes |
| Total Hold | The cumulative hold time for all interactions. |
Yes |
| Total ACW | The cumulative time spent in after-call work (ACW) on all interactions. After-call work is the work that an agent performs immediately following an interaction. Work may involve keying activity codes, updating customer databases, filling out forms, or initiating outbound contact. As a metric, it indicates the total time an agent takes to finish working on a call. If an agent must complete work before the agent can handle the next contact, then ACW is factored into the average handle time. |
Yes |
| Total Dialing | The total amount of time an outbound interaction spends dialing a contact. |
Yes |
| Total Contacting | The total amount of time outbound interactions take to connect to the agent’s phone. Usually, this duration is short. However, if the agent uses a remote phone the duration may be longer. |
Yes |
| Error | The number of errors that occurred on conversations. |
Yes |
| Hold | The number of interactions with holds. |
Yes |
| Transfer | A measurement of the number of interactions an agent answered in one queue and then transferred. A transfer counts for the queue in which an agent answers the interaction. This measurement is calculated by the number of interactions blind transferred or consult transferred. |
Yes |
| Outbound | This metric represents the number of outbound interactions placed on behalf of queue. |
Yes |
| Alert – No Answer | The number of times an agent was alerted to a conversation but did not answer the conversation. Note: This metric does not specifically count the number of times an agent was placed in a Not Responding routing status. An agent is transitioned to Not Responding status after a specific alert time threshold for ACD-routed conversations. Alert – No Answer can be incremented for all conversation types for any situation where an alert was not followed by an answer event. |
Yes |
| Total Alert – No Answer | The total number of seconds Genesys Cloud offered an agent an interaction before the agent declined the interaction or the interaction timed out. |
Yes |
| Alert | The number of times agents receive an alert for interactions. |
Yes |
| Total Alert | The total time Genesys Cloud alerts agents before the agent accepts or declines an interaction. |
Yes |
| Transfer % | The number of transfers compared with the total number of interactions answered. Calculated by: (No. of transfers / interactions answered) * 100 |
Yes |
|
ACW |
The number of times after-call work (ACW) was completed. After-call work is the work that an agent performs immediately following an interaction. Work may involve keying activity codes, updating customer databases, filling out forms, or initiating outbound contact. As a metric, it indicates the total time an agent takes to finish working on a call. If an agent must complete work before the agent can handle the next contact, then ACW is factored into the average handle time. Note: By default, the summary of metrics displayed includes all activity for the agent. To filter down to the activities specific to a queue, you can apply a filter. |
Yes |
|
Contacting |
The number of contacting segments for the agent and interval. |
Yes |
|
Dialing |
The number of dialing segments for the agent and interval. |
Yes |
|
Max Contacting |
The maximum amount of time outbound interactions take to connect to the agent’s phone. Usually, this duration is short. However, if the agent uses a remote phone the duration may be longer. |
Yes |
|
Max Dialing |
The maximum amount of time an outbound interaction spends dialing a contact. |
Yes |
|
Min Contacting |
The minimum amount of time outbound interactions take to connect to the agent’s phone. Usually, this duration is short. However, if the agent uses a remote phone the duration may be longer. |
Yes |
|
Min Dialing |
The minimum amount of time an outbound interaction spends dialing a contact. |
Yes |
| Direct Requested | The number of interactions in which direct routing was requested. | No |
| Direct Requested % | The rate of answered interactions in which direct routing was requested in comparison to all answered interactions. | No |
| Direct Used | The number of answered interactions in which direct routing was used. | No |
| Direct Used % | The rate of interactions in which direct routing was used in comparison to all answered interactions. | No |
|
Total Active Callback |
The time an agent spent on a callback while a call is active. |
Yes |
|
Min Active Callback |
The minimum time an agent spent on a callback while a call is active. |
Yes |
|
Max Active Callback |
The maximum time an agent spent on a callback while a call is active. |
Yes |
|
Avg Active Callback |
The average time an agent spent on a callback while a call is active. |
Yes |
|
Active Callback |
The instances of an agent on a callback while a call is active. |
Yes |
|
Talk |
The number of sessions where the user(s) interacted during conversations. A session includes the point where the agent joins the conversation to the point where they disconnect. |
Yes |
My Queues Activity view
Interactions
| Column | Description | Columns live update |
|---|---|---|
| Interactions | The number of interactions assigned to the queue that agents are currently interacting with. |
Yes |
| Longest Interacting | The amount of time that the longest interacting interaction has been interacting for each media type. | Yes |
| Longest Waiting | The amount of time that the longest waiting interaction has been waiting in queue for each media type. | Yes |
| Name | The name of the queue. | Yes |
| Waiting | The number of interactions that waited in the queue. |
Yes |
Performance
| Column | Description | Columns live update |
|---|---|---|
|
ACW |
The number of times after-call work (ACW) was completed. After-call work is the work that an agent performs immediately following an interaction. Work may involve keying activity codes, updating customer databases, filling out forms, or initiating outbound contact. As a metric, it indicates the total time an agent takes to finish working on a call. If an agent must complete work before the agent can handle the next contact, then ACW is factored into the average handle time. Note: By default, the summary of metrics displayed includes all activity for the agent. To filter down to the activities specific to a queue, you can apply a filter. |
Yes |
| ASA | The average amount of time an interaction waits in the queue before an agent answers. This metric does not include interactions that agents do not answer. Average Speed of Answer (ASA) is directly associated with the service level and provides insight into the customer service your organization provides. ASA is recorded in the interval in which the agent answered the interaction. Calculated by: Total Answered (tAnswered Sum) / Answered Count (tAnswered Count) Note: Raw values are provided in milliseconds. |
Yes |
| Abandon | The number of times an end user abandoned an interaction in a queue. For example, the customer hangs up before an agent answers, or the system disconnects the interaction. |
Yes |
| Abandon % | The percentage of offered interactions in which the customer disconnected before connecting with an agent. The abandon rate can identify queues that require extra staff to handle interactions in a timely manner. Calculated by: (Abandoned Count / Offered Count) * 100 |
Yes |
| Abandon - No Short | Number of abandons excluding the short abandons. |
Yes |
| Abandon - No Short % | Percent of abandons excluding the short abandons. |
Yes |
| Answer | A measurement of the number of assigned ACD interactions answered by an agent in a given period. Answered increments when the agent is the first to connect to the interaction. |
Yes |
| Answer % | The percentage of offered interactions that an agent answered. Calculated by: (Answered / Offered) * 100 |
Yes |
| Avg ACW | The average amount of time agents spent completing after-call work. Calculated by: Total ACW / Interactions with ACW |
Yes |
| Avg Abandon | The average amount of time before a customer disconnects in an ACD queue before connecting with an agent. For example, the customer hangs up before an agent answers, or the system disconnects the interaction. | Yes |
|
Avg Flow-Out |
The average amount of time an interaction spends in queue before it flows out. Calculated by: Total Flow Out Time / Count of interactions with flow-outs For more information, see Queues Performance Summary view. |
Yes |
| Avg Handle | The average amount of time agents spent handling interactions. This calculation includes talk time, hold time, and after-call work. For outbound calls it also includes dialing and contacting time. Calculated by: (cumulative talk time + cumulative hold time + cumulative after-call work + cumulative dialing time + cumulative contacting time) / Number of interactions handled Note: The interactions can span multiple time intervals. For example, a 45-minute call spans two 30-minute intervals. However, metrics are assigned a single timestamp and reported in the interval into which this timestamp falls. The timestamps are assigned based on when the metric calculation is complete.
For instance, handle time will use the timestamp of after call work completion. In the example of a 45-minute call, the handle time falls in the second 30-minute interval because the handle time was calculated at the end of the call when ACW was submitted. In these views, the Avg Talk, Avg Hold, and Avg ACW columns do not equal the Avg Handle column because only some interactions include holds. This view calculates average handle column using cumulative counts rather than averages. |
Yes |
| Avg Hold | The average number of seconds that interactions were placed on hold. Calculated by: Total Hold Time / Count of interactions with holds |
Yes |
| Avg Talk | The average number of seconds spent interacting on a media type. Calculated by: Total Talk time / Count of interactions with Talk time |
Yes |
| Avg Wait | The average amount of time an interaction is in a queue before an agent answers it, before the interaction moves out of the queue, or before the customer abandons the interaction. Calculated by: Total Wait Time / Interactions |
Yes |
| Flow-Out | Flow-outs are interactions that enter and leave a queue without getting answered by an agent and without getting disconnected. Flow-outs are an indication of customer service level and queue productivity. High numbers of flow-outs can indicate staffing issues or ineffective agents when used with high handle times (bullseye matching metrics). Flow-outs can include transfers to voicemail, callbacks, and any system-driven events such as in-queue flows that transfer to another queue or external party after a certain amount of time. Flow-outs can also occur if the caller opts to exit out of the queue and return to the IVR. Offered interactions are either flow-out, answered, or abandoned interactions. |
Yes |
| Flow-Out % |
The percentage of interactions that enter and leave a queue without getting answered by an agent or disconnected. Flow-outs are an indication of customer service level and queue productivity. Calculated by: (Flow-out Count / Offered Count) * 100 |
Yes |
| Handle | The total number of ACD and non-ACD interactions that agents were involved in for the selected media type. Handle increments in the interval in which the interaction ends, after the agent completes any after call work and completes the interaction. |
Yes |
| Hold | The number of interactions with holds. |
Yes |
| Max ACW | The maximum amount of time spent on after call work for the selected interval. |
Yes |
| Max Abandon | The maximum time of an abandoned interaction for the selected interval. |
Yes |
|
Max Contacting |
The maximum amount of time outbound interactions take to connect to the agent’s phone. Usually, this duration is short. However, if the agent uses a remote phone the duration may be longer. |
Yes |
|
Max Dialing |
The maximum amount of time an outbound interaction spends dialing a contact. |
Yes |
|
Max Flow-Out |
The maximum amount of time an interaction spends in queue before it flows out. For more information, see Queues Performance Summary view. |
Yes |
|
Max Handle |
The maximum amount of time agents were involved in ACD and non-ACD interactions, including answered interactions, transfers, callbacks, and outbound calls. |
Yes |
| Max Hold | The maximum amount of time spent on hold for the selected interval. |
Yes |
| Max Talk | The maximum amount of time spent interacting for the selected interval. |
Yes |
| Max Wait | The maximum amount of time spent waiting in queue for the selected interval. |
Yes |
| Met SLA | Number of interactions that met the defined service level. |
Yes |
| Min ACW | The minimum amount of time spent on after call work for the selected interval. |
Yes |
| Min Abandon | The minimum time of an abandoned interaction for the selected interval. |
Yes |
|
Min Contacting |
The minimum amount of time outbound interactions take to connect to the agent’s phone. Usually, this duration is short. However, if the agent uses a remote phone the duration may be longer. |
Yes |
| Min Dialing | The minimum amount of time an outbound interaction spends dialing a contact. | Yes |
|
Min Flow-Out |
The minimum amount of time an interaction spends in queue before it flows out. For more information, see Queues Performance Summary view. |
Yes |
|
Min Handle |
The minimum amount of time agents were involved in ACD and non-ACD interactions, including answered interactions, transfers, callbacks, and outbound calls. |
Yes |
| Min Hold | The minimum amount of time spent on hold for the selected interval. |
Yes |
| Min Talk | The minimum amount of time spent interacting for the selected interval. |
Yes |
| Min Wait | The minimum amount of time spent waiting in queue for the selected interval. |
Yes |
| Offered | The number of interactions routed into the queue for an agent to answer. Offered interactions are either answered, abandoned, or flow-out interactions. |
Yes |
| Outbound | This metric represents the number of outbound interactions placed on behalf of queue. |
Yes |
| Outbound Attempt | Attempted outbound interactions for Dialer campaigns. |
Yes |
| Over SLA | Number of interactions that were over the defined Service Level. |
Yes |
| Service Level % | Service level target is a contact center performance statistic expressed as “X percent of conversations answered in Y seconds.” For example, a goal of answering 80% of voice calls within 20 seconds provides a service level target of 80/20. You can set the service level target for each media type in a queue. Analytics uses this service level target to calculate whether you are within the service level % defined by your service level agreement (SLA). For more information about setting the service level target, see Create queues or Edit or delete queues. Note: In the performance views that are not queue-specific, the Service Level % is calculated by queue and displayed as a – on the aggregated group row since SLA targets vary by queue. The affected views are DNIS Performance Summary and Skills Performance views. To view individual queue service level %, click the + to expand the row.
The service level % is the percentage of interactions that meet your contact center's service level target. The formula to calculate the service level % is:
Number of Conversations Answered within SLA The numerator is calculated by taking the total answered conversations and subtracting the conversations that were not answered within the SLA threshold. Calculated by: (Answered Count – SLA Violation Count) Total Number of Conversations The Service Level Options configuration determines the denominator. With all the options below unchecked, the denominator is the count of answered conversations.
As the service level calculation depends on an organization’s configured options, the final formula to calculate the service level is:
Notes:
|
Yes |
| Short Abandon | Number of interactions that were short abandoned. |
Yes |
| Short Abandon % | Percent of interactions that were short abandoned. |
Yes |
|
Talk |
The number of sessions where the user(s) interacted during conversations. A session includes the point where the agent joins the conversation to the point where they disconnect. |
Yes |
| Total ACW | The number of times after-call work (ACW) was completed. After-call work is the work that an agent performs immediately following an interaction. Work may involve keying activity codes, updating customer databases, filling out forms, or initiating outbound contact. As a metric, it indicates the total time an agent takes to finish working on a call. If an agent must complete work before the agent can handle the next contact, then ACW is factored into the average handle time. |
Yes |
| Total Handle | The total amount of time agents spend on an interaction including time spent contacting, time spent dialing, talk time, hold time, and after call work. |
Yes |
| Total Hold | The cumulative hold time for all interactions. |
Yes |
| Total Talk | The total amount of time spent interacting on all the conversations by the agent, within an interval. For example, in an interaction, where an agent accepts an interaction, talks to the customer for two minutes, places the customer on hold for one minute, and then talks to the customer again for two minutes, the Total Talk equals 4 minutes. |
Yes |
|
Total Wait |
The total amount of time an interaction is in a queue before an agent answers it, it flows out, or the customer abandons it. Genesys Cloud calculates the wait time in milliseconds. |
Yes |
| Transfer % | The number of transfers compared with the total number of interactions answered. Calculated by: (No. of transfers / interactions answered) * 100 |
Yes |
| Transferred | A measurement of the number of interactions an agent answered in one queue and then transferred. A transfer counts for the queue in which an agent answers the interaction. This measurement is calculated by the number of interactions blind transferred or consult transferred. |
Yes |
| Voicemail | Count of voicemails received. |
Yes |
|
Wait |
The number of interactions that waited in the queue. |
Yes |
Agents
| Column | Description | Columns live update |
|---|---|---|
| Alerting | The total number of alerting conversations. |
Yes |
| Communicating | The agent is on a non-ACD call, and, in relation to agent utilization and call routing, Genesys Cloud treats the non-ACD call like an ACD call. For example, administrators could configure agent utilization so Genesys Cloud does not route new interactions to agents while they are on an ACD or non-ACD call. This status only appears if administrators have selected “Count non-ACD calls in utilization capacity” within the agent utilization configuration. |
Yes |
| Idle | The number of agents who are on queue and available to take interactions but who are not working with interactions. |
Yes |
| Interacting | The number of agents working with interactions. This number includes agents completing after call work. |
Yes |
| Not Responding | An agent was On Queue or Interacting and did not answer an offered interaction. The agent could still be handling and completing other previous interactions. While Not Responding, the agent does not receive new interactions. |
Yes |
| Off Queue | Off Queue represents the number of agents that are off queue for a specific queue. These agents are in another status, such as Available, Busy, or Meeting. Agents in the Out of Office and Offline statuses are not included in this number. |
Yes |
| On Queue | The On Queue metric represents the number of agents that are on queue for a specific queue. |
Yes |
| Presence Breakdown | The number of agents in different presences. For more information, see Presence, status, and activity indicators overview | Yes |
My Status view
| Column | Description | Columns live update |
|---|---|---|
| Available | The time spent in the Available status for the specified period. |
Yes |
| Away | The time spent in the Away status for the specified period. |
Yes |
| Break | The time spent in the Break status for the specified period. |
Yes |
| Busy | The time spent in the Busy status for the specified period. |
Yes |
| Communicating | The agent is on a non-ACD call, and, in relation to agent utilization and call routing, Genesys Cloud treats the non-ACD call like an ACD call. For example, administrators could configure agent utilization so Genesys Cloud does not route new interactions to agents while they are on an ACD or non-ACD call. This status only appears if administrators have selected “Count non-ACD calls in utilization capacity” within the agent utilization configuration. |
Yes |
| Idle | The amount of time an agent spends in the Idle routing status. This routing status represents agents who are On Queue and able to take interactions but are not currently working with interactions. |
Yes |
| Idle % | The percentage of the Total ACD time that is spent in Idle. | Yes |
| Interacting | The time that the agent was handling interactions. |
Yes |
| Interacting % | The percentage of time spent in the Interacting statuses out of all ACD time, where ACD time is the sum of time spent in the Interacting, Idle, and Not Responding statuses. | Yes |
| Interval | Shows the time interval of the data. | Yes |
| Log in | The time the user first logged in within the supplied interval. Data for this column is limited to a one-month time range for data that is up to 558 days old. If the column is blank, a log in event did not occur within the view’s requested interval. |
No |
| Log out | The last time the user logged out within the supplied interval. Data for this column is limited to a one-month time range for data that is up to 558 days old. If the column is blank, a log out event did not occur within the view’s requested interval. |
No |
| Logged in | The total amount of time a user is logged in for the specified period. |
Yes |
| Meal | The time spent in the Meal status for the specified period. |
Yes |
| Meeting | The time spent in the Meeting status for the specified period. |
Yes |
| Not Responding | The amount of time an agent spends in the Not Responding routing status after not accepting an interaction. The Not Responding routing status is when an agent was On Queue or Interacting and did not answer an offered interaction. The agent could still be handling and completing other previous interactions. While Not Responding, the agent does not receive new interactions. |
Yes |
| Not Responding % | The percentage of the Total ACD time that is spent in Not Responding. | Yes |
| Occupancy | The percentage of time that an agent spent handling ACD conversations against the total time on queue calculated by: (total time in "Interacting" routing status / (total time in “idle”, “interacting”, and “communicating” routing statuses in interval)) * 100; range: 0-100% |
Yes |
| Off Queue | Off Queue represents the number of agents that are off queue for a specific queue. These agents are in another status, such as Available, Busy, Away, Break, Meal, Meeting, or Training. Agents in the Out of Office and Offline statuses are not included in this number. |
Yes |
| Off Queue % | The percentage of the Logged In time that is spent Off Queue. | Yes |
| On Queue | The On Queue metric represents the number of agents that are on queue for a specific queue. |
Yes |
| On Queue % | The percentage of the Logged In time that is spent On Queue. | Yes |
| System Away | The time spent during the specified period in the Away status when Genesys Cloud automatically sets the user's status to Away due to inactivity. Note: If users manually set their status to Away, then this view displays that time in the Away column. |
Yes |
| Total ACD | The amount of time that an agent spent in the Interacting, Idle, and Not Responding statuses. For example, an agent spent 5:01:00 interacting, 1:47:30 idle, and 0:21:30 not responding. The total ACD time is 7:10:00. |
Yes |
| Training | The time spent in the Training status for the specified period. |
Yes |
Predictive Routing Queue Impact view
| Column | Description |
|---|---|
| KPI | The KPI that is set for the queue, and a collection of KPIs in addition to the set KPI. See Supported KPIs. |
| Difference | The change in the KPI value. The value is determined by subtracting the average KPI value for predictive interactions from the non-predictive interactions. |
| Difference % |
Shows the changes in the KPI value under the Difference column. The value is shown as a % of the KPI value displayed under the Non-Predictive column. The direction of the arrow next to the view details indicates an increase or a decrease of the KPI value. The color of the arrow indicates the nature of the impact. |
| Media Type | The type of media used. |
| Predictive | Indicates the average KPI value of all the interactions handled by the queue during the reporting period, and filtered based on the following interaction details:
Note: The predictive routing column represents only the interactions that were routed using predictive routing. It does not include the interactions that timed out and were later routed using the backup routing method.
|
| Non Predictive | Indicates the average KPI value of all the interactions handled by the queue during the reporting period, and categorized based on the following criteria:
|
Queue Routing Performance Summary view
| Column | Description |
|---|---|
| % Total Answered |
The percentage of the total number of calls answered in a queue level across different categories such as routing used and routing rules. Routing Used – The routing used is defined as the actual routing method used for answering an interaction. Shows the number of calls answered across different routing types used and expressed as a percentage of the total number of calls answered in that queue. Routing Rule – The routing used is defined as the last routing rule reached before an interaction was answered. Shows the number of calls answered across different routing rules and rings and is expressed as a percentage of the total number of conversations answered for a specified routing used. |
| Answer | A measurement of the number of assigned ACD interactions answered by an agent in a given period. Answered increments when the agent is the first to connect to the interaction. |
| Avg Handle |
The average amount of time agents spent handling interactions. This calculation includes talk time, hold time, and after-call work. For outbound calls it also includes dialing and contacting time. Calculated by: (cumulative talk time + cumulative hold time + cumulative after-call work + cumulative dialing time + cumulative contacting time) / Number of interactions handled Note: The interactions can span multiple time intervals. For example, a 45-minute call spans two 30-minute intervals. However, metrics are assigned a single timestamp and reported in the interval into which this timestamp falls. The timestamps are assigned based on when the metric calculation is complete.
For instance, handle time will use the timestamp of after call work completion. In the example of a 45-minute call, the handle time falls in the second 30-minute interval because the handle time was calculated at the end of the call when ACW was submitted. In these views, the Avg Talk, Avg Hold, and Avg ACW columns do not equal the Avg Handle column because only some interactions include holds. This view calculates the average handle column using cumulative counts rather than averages. |
| Name | Name of the queue. |
| Transfer | A measurement of the number of interactions an agent answered in one queue and then transferred. A transfer counts for the queue in which an agent answers the interaction. This measurement is calculated by the number of interactions blind transferred or consult transferred. |
| Transfer % | The number of transfers compared with the total number of interactions answered. Calculated by: (No. of transfers / interactions answered) * 100 |
Queue Topics Detail view
If you use the date filter to show the current date, then these columns show current data. If you use the date filter to show a past date, then these columns display historical data.
To add a column for a specific topic or for a topic based on a specific dialect, click and type the topic name or dialect name in the field provided at the bottom of the column list. If you enter a dialect name, the topic list only contains topics associated with the specific dialect. From the list that appears, select the topic that you want to add to the view and click Add Columns.
| Column | Description |
|---|---|
| Interactions | The number of agent communications in which the topic was detected. |
| Interactions % | The percentage of agent communications in which the topic was detected out of the total number of communications the agent handled. |
| Dialect | The dialect the topic was created for. |
| Participant | The participant the topic is targeting. The values can be internal (for example, IVR, agent), or external (for example, customer). |
| Average Sentiment Score | The average sentiment score of interactions. |
| Negative Interactions | The number of interactions during which the average sentiment is < -20. |
| Negative Interactions % | The percent of all interactions that have an overall negative sentiment score (< -20). |
| Neutral Interactions | The number of interactions during which the average sentiment is >= -20 and < +20. |
| Neutral Interactions % | The percent of all interactions that have an overall neutral sentiment score (>= -20 and < +20). |
| Positive Interactions | The number of interactions during which the average sentiment is >= +20. |
| Positive Interactions % | The percent of all interactions that have an overall positive sentiment score (>= +20). |
| Avg Agent Talk | The average agent talk time. |
| Avg Agent Talk % | The average agent talk time as a percentage of interactions. |
| Avg Customer Talk | The average customer talk time. |
| Avg Customer Talk % | The average customer talking time as a percentage of interactions. |
| Avg Hold/Music | The average of hold time and music time across interactions. |
| Avg Hold/Music % | The average hold and music time as a percentage of interactions. |
| Avg Overtalk | The average overtalk time across interactions, where both the agent and customer talk at the same time. |
| Avg Overtalk % | The average overtalk time as a percentage of interactions, where both the agent and customer talk at the same time. |
| Avg Silence | The average silent time across interactions. |
| Avg Silence % | The average silent time as a percentage of interactions. |
| Avg Talk and Silence | The average of both the talking time and silent time. |
| Overtalk Instances | The number of instances of overtalk time, where both the agent and customer talk at the same time. |
| Sentiment | Shows the spread of sentiment for the topics shown. |
Queue Topics Summary view
If you use the date filter to show the current date, then these columns show current data. If you use the date filter to show a past date, then these columns display historical data.
To add a column for a specific topic or for a topic based on a specific dialect, click and type the topic name or dialect name in the field provided at the bottom of the column list. If you enter a dialect name, the topic list only contains topics associated with the specific dialect. From the list that appears, select the topic that you want to add to the view and click Add Columns.
| Column | Description |
|---|---|
| Name | The name of the queue. |
| Offer | The number of interactions routed into the queue for an agent to answer. Offered interactions are either answered, abandoned, or flow-out interactions. |
| Answer % | A measurement of the number of assigned ACD interactions answered by an agent in a given period. Answered increments when the agent is the first to connect to the interaction. |
| Abandon % | The percentage of offered interactions in which the customer disconnected before connecting with an agent. The abandon rate can identify queues that require extra staff to handle interactions in a timely manner. Calculated by: (Abandoned Count / Offered Count) * 100 |
| Avg Wait | The average amount of time an interaction is in a queue before an agent answers it, it flows out, or the customer abandons it. |
| Avg Handle | The average amount of time agents spent handling interactions. This calculation includes talk time, hold time, and after-call work. For outbound calls it also includes dialing and contacting time. Calculated by: (cumulative talk time + cumulative hold time + cumulative after-call work + cumulative dialing time + cumulative contacting time) / Number of interactions handled Note: The interactions can span multiple time intervals. For example, a 45-minute call spans two 30-minute intervals. However, metrics are assigned a single timestamp and reported in the interval into which this timestamp falls. The timestamps are assigned based on when the metric calculation is complete.
For instance, handle time will use the timestamp of after call work completion. In the example of a 45-minute call, the handle time falls in the second 30-minute interval because the handle time was calculated at the end of the call when ACW was submitted. |
| Avg Talk | The average number of seconds spent interacting on a media type. Calculated by: Total Talk time / Count of interactions with Talk time |
| Interactions Analyzed | The number of interactions transcribed and/or analyzed by speech and text analytics for each individual agent. |
| No Topics Detected | The number of interactions without a topic. |
| <Topic name> | The speech and text analytics topic used to analyze the interaction. |
| Average Sentiment Score | The average sentiment score of interactions. |
| Negative Interactions | The number of interactions during which the average sentiment is < -20. |
| Negative Interactions % | The percent of all interactions that have an overall negative sentiment score (< -20). |
| Neutral Interactions | The number of interactions during which the average sentiment is >= -20 and < +20. |
| Neutral Interactions % | The percent of all interactions that have an overall neutral sentiment score (>= -20 and < +20). |
| Positive Interactions | The number of interactions during which the average sentiment is >= +20. |
| Positive Interactions % | The percent of all interactions that have an overall positive sentiment score (>= +20). |
| Avg Agent Talk | The average agent talk time. |
| Avg Agent Talk % | The average agent talk time as a percentage of interactions. |
| Avg Customer Talk | The average customer talk time. |
| Avg Customer Talk % | The average customer talking time as a percentage of interactions. |
| Avg Hold/Music | The average of hold time and music time across interactions. |
| Avg Hold/Music % | The average hold and music time as a percentage of interactions. |
| Avg Overtalk | The average overtalk time across interactions, where both the agent and customer talk at the same time. |
| Avg Overtalk % | The average overtalk time as a percentage of interactions, where both the agent and customer talk at the same time. |
| Avg Silence | The average silent time across interactions. |
| Avg Silence % | The average silent time as a percentage of interactions. |
| Avg Talk and Silence | The average of both the talking time and silent time. |
| Overtalk Instances | The number of instances of overtalk time, where both the agent and customer talk at the same time. |
| Sentiment | Shows the spread of sentiment for the topics shown. |
Queue Workitems Performance Detail view
Performance
| Column | Description |
|---|---|
| ACD Cancelled | The number of workitems canceled during ACD. |
| ASA | The average amount of time an interaction waits in the queue before an agent answers. This metric does not include interactions that agents do not answer. Average Speed of Answer (ASA) is directly associated with the service level and provides insight into the customer service your organization provides. ASA is recorded in the interval in which the agent answered the interaction. Calculated by: Total Answered (tAnswered Sum) / Answered Count (tAnswered Count) Note: Raw values are provided in milliseconds. |
| Agent Transfer | The number of workitems transferred by an agent to another agent. |
| Alert | The number of times agents receive an alert for interactions. |
| Avg Handle |
The average amount of time agents spent handling interactions. This calculation includes talk time, hold time, and after-call work. For outbound calls it also includes dialing and contacting time. Calculated by: (cumulative talk time + cumulative hold time + cumulative after-call work + cumulative dialing time + cumulative contacting time) / Number of interactions handled Note: The interactions can span multiple time intervals. For example, a 45-minute call spans two 30-minute intervals. However, metrics are assigned a single timestamp and reported in the interval into which this timestamp falls. The timestamps are assigned based on when the metric calculation is complete.
For instance, handle time will use the timestamp of after call work completion. In the example of a 45-minute call, the handle time falls in the second 30-minute interval because the handle time was calculated at the end of the call when ACW was submitted. In these views, the Avg Talk, Avg Hold, and Avg ACW columns do not equal the Avg Handle column because only some interactions include holds. This view calculates the average handle column using cumulative counts rather than averages. |
| Avg Hold Handled | The average time any interaction spent on hold. This calculation takes into account all interactions handled, not just those that were held. Calculated by: Total Hold Time / Number of Interactions Handled. |
| Declined | The number of workitems declined. |
| Disconnected | The number of workitems disconnected. |
| Focus | The number of times an agent has a workitem in focus. This number can be higher than the count of workitems handled as the number helps to identify each time an agent has a workitem in focus (vs. on hold). |
| Handled | The number of workitems handled by agents in a queue. |
| Hold | The number of interactions with holds. |
| Interval | This column is preselected based on the interval defined in the time filter. |
| Max Alert | The maximum number of times an agent was alerted for a workitem. |
| Max Focus | The maximum amount of time an agent spent focusing on a workitem. |
| Max Hold | The maximum amount of time spent on hold for the selected interval. |
| Max Park | The maximum amount of time a workitem was parked by an agent. |
| Min Focus |
The minimum amount of time an agent spent focusing on a workitem. |
| Min Hold | The minimum amount of time spent on hold for the selected interval. |
| Min Park | The minimum amount of time a workitem was parked by an agent. |
| Not Responding |
The time an agent was being alerted without responding to a workitem. |
| Parked | The number of workitems parked by agents in a queue. |
| Queue Transfer | The number of workitems transferred by a queue to another agent. |
| Answered |
The amount of time an agent took to answer a workitem on a queue or through agent assignment. |
| Total Hold | The overall hold time for a workitem. |
| Avg Hold | The average hold time for a workitem. Calculated by: (tWorkitemsHeldComplete.sum / tWorkitemsHeldComplete.count) |
| Terminated | The number of workitems terminated. |
| Timed Out | The number of workitems with agent timeouts. |
| Total Focus | The total amount of time an agent spent focusing on a workitem. This time can be less than the Total Handled duration that an agent parks or puts a workitem on hold. |
| Total Handle | The total amount of time agents spend on an interaction including time spent contacting, time spent dialing, talk time, hold time, and after call work. |
| Total Park | The total amount of time a workitem was parked by an agent. |
| Transfer | The number of all transfers made by an agent in a queue. This number includes both blind and consult transfers. A transfer is counted on the queue in which an agent answers the interaction. |
| Transfer % | The number of transfers compared to the total number of interactions answered. Calculated by: (# of transfers / Interactions Answered) * 100 |
| Wrap-Up | The number of wrap-ups added. |
| Wrap-Up Removed | The number of wrap-ups removed. |
Routing
For an overview of routing methods, see Routing and evaluation methods.
| Column | Description |
|---|---|
| Bullseye Requested | The number of interactions in which bullseye routing was requested. |
| Bullseye Requested % | The rate of answered interactions in which bullseye routing was requested in comparison to all answered interactions. |
| Bullseye Used | The number of answered interactions in which bullseye routing was used. |
| Bullseye Used % | The rate of interactions in which bullseye routing was used in comparison to all answered interactions. |
| Direct Requested |
The number of interactions assigned directly to a user via the API or the list view. Note: The workitems using direct routing does not alert the agents. But these workitems are found in the list view assigned to the appropriate user.
|
| Direct Requested % | The percentage of workitems that attempt to route to the agents via the direct routing method, divided by all workitem routing attempts. |
| Direct Used | The routing method used to assign a workitem to an agent. |
| Direct Used % | The percentage of workitems that routed to the agents via the direct routing method, divided by all workitems routed to the agents. |
| Manual Used | The number of answered interactions in which manual routing was used. |
| Manual Used % | The rate of interactions in which manual routing was used in comparison to all answered interactions. |
| Preferred Requested | The number of answered interactions in which preferred agent routing was used. |
| Preferred Requested % | The rate of interactions in which preferred agent routing was requested in comparison with all answered interactions. |
| Preferred Used | The number of answered interactions in which preferred agent routing was used. |
| Preferred Used % | The rate of interactions in which preferred agent routing was used in comparison to all answered interactions. |
| Standard Requested | The number of answered interactions in which standard routing was requested. |
| Standard Requested % | The rate of interactions in which standard routing was requested in comparison to all answered interactions. |
| Standard Used | The number of answered interactions in which standard routing was used. |
| Standard Used % | The rate of interactions in which standard routing was used in comparison to all answered interactions. |
For real-time examples and more advanced Workitems metric definitions, see Genesys Cloud Developer Center.
Queue Workitems Performance Summary view
Performance
| Column | Description |
|---|---|
| ACD Cancelled | The number of workitems canceled during ACD. |
| ASA | The average amount of time an interaction waits in the queue before an agent answers. This metric does not include interactions that agents do not answer. Average Speed of Answer (ASA) is directly associated with the service level and provides insight into the customer service your organization provides. ASA is recorded in the interval in which the agent answered the interaction. Calculated by: Total Answered (tAnswered Sum) / Answered Count (tAnswered Count) Note: Raw values are provided in milliseconds. |
| Agent Transfer | The number of workitems transferred by an agent to another agent. |
| Alert | The number of times agents receive an alert for interactions. |
| Avg Handle |
The average amount of time agents spent handling interactions. This calculation includes talk time, hold time, and after-call work. For outbound calls it also includes dialing and contacting time. Calculated by: (cumulative talk time + cumulative hold time + cumulative after-call work + cumulative dialing time + cumulative contacting time) / Number of interactions handled Note: The interactions can span multiple time intervals. For example, a 45-minute call spans two 30-minute intervals. However, metrics are assigned a single timestamp and reported in the interval into which this timestamp falls. The timestamps are assigned based on when the metric calculation is complete.
For instance, handle time will use the timestamp of after call work completion. In the example of a 45-minute call, the handle time falls in the second 30-minute interval because the handle time was calculated at the end of the call when ACW was submitted. In these views, the Avg Talk, Avg Hold, and Avg ACW columns do not equal the Avg Handle column because only some interactions include holds. This view calculates the average handle column using cumulative counts rather than averages. |
| Avg Hold Handled | The average time any interaction spent on hold. This calculation takes into account all interactions handled, not just those that were held. Calculated by: Total Hold Time / Number of Interactions Handled. |
| Declined | The number of workitems declined. |
| Disconnected | The number of workitems disconnected. |
| Focus | The number of times an agent has a workitem in focus. This number can be higher than the count of workitems handled as the number helps to identify each time an agent has a workitem in focus (vs. on hold). |
| Handled | The number of workitems handled by agents in a queue. |
| Hold | The number of interactions with holds. |
| Max Alert | The maximum number of times an agent was alerted for a workitem. |
| Max Focus | The maximum amount of time an agent spent focusing on a workitem. |
| Max Hold | The maximum amount of time spent on hold for the selected interval. |
| Max Park | The maximum amount of time a workitem was parked by an agent. |
| Min Focus |
The minimum amount of time an agent spent focusing on a workitem. |
| Min Hold | The minimum amount of time spent on hold for the selected interval. |
| Min Park | The minimum amount of time a workitem was parked by an agent. |
| Name | The name of the queue. |
| Not Responding |
The time an agent was being alerted without responding to a workitem. |
| Parked | The number of workitems parked by agents in a queue. |
| Queue Transfer | The number of workitems transferred by a queue to another agent. |
| Terminated | The number of workitems terminated. |
| Answered |
The amount of time an agent took to answer a workitem on a queue or through agent assignment. |
| Total Hold | The overall hold time for a workitem. |
| Avg Hold | The average hold time for a workitem. Calculated by: (tWorkitemsHeldComplete.sum / tWorkitemsHeldComplete.count) |
| Timed Out | The number of workitems with agent timeouts. |
| Total Focus | The total amount of time an agent spent focusing on a workitem. This time can be less than the Total Handled duration that an agent parks or puts a workitem on hold. |
| Total Handle | The total amount of time agents spend on an interaction including time spent contacting, time spent dialing, talk time, hold time, and after call work. |
| Total Park | The total amount of time a workitem was parked by an agent. |
| Transfer | The number of all transfers made by an agent in a queue. This number includes both blind and consult transfers. A transfer is counted on the queue in which an agent answers the interaction. |
| Transfer % | The number of transfers compared to the total number of interactions answered. Calculated by: (# of transfers / Interactions Answered) * 100 |
| Wrap-Up | The number of wrap-ups added. |
| Wrap-Up Removed | The number of wrap-ups removed. |
Routing
For an overview of routing methods, see Routing and evaluation methods.
| Column | Description |
|---|---|
| Bullseye Requested | The number of interactions in which bullseye routing was requested. |
| Bullseye Requested % | The rate of answered interactions in which bullseye routing was requested in comparison to all answered interactions. |
| Bullseye Used | The number of answered interactions in which bullseye routing was used. |
| Bullseye Used % | The rate of interactions in which bullseye routing was used in comparison to all answered interactions. |
| Direct Requested |
The number of interactions assigned directly to a user via the API or the list view. Note: The workitems using direct routing does not alert the agents. But these workitems are found in the list view assigned to the appropriate user.
|
| Direct Requested % | The percentage of workitems that attempt to route to the agents via the direct routing method divided by all workitem routing attempts. |
| Direct Used | The routing method used to assign a workitem to an agent. |
| Direct Used % | The percentage of workitems that routed to the agents via the direct routing method divided by all workitems routed to the agents. |
| Manual Used | The number of answered interactions in which manual routing was used. |
| Manual Used % | The rate of interactions in which manual routing was used in comparison to all answered interactions. |
| Preferred Requested | The number of answered interactions in which preferred agent routing was used. |
| Preferred Requested % | The rate of interactions in which preferred agent routing was requested in comparison with all answered interactions. |
| Preferred Used | The number of answered interactions in which preferred agent routing was used. |
| Preferred Used % | The rate of interactions in which preferred agent routing was used in comparison to all answered interactions. |
| Standard Requested | The number of answered interactions in which standard routing was requested. |
| Standard Requested % | The rate of interactions in which standard routing was requested in comparison to all answered interactions. |
| Standard Used | The number of answered interactions in which standard routing was used. |
| Standard Used % | The rate of interactions in which standard routing was used in comparison to all answered interactions. |
For real-time examples and more advanced Workitems metric definitions, see Genesys Cloud Developer Center.
Queues Activity Detail view
Agent list columns
| Column | Description | Columns live update |
|---|---|---|
| Agent |
The name of the agent in the queue. To open that agent’s Performance Detail view, click the agent’s name. Note: To view more information about an agent, the agent must be in a division granted to you in the Directory > User > View permission. For more information about divisions and access control, see About access control. To order the Agent column by name, use the up and down arrows. When filtering by Status, the Agent column arrows are not available. Use the Time in column to order the agents’ list when filtering by Status. |
No |
|
Duration, Duration 2, and Duration 3 |
The amount of time an agent has been working on an interaction. If an agent is working multiple interactions, then Genesys Cloud displays each interaction’s duration in a separate column labeled Duration 2 or Duration 3. If the interaction is on hold or in after call work (ACW), then the column also displays the amount of time that the interaction has been in either the hold or ACW state. ACW duration appears beside the ACW icon, and Hold time appears beside the Hold icon. The color of the interaction icon and duration time indicates whether the interaction belongs to this specific queue. A black icon means that the interaction belongs to this queue. A gray icon means that the interaction does not belong to this queue, for example, the interaction belongs to another queue. Duration information can be delayed during periods of high system volume. Click the Refresh button at the top of the page if the duration value is missing. |
Yes |
| Interactions | The current number of interactions that an agent has, including interactions in Alerting, Interacting, Hold, and ACW. | Yes |
| Presence | Indicates the agent’s presence: green (Available), yellow (Away, Break, Meal, or Training), red (Busy or Meeting), blue (On Queue, Interacting, Not Responding, or Idle), pink (Out of Office), or gray (Offline). | Yes |
| Skills | The skills an agent has assigned to them. | No |
| Station | Icon that shows if an agent is associated with a station. Hover over the icon to display the Station Name. This column is not included in an exported CSV file or PDF report. |
No |
| Status | The agent’s current status. | Yes |
| Time in |
The number of times the agents are in their current status. When filtering by Status, use the Time in column up and down arrows to order the agents’ list. |
Yes |
| Media Types |
Displays the list of permitted media types for that specific interaction that an agent is permitted to handle. Permissions:
|
No |
Queues Activity Summary view
Interactions
| Column | Description | Columns live update |
|---|---|---|
| Interactions | The number of interactions assigned to the queue that agents are currently interacting with. |
Yes |
| Longest Interacting | The amount of time that the longest interacting interaction has been interacting for each media type. | Yes |
| Longest Waiting | The amount of time that the longest waiting interaction has been waiting in queue for each media type. | Yes |
| Name | The name of the queue. | Yes |
| Waiting | The number of interactions that waited in the queue. |
Yes |
Performance
| Column | Description | Columns live update |
|---|---|---|
|
ACW |
The number of times after-call work (ACW) was completed. After-call work is the work that an agent performs immediately following an interaction. Work may involve keying activity codes, updating customer databases, filling out forms, or initiating outbound contact. As a metric, it indicates the total time an agent takes to finish working on a call. If an agent must complete work before the agent can handle the next contact, then ACW is factored into the average handle time. Note: By default, the summary of metrics displayed includes all activity for the agent. To filter down to the activities specific to a queue, you can apply a filter. |
Yes |
| ASA | The average amount of time an interaction waits in the queue before an agent answers. This metric does not include interactions that agents do not answer. Average Speed of Answer (ASA) is directly associated with the service level and provides insight into the customer service your organization provides. ASA is recorded in the interval in which the agent answered the interaction. Calculated by: Total Answered (tAnswered Sum) / Answered Count (tAnswered Count) Note: Raw values are provided in milliseconds. |
Yes |
| Abandon | The number of times an end user abandoned an interaction in a queue. For example, the customer hangs up before an agent answers, or the system disconnects the interaction. |
Yes |
| Abandon % | The percentage of offered interactions in which the customer disconnected before connecting with an agent. The abandon rate can identify queues that require extra staff to handle interactions in a timely manner. Calculated by: (Abandoned Count / Offered Count) * 100 |
Yes |
| Abandon - No Short | Number of abandons excluding the short abandons. |
Yes |
| Abandon - No Short % | Percent of abandons excluding the short abandons. |
Yes |
| Answer | A measurement of the number of assigned ACD interactions answered by an agent in a given period. Answered increments when the agent is the first to connect to the interaction. |
Yes |
| Answer % | The percentage of offered interactions that an agent answered. Calculated by: (Answered / Offered) * 100 |
Yes |
| Avg ACW | The average amount of time agents spent completing after-call work. Calculated by: Total ACW / Interactions with ACW |
Yes |
| Avg Abandon | The average amount of time before a customer disconnects in an ACD queue before connecting with an agent. For example, the customer hangs up before an agent answers, or the system disconnects the interaction. | Yes |
|
Avg Flow-Out |
The average amount of time an interaction spends in queue before it flows out. Calculated by: Total Flow Out Time / Count of interactions with flow-outs For more information, see Queues Performance Summary view. |
Yes |
| Avg Handle | The average amount of time agents spent handling interactions. This calculation includes talk time, hold time, and after-call work. For outbound calls it also includes dialing and contacting time. Calculated by: (cumulative talk time + cumulative hold time + cumulative after-call work + cumulative dialing time + cumulative contacting time) / Number of interactions handled Note: The interactions can span multiple time intervals. For example, a 45-minute call spans two 30-minute intervals. However, metrics are assigned a single timestamp and reported in the interval into which this timestamp falls. The timestamps are assigned based on when the metric calculation is complete.
For instance, handle time will use the timestamp of after call work completion. In the example of a 45-minute call, the handle time falls in the second 30-minute interval because the handle time was calculated at the end of the call when ACW was submitted. In these views, the Avg Talk, Avg Hold, and Avg ACW columns do not equal the Avg Handle column because only some interactions include holds. This view calculates average handle column using cumulative counts rather than averages. |
Yes |
| Avg Hold | The average number of seconds that interactions were placed on hold. Calculated by: Total Hold Time / Count of interactions with holds |
Yes |
| Avg Talk | The average number of seconds spent interacting on a media type. Calculated by: Total Talk time / Count of interactions with Talk time |
Yes |
| Avg Wait | The average amount of time an interaction is in a queue before an agent answers it, before the interaction moves out of the queue, or before the customer abandons the interaction. Calculated by: Total Wait Time / Interactions |
Yes |
| Flow-Out | Flow-outs are interactions that enter and leave a queue without getting answered by an agent and without getting disconnected. Flow-outs are an indication of customer service level and queue productivity. High numbers of flow-outs can indicate staffing issues or ineffective agents when used with high handle times (bullseye matching metrics). Flow-outs can include transfers to voicemail, callbacks, and any system-driven events such as in-queue flows that transfer to another queue or external party after a certain amount of time. Flow-outs can also occur if the caller opts to exit out of the queue and return to the IVR. Offered interactions are either flow-out, answered, or abandoned interactions. |
Yes |
| Flow-Out % |
The percentage of interactions that enter and leave a queue without getting answered by an agent or disconnected. Flow-outs are an indication of customer service level and queue productivity. Calculated by: (Flow-out Count / Offered Count) * 100 |
Yes |
| Handle | The total number of ACD and non-ACD interactions that agents were involved in for the selected media type. Handle increments in the interval in which the interaction ends, after the agent completes any after call work and completes the interaction. |
Yes |
| Hold | The number of interactions with holds. |
Yes |
| Max ACW | The maximum amount of time spent on after call work for the selected interval. |
Yes |
| Max Abandon | The maximum time of an abandoned interaction for the selected interval. |
Yes |
|
Max Contacting |
The maximum amount of time outbound interactions take to connect to the agent’s phone. Usually, this duration is short. However, if the agent uses a remote phone the duration may be longer. |
Yes |
|
Max Dialing |
The maximum amount of time an outbound interaction spends dialing a contact. |
Yes |
|
Max Flow-Out |
The maximum amount of time an interaction spends in queue before it flows out. For more information, see Queues Performance Summary view. |
Yes |
|
Max Handle |
The maximum amount of time agents were involved in ACD and non-ACD interactions, including answered interactions, transfers, callbacks, and outbound calls. |
Yes |
| Max Hold | The maximum amount of time spent on hold for the selected interval. |
Yes |
| Max Talk | The maximum amount of time spent interacting for the selected interval. |
Yes |
| Max Wait | The maximum amount of time spent waiting in queue for the selected interval. |
Yes |
| Met SLA | Number of interactions that met the defined service level. |
Yes |
| Min ACW | The minimum amount of time spent on after call work for the selected interval. |
Yes |
| Min Abandon | The minimum time of an abandoned interaction for the selected interval. |
Yes |
|
Min Contacting |
The minimum amount of time outbound interactions take to connect to the agent’s phone. Usually, this duration is short. However, if the agent uses a remote phone the duration may be longer. |
Yes |
| Min Dialing | The minimum amount of time an outbound interaction spends dialing a contact. | Yes |
|
Min Flow-Out |
The minimum amount of time an interaction spends in queue before it flows out. For more information, see Queues Performance Summary view. |
Yes |
|
Min Handle |
The minimum amount of time agents were involved in ACD and non-ACD interactions, including answered interactions, transfers, callbacks, and outbound calls. |
Yes |
| Min Hold | The minimum amount of time spent on hold for the selected interval. |
Yes |
| Min Talk | The minimum amount of time spent interacting for the selected interval. |
Yes |
| Min Wait | The minimum amount of time spent waiting in queue for the selected interval. |
Yes |
| Offered | The number of interactions routed into the queue for an agent to answer. Offered interactions are either answered, abandoned, or flow-out interactions. |
Yes |
| Outbound | This metric represents the number of outbound interactions placed on behalf of queue. |
Yes |
| Outbound Attempt | Attempted outbound interactions for Dialer campaigns. |
Yes |
| Over SLA | Number of interactions that were over the defined Service Level. |
Yes |
| Service Level % | Service level target is a contact center performance statistic expressed as “X percent of conversations answered in Y seconds.” For example, a goal of answering 80% of voice calls within 20 seconds provides a service level target of 80/20. You can set the service level target for each media type in a queue. Analytics uses this service level target to calculate whether you are within the service level % defined by your service level agreement (SLA). For more information about setting the service level target, see Create queues or Edit or delete queues. Note: In the performance views that are not queue-specific, the Service Level % is calculated by queue and displayed as a – on the aggregated group row since SLA targets vary by queue. The affected views are DNIS Performance Summary and Skills Performance views. To view individual queue service level %, click the + to expand the row.
The service level % is the percentage of interactions that meet your contact center's service level target. The formula to calculate the service level % is:
Number of Conversations Answered within SLA The numerator is calculated by taking the total answered conversations and subtracting the conversations that were not answered within the SLA threshold. Calculated by: (Answered Count – SLA Violation Count) Total Number of Conversations The Service Level Options configuration determines the denominator. With all the options below unchecked, the denominator is the count of answered conversations.
As the service level calculation depends on an organization’s configured options, the final formula to calculate the service level is:
Notes:
|
Yes |
| Short Abandon | Number of interactions that were short abandoned. |
Yes |
| Short Abandon % | Percent of interactions that were short abandoned. |
Yes |
|
Talk |
The number of sessions where the user(s) interacted during conversations. A session includes the point where the agent joins the conversation to the point where they disconnect. |
Yes |
| Total ACW | The number of times after-call work (ACW) was completed. After-call work is the work that an agent performs immediately following an interaction. Work may involve keying activity codes, updating customer databases, filling out forms, or initiating outbound contact. As a metric, it indicates the total time an agent takes to finish working on a call. If an agent must complete work before the agent can handle the next contact, then ACW is factored into the average handle time. |
Yes |
| Total Handle | The total amount of time agents spend on an interaction including time spent contacting, time spent dialing, talk time, hold time, and after call work. |
Yes |
| Total Hold | The cumulative hold time for all interactions. |
Yes |
| Total Talk | The total amount of time spent interacting on all the conversations by the agent, within an interval. For example, in an interaction, where an agent accepts an interaction, talks to the customer for two minutes, places the customer on hold for one minute, and then talks to the customer again for two minutes, the Total Talk equals 4 minutes. |
Yes |
|
Total Wait |
The total amount of time an interaction is in a queue before an agent answers it, it flows out, or the customer abandons it. Genesys Cloud calculates the wait time in milliseconds. |
Yes |
| Transfer % | The number of transfers compared with the total number of interactions answered. Calculated by: (No. of transfers / interactions answered) * 100 |
Yes |
| Transferred | A measurement of the number of interactions an agent answered in one queue and then transferred. A transfer counts for the queue in which an agent answers the interaction. This measurement is calculated by the number of interactions blind transferred or consult transferred. |
Yes |
| Voicemail | Count of voicemails received. |
Yes |
|
Wait |
The number of interactions that waited in the queue. |
Yes |
Agents
| Column | Description | Columns live update |
|---|---|---|
| Alerting | The total number of alerting conversations. |
Yes |
| Communicating | The agent is on a non-ACD call, and, in relation to agent utilization and call routing, Genesys Cloud treats the non-ACD call like an ACD call. For example, administrators could configure agent utilization so Genesys Cloud does not route new interactions to agents while they are on an ACD or non-ACD call. This status only appears if administrators have selected “Count non-ACD calls in utilization capacity” within the agent utilization configuration. |
Yes |
| Idle | The number of agents who are on queue and available to take interactions but who are not working with interactions. |
Yes |
| Interacting | The number of agents working with interactions. This number includes agents completing after call work. |
Yes |
| Not Responding | An agent was On Queue or Interacting and did not answer an offered interaction. The agent could still be handling and completing other previous interactions. While Not Responding, the agent does not receive new interactions. |
Yes |
| Off Queue | Off Queue represents the number of agents that are off queue for a specific queue. These agents are in another status, such as Available, Busy, or Meeting. Agents in the Out of Office and Offline statuses are not included in this number. |
Yes |
| On Queue | The On Queue metric represents the number of agents that are on queue for a specific queue. |
Yes |
| Presence Breakdown | The number of agents in different presences. For more information, see Presence, status, and activity indicators overview | Yes |
Queues Agents Detail view
Performance
These metrics represent data for the dates that you selected for the view.
| Column | Description |
|---|---|
| Metric | Description |
|
Active Callback |
The instances of an agent on a callback while a call is active. |
|
ACW |
The number of times after-call work (ACW) was completed. After-call work is the work that an agent performs immediately following an interaction. Work may involve keying activity codes, updating customer databases, filling out forms, or initiating outbound contact. As a metric, it indicates the total time an agent takes to finish working on a call. If an agent must complete work before the agent can handle the next contact, then ACW is factored into the average handle time. Note: By default, the summary of metrics displayed includes all activity for the agent. To filter down to the activities specific to a queue, you can apply a filter. |
|
ASA |
The average amount of time an interaction waits in the queue before an agent answers. This metric does not include interactions that agents do not answer. Average Speed of Answer (ASA) is directly associated with the service level and provides insight into the customer service your organization provides. ASA is recorded in the interval in which the agent answered the interaction. Calculated by: Total Answered (tAnswered Sum) / Answered Count (tAnswered Count) Note: Raw values are provided in milliseconds. |
| Adherence | The current adherence status of the user, including In Adherence, Out of Adherence, Unscheduled, Ignored, or Unknown. |
| Adherence Duration | The amount of time represented in days, hours, minutes, and seconds, of the adherence exception. |
| Agent | The name of the agent. |
| Alert | The number of times agents receive an alert for interactions. |
| Alert – No Answer | The number of times an agent was alerted to a conversation but did not answer the conversation. Note: This metric does not specifically count the number of times an agent was placed in a Not Responding routing status. An agent is transitioned to Not Responding status after a specific alert time threshold for ACD-routed conversations. Alert – No Answer can be incremented for all conversation types for any situation where an alert was not followed by an answer event. |
| Answer | A measurement of the number of assigned ACD interactions answered by an agent in a given period. Answered increments when the agent is the first to connect to the interaction. |
|
Avg Active Callback |
The average time an agent spent on a callback while a call is active. |
| Avg ACW | The average amount of time agents spent completing after-call work. Calculated by: Total ACW / Interactions with ACW |
| Avg Hold | The average number of seconds that interactions were placed on hold. Calculated by: Total Hold Time / Count of interactions with holds |
| Avg Talk | The average number of seconds spent interacting on a media type. Calculated by: Total Talk time / Count of interactions with Talk time |
| Avg ACW Handled | The average time any interaction spent in ACW. This calculation takes into account all interactions handled, not just those that had ACW. Calculated by: Total ACW Time / Number of Interactions Handled |
| Avg Contacting | The average amount of time an outbound interaction takes to connecting to the agent’s phone. Usually, this duration is short. However, if the agent uses a remote phone the duration may be longer. |
| Avg Dialing | The average amount of time an agent spends dialing and waiting for a contact to answer during outbound interactions.
Calculated by: (total dialing time/ total number of dialing segments) |
| Avg Handle | The average amount of time agents spent handling interactions. This calculation includes talk time, hold time, and after-call work. For outbound calls it also includes dialing and contacting time. Calculated by: (cumulative talk time + cumulative hold time + cumulative after-call work + cumulative dialing time + cumulative contacting time) / Number of interactions handled Note: The interactions can span multiple time intervals. For example, a 45-minute call spans two 30-minute intervals. However, metrics are assigned a single timestamp and reported in the interval into which this timestamp falls. The timestamps are assigned based on when the metric calculation is complete.
For instance, handle time will use the timestamp of after call work completion. In the example of a 45-minute call, the handle time falls in the second 30-minute interval because the handle time was calculated at the end of the call when ACW was submitted. |
| Avg Hold Handled | The average time any interaction spent on hold. This calculation takes into account all interactions handled, not just those that were held. Calculated by: Total Hold Time / Number of Interactions Handled. |
| Avg Monitor | Average time that the user spent monitoring interactions. |
| Blind Transfer | The number of interactions an agent answered in one queue and then blind transferred. A blind transfer counts for the queue in which an agent answers the interaction. |
| Blind Transfer % | The percentage of interactions an agent answered in one queue and then blind transferred. |
| Consult Transfer | The number of call interactions an agent answered in one queue and then consult transferred, meaning they connected with a person or queue before transferring the call. A consult transfer counts for the queue in which an agent answers the interaction. See Consult transfer a call. |
| Consult Transfer % | The percentage of interactions an agent answered in one queue and then consult transferred. |
|
Contacting |
The number of contacting segments for the agent and interval. |
| Department | Department of the user as defined within Genesys Cloud. |
|
Dialing |
The number of dialing segments for the agent and interval. |
| Division | Displays the name of a division that an agent or queue belongs to. For more information, see About access control. |
| Duration Duration 2 Duration 3 |
The amount of time an agent has been working on an interaction. If an agent is working multiple interactions, then Genesys Cloud displays each interaction's duration in a separate column labeled Duration 2 or Duration 3. |
| Error | The number of errors that occurred on conversations. |
| Handle | The total number of ACD and non-ACD interactions that agents were involved in for the selected media type. Handle increments in the interval in which the interaction ends, after the agent completes any after call work and completes the interaction. |
| Hold | The number of interactions with holds. |
| Interactions | The number of interactions assigned to the queue that agents are currently interacting with. |
|
Max Active Callback |
The maximum time an agent spent on a callback while a call is active. |
| Max ACW | The maximum amount of time spent on after call work for the selected interval. |
| Max Alert | The maximum amount of time an agent was being alerted. |
| Max Alert – No Answer | The maximum amount of time an agent was being alerted without responding to an interaction. |
| Max Answer | The maximum amount of time an agent spent answering assigned ACD interactions for the selected interval. |
|
Max Contacting |
The maximum amount of time outbound interactions take to connect to the agent’s phone. Usually, this duration is short. However, if the agent uses a remote phone the duration may be longer. |
|
Max Dialing |
The maximum amount of time an outbound interaction spends dialing a contact. |
| Max Handle | The maximum amount of time agents were involved in ACD and non-ACD interactions, including answered interactions, transfers, callbacks, and outbound calls. |
| Max Hold | The maximum amount of time spent on hold for the selected interval. |
| Max Monitor | Maximum time that the user spent monitoring interactions. |
| Max Talk | The maximum amount of time spent interacting for the selected interval. |
| Media Types |
Displays the list of permitted media types such as voice, callback, chat, email, and message for that specific interaction that an agent is permitted to handle. Permissions:
|
|
Min Active Callback |
The minimum time an agent spent on a callback while a call is active. |
| Min ACW | The minimum amount of time spent on after call work for the selected interval. |
| Min Alert | The minimum amount of time an agent was being alerted. |
| Min Alert – No Answer | The minimum amount of time an agent was being alerted without responding to an interaction. |
| Min Answer | The minimum amount of time an agent spent answering assigned ACD interactions for the selected interval. |
|
Min Contacting |
The minimum amount of time outbound interactions take to connect to the agent’s phone. Usually, this duration is short. However, if the agent uses a remote phone the duration may be longer. |
|
Min Dialing |
The minimum amount of time an outbound interaction spends dialing a contact. |
| Min Handle | The minimum amount of time agents were involved in ACD and non-ACD interactions, including answered interactions, transfers, callbacks, and outbound calls. |
| Min Hold | The minimum amount of time spent on hold for the selected interval. |
| Min Monitor | Minimum time that the user spent monitoring interactions. |
| Min Talk | The minimum amount of time spent interacting for the selected interval. |
| Monitor | Number of interactions that were monitored. |
| Outbound | This metric represents the number of outbound interactions placed on behalf of queue. |
| Presence | Displays a colored dot related to the agent’s current status. For more information, see Presence, status, and activity indicators overview and Agent presence, status, and activity indicators. |
| Primary Phone | Phone number for the user as defined in Genesys Cloud. |
| Routing Status | The agent’s current routing status set by the system. For more information, see Routing status. |
| Scheduled Activity | The activity for which the user is currently scheduled, including On Queue Work, Break, Meal, Meeting, Off Queue Work, Time Off, Training, Unavailable, or Unscheduled. |
| Secondary Status | The agent’s current secondary status. For more information, see Presence, status, and activity indicators overview and Secondary status overview. |
| Skills | The current skills assigned to an agent. For more information, see User skills overview. |
| Station | Icon that shows if an agent is associated with a station. Hover over the icon to display the Station Name. This column is not included in an exported CSV file or PDF report. |
| Status | The agent’s current status. For more information, see Presence, status, and activity indicators overview and Agent presence, status, and activity indicators. |
|
Talk |
The number of sessions where the user(s) interacted during conversations. A session includes the point where the agent joins the conversation to the point where they disconnect. |
| Time in Routing Status | The amount of time an agent has been in their current routing status. For more information, see Routing status. |
| Time in Status | The amount of time an agent has been in their current status. |
| Title | Title of the user as defined within Genesys Cloud. |
|
Total Active Callback |
The time an agent spent on a callback while a call is active. |
| Total ACW | The cumulative time spent in after-call work (ACW) on all interactions. After-call work is the work that an agent performs immediately following an interaction. Work may involve keying activity codes, updating customer databases, filling out forms, or initiating outbound contact. As a metric, it indicates the total time an agent takes to finish working on a call. If an agent must complete work before the agent can handle the next contact, then ACW is factored into the average handle time. |
| Total Hold | The cumulative hold time for all interactions. |
| Total Talk | The total amount of time spent interacting on all the conversations by the agent, within an interval. For example, in an interaction, where an agent accepts an interaction, talks to the customer for two minutes, places the customer on hold for one minute, and then talks to the customer again for two minutes, the Total Talk equals 4 minutes. |
| Total Alert | The total time Genesys Cloud alerts agents before the agent accepts or declines an interaction. |
| Total Alert – No Answer | The total number of seconds Genesys Cloud offered an agent an interaction before the agent declined the interaction or the interaction timed out. |
| Total Contacting | The total amount of time outbound interactions take to connect to the agent’s phone. Usually, this duration is short. However, if the agent uses a remote phone the duration may be longer. |
| Total Dialing | The total amount of time an outbound interaction spends dialing a contact. |
| Total Handle | The total amount of time agents spend on an interaction including time spent contacting, time spent dialing, talk time, hold time, and after call work. |
| Total Monitor | Total time that the user spent monitoring interactions. |
| Transfer | A measurement of the number of interactions an agent answered in one queue and then transferred. A transfer counts for the queue in which an agent answers the interaction. This measurement is calculated by the number of interactions blind transferred or consult transferred. |
| Transfer % | The number of transfers compared with the total number of interactions answered. Calculated by: (No. of transfers / interactions answered) * 100 |
Routing
For an overview of routing methods, see Routing and evaluation methods.
| Column | Description | Columns live update |
|---|---|---|
| Bullseye Requested | The number of interactions in which bullseye routing was requested. |
No |
| Bullseye Requested % | The rate of answered interactions in which bullseye routing was requested in comparison to all answered interactions. |
No |
| Bullseye Used | The number of answered interactions in which bullseye routing was used. |
No |
| Bullseye Used % | The rate of interactions in which bullseye routing was used in comparison to all answered interactions. |
No |
|
Conditional Requested |
The number of interactions in which conditional routing was requested. | No |
|
Conditional Requested % |
The rate of answered interactions in which conditional routing routing was requested in comparison to all answered interactions. | No |
|
Conditional Used |
The number of interactions in which conditional routing was used. | No |
|
Conditional Used % |
The rate of interactions in which conditional routing was used in comparison to all answered interactions. | No |
| Direct Requested | The number of interactions in which direct routing was requested. | No |
|
Direct Requested % |
The rate of answered interactions in which direct routing was requested in comparison to all answered interactions. | No |
|
Direct Used |
The number of answered interactions in which direct routing was used. | No |
|
Direct Used % |
The rate of interactions in which direct routing was used in comparison to all answered interactions. | No |
| Last Requested | The number of answered interactions in which last routing was used. See Last agent handling. |
No |
| Last Requested % | The rate of interactions in which last routing was requested in comparison to all answered interactions. See Last agent handling. |
No |
| Last Used | The number of answered interactions in which last routing was used. See Last agent handling. |
No |
| Last Used % | The rate of interactions in which last routing was used in comparison to all answered interactions. See Last agent handling. |
No |
| Manual Used | The number of answered interactions in which manual routing was used. |
No |
| Manual Used % | The rate of interactions in which manual routing was used in comparison to all answered interactions. |
No |
| Predictive Requested | The number of answered interactions in which predictive routing was requested. |
No |
| Predictive Requested % | The rate of interactions in which predictive routing was requested in comparison with all answered interactions. |
No |
| Predictive Used | The number of answered interactions in which predictive routing was used. |
No |
| Predictive Used % | The rate of interactions in which predictive routing was used in comparison with all answered interactions. |
No |
| Preferred Requested | The number of answered interactions in which preferred agent routing was used. |
No |
| Preferred Requested % | The rate of interactions in which preferred agent routing was requested in comparison with all answered interactions. |
No |
| Preferred Used | The number of answered interactions in which preferred agent routing was used. |
No |
| Preferred Used % | The rate of interactions in which preferred agent routing was used in comparison to all answered interactions. |
No |
| Standard Requested | The number of answered interactions in which standard routing was requested. |
No |
| Standard Requested % | The rate of interactions in which standard routing was requested in comparison to all answered interactions. |
No |
| Standard Used | The number of answered interactions in which standard routing was used. |
No |
| Standard Used % | The rate of interactions in which standard routing was used in comparison to all answered interactions. |
No |
Speech and text analytics
| Column | Column Description | Columns live update |
|---|---|---|
| Avg Sentiment | Average customer sentiment score (-100 to 100) in the specified interval with the provided filters. |
No |
| Negative Sentiment Instances | The number of negative sentiment instances. For more information, see Understand sentiment analysis. |
No |
| Overall Avg Sentiment Score | The average overall sentiment score of the interactions. Calculated by: oSentimentScore.sum / oSentimentScore.count |
No |
| Positive Sentiment Instances | The number of positive sentiment instances. For more information, see Understand sentiment analysis. |
No |
| Sentiment Instances | Number of instances of sentiment in the given interval with the provided filters. |
No |
Queues Interactions Detail view
Evaluations
| Column | Description |
|---|---|
| Column | Description |
| Evaluated Agent | A comma-separated list of names of evaluated agents for any associated evaluations. |
| Evaluation Assignee | A comma-separated list of names of evaluation assignees for the associated evaluations. |
| Evaluation Created | Displays whether the interaction has an evaluation associated with it. |
| Evaluation Critical Score | The status and value of the evaluation critical score. See Evaluation scoring. |
| Evaluation Score | The score for any associated evaluations. |
| Evaluation Status | The status for any associated evaluations. |
| Evaluator | A comma-separated list of names of evaluators for the associated evaluations. |
External Contact
| Column | Description |
|---|---|
| Column | Description |
| External Contact | Displays the first and last name of the contact. |
| External Organization | Displays the organization name. |
Flows
| Column | Description |
|---|---|
| Column | Description |
| All Flow Disconnect | The total number of times a flow disconnected entries, including: Customer Disconnects, Flow Disconnects, and System Error Disconnects. |
| Customer Disconnect | The number of times customers disconnected in a flow, including the percentage of customer disconnects compared with the disconnect count. |
| Customer Short Disconnect | The number of times customers disconnected in a flow before a short disconnect time. Includes the percentage of customer short disconnects compared with the disconnect count. The default short disconnect time is less than 10 seconds, though administrators can set the short disconnect time to any threshold they want. For more information, see the Configure analytics settings section in Configure contact center analytics options. |
| Failed Outcomes | Displays a list of failed flow outcomes for the interaction. |
| Flow | The name of the flow that the interaction used. |
| Flow Disconnect | The number of times a flow disconnected entries, including the percentage of flow disconnects compared with the total number of disconnects. |
| Flow Exit | The number of times an entry exited a flow to another flow. Includes the percentage of flow exits compared with the total number of exits. |
| Incomplete Outcomes | Displays a list of incomplete flow outcomes for the interaction. |
| Outcome Attempts | The number of flow outcomes in the interaction. |
| Outcome Failure | The number of flow outcomes that were failures. Includes the percentage of failure outcomes compared with the total number of outcomes. |
| Outcome Success | The number of flow outcomes that were success. Includes the percentage of success outcomes compared with the total number of outcomes. |
| Successful Outcomes | Displays a list of successful flow outcomes for the interaction. |
| System Error Disconnect | The number of times entries disconnected in a flow due to a system error. This column includes the percentage of system error disconnects compared with the total number of disconnects. |
Interactions
| Column | Description |
|---|---|
| Column | Description |
| Media Type | The type of media used. |
| Inbound Audio | The number of inbound audio or voice messages received from a customer. Notes: Since messaging is asynchronous, in rare instances, when an agent ends an interaction while an end customer finishes recording and sending a voice note, the last audio file attachment or voice note is not considered for analytics. The audio attachment of the conversation remains intact and is preserved as part of the conversation. There is no data loss. The agent still receives and views the voice note. You can see the impact only in the count of the inbound audio metric. The inbound audio metric can be undercounted. |
| Outbound Audio | The number of outbound audio or voice messages sent by an agent. |
| MOS | The estimated average Mean Opinion Score (MOS) for the voice interaction among all the audio streams within the conversation. MOS is a measure of audio quality at specific measurement points of voice interaction. Potential measurement points include premises-based and cloud-based Edge devices. The measurement is based on codec type, average jitter, latency, and packet loss. Genesys Cloud displays the lowest MOS for each communication that occurs during the whole call. MOS ranges from 1 (bad) to 5 (excellent). Scores below 3.5 indicate unacceptable quality, and scores above 4.3 indicate high quality. |
| Media | The total number of inbound and outbound media for an interaction. |
| Fax | Displays Yes if a fax was present during the interaction. Displays No if a fax was not present during the interaction. |
| Group Ring | Displays the group name for the voice interactions alerted via group ring. |
| Users | The internal users alerted or involved. |
| Screen Recorded | Yes indicates that the conversation was initially screen recorded. It does not consider whether the customer's policies retained it. No indicates that the conversation was not screen recorded. |
| Remote | Information about the external participants. |
| Date | The date the interaction started. |
| Conversation Duration |
The length of the interaction. Calculated by: (Conversation End – Conversation Start) |
| Direction | Displays whether the interaction was inbound, outbound, or inbound/outbound. |
| Initial Direction | Displays whether the interaction started as inbound or outbound. |
| ANI | The number of the person who dialed. |
| DNIS | The original number dialed for the interaction. |
| Queue | The associated queues. |
| Wrap-up | The wrap-up code selected by the agent. |
| Transferred | Indicates interactions that were transferred. A transfer counts for the queue in which an agent answers the interaction. |
| Abandoned | Displays whether a customer abandoned the interaction or not. |
| Abandoned in Queue | The name of the queue in which the Abandon occurred. |
| Agent Assist | Displays whether an interaction had Agent Assist or not. |
| To | The email address or SMS number that the interaction is sent to. This field cannot have more than 10 email addresses.The maximum number of recipients displayed in the To field is 10. |
| From | The email address or SMS number from which the interaction is sent. |
| Email CC | The email addresses to which a copy of the email is sent to. This field cannot have more than 10 email addresses. The maximum number of recipients displayed in the CC field is 10. |
| Email BCC | The email addresses to which a copy of the email is sent to, but that name is not visible to other recipients of the message. This field cannot have more than 10 email addresses. The maximum number of recipients displayed in the BCC field is 10. |
| Flagged | Indicates calls flagged for voice quality issues. For more information about flagging calls, see Flag a problematic voice interaction or Flag a problematic phone call. |
| Wrap-up Notes | Whether an agent wrote a wrap-up note or not. If the agent wrote a note, a preview of the note displays when you hover over the column. |
| Blind Transferred | Displays whether the interaction had a blind transfer. |
| Barged-in | Indicates whether a supervisor barged into the conversation. |
| Cleared by Customer | Indicates whether the conversation was cleared by the customer. |
| Coached | Indicates whether a supervisor coached on the conversation. |
| Co-browse | Displays whether the interaction had a co-browse session. |
| Consulted | Displays whether the interaction had a consult. |
| Consult Transferred | Displays whether the interaction had a consult transfer. |
| Conversation ID | The specific conversation ID for the interaction. |
| Division | Displays the divisions associated with the interaction. See About access control. |
| End Date | The time and date the interaction ended. This column is blank if the interaction is still in progress. |
| Message Type | The ACD message type used. |
| Non-ACD | Displays whether the interaction involved ACD. |
| Recording | Yes indicates that the conversation was initially recorded at the external trunk by the Edge. It does not consider whether the customer's policies actually retained it. No indicates that the conversation was not recorded at the external trunk by the Edge. N/A indicates a digital interaction. |
| Screen Share | Displays whether the interaction contains a screen share session. |
| SIP Call ID | Displays the globally unique identifier embedded in all SIP requests and responses for the interaction. |
| Users - Alerted | The agents Genesys Cloud alerted for the interaction. |
| Users - Interacted | The users who actually interacted during the interaction. |
| Voicemail | Displays whether the interaction has voicemail. Includes personal and queue voicemail. |
| Session DNIS | Any DNIS number dialed during the interaction, including the original DNIS number. |
| Inbound Media | The count of inbound media for an interaction. |
| Has Media | Indicates when message-type conversations have media (images, files, and so on) attached. |
| Provider | The source provider for the conversation. For example, Genesys Cloud EMAIL, Edge, and so on. |
| Emails Sent | Count of the number of emails sent by an agent, including Reply All and Forward. |
| Monitored | Whether the interaction was monitored. |
| First Queue | First queueID in the conversation, formatted as name. |
| Last Wrap-Up | The last wrap-up code used on the conversation. |
| Disconnect Type | The reason the interaction got disconnected.
|
| Subject | First instance of an email subject in the conversation. |
| Flow-Out Type | Shows the type of flowout for a conversation that was a flowout from a queue. |
| Error Code | The name of the error code for the interaction. For more information, see Station errors and Error codes. |
| Outbound Media | The number of outbound media for an interaction. |
| Users - Not Responding | The agents who did not answer the interaction, and the agent may have transitioned to Not Responding. |
| Authenticated | Yes for an authenticated web messaging interaction, No for a web messaging interaction that is not authenticated, or N/A if not a web messaging interaction. |
| External Tag | Displays the external tag that is attached to the conversation record. Note: This data is not available for web chat interactions. |
| Parked | Displays if the interaction has been parked. |
| Delivery Status | The status of the attempted delivery of email, SMS, and WhatsApp messages. The Email delivery status is available for the agentless emails sent via the email campaigns or Agentless Email Notification API. The SMS delivery status is available for all outbound SMS messages including agentless and agent-sent SMS messages. The WhatsApp delivery Status is available for all inbound and outbound WhatsApp messages, including agentless and agent-sent WhatsApp messages. Supported Delivery Status metrics for email and SMS messages include:
Supported Delivery Status metrics for WhatsApp messages include:
|
| Delivery Status Details | Additional details about the delivery, including engagement metrics. For more information, see SMS delivery receipts, Email delivery receipts, and WhatsApp delivery receipts. |
| Conversation Initiator | Displays interactions initiated by a selected initiator (external, user, workflow, customer, or agent). |
| Customer Participation | Displays email and message interactions during which a customer participated, or a customer did not participate. |
| Social Classification | Displays the type of social listening data such as Public or Private. Lists one value for each interaction. The social listening data is classified as public or private based on the type of first conversation received. For example:
|
Journey
| Column | Description |
|---|---|
| Column | Description |
| Has Customer Journey Data | Displays whether an interaction has Predictive Engagement customer journey data associated with it. |
| Proactive | Displays whether Predictive Engagement offered a chat during a customer's website visit based on the Predictive Engagement action map settings. |
Metrics
| Column | Description |
|---|---|
| Column | Description |
| Alert Segments | The number of alerts. |
| Inbound Messages | The number of individual messages exchanged during a conversation where the session’s direction is inbound. It includes all messages sent by both the customer and the agent. |
| Outbound Messages | The number of individual messages exchanged during a conversation where the session’s direction is outbound. It includes all messages sent by both the customer and the agent. |
| Messages | The total number of individual messages exchanged during a conversation. This number includes both the inbound and outbound messages sent by both the customer and the agent. |
| Inbound SMS/MMS Segments | The number of message segments based on their segment count. |
| Outbound SMS/MMS Segments | The number of message segments based on their segment count. |
| Agentless Emails | The number of emails sent by a campaign excluding the emails sent by an agent. |
| Blind Transfers | The number of interactions an agent answered in one queue and then blind transferred. A blind transfer counts for the queue in which an agent answers the interaction. |
|
Callback - Time to first connect |
The amount of time between the start of the callback ACD and the start of the first interaction segment on the voice channel. Note: This metric tracks the time from ACD to agent connect. If a callback is directly transferred from one agent to another agent, the callback is not associated with that ACD queue, and the time to connect is not calculated. |
|
Callback - Time to first dial |
The amount of time between the start of the callback ACD and the start of the first dialing segment on the voice channel. Note: This metric tracks the time from ACD to agent dial. If a callback is directly transferred from one agent to another agent, the callback is not associated with that ACD queue, and the time to dial is not calculated. |
| Consults | The number of interactions an agent answered and then consulted with another participant with or without fully transferring the interaction. A consult counts for the queue in which an agent answers the interaction, even if they consult with another queue. |
| Consult Transfers | The number of call interactions an agent answered in one queue and then consult transferred, meaning they connected with a person or queue before transferring the call. A consult transfer counts for the queue in which an agent answers the interaction. See Consult transfer a call. |
| Contacting Segments | The number of times during an interaction where the system was connecting to the agent's phone before dialing out. |
| Dialing Segments | The number of times during an interaction that the system dials out. |
| Hold Segments | The number of times the agent places the customer on hold. |
| IVR Segments | The number of times the interaction enters an IVR. |
| Queue Segments | The number of times an interaction enters a queue. For example, if an agent accepts an interaction in queue A, transfers it to queue B, and then an agent transfers the interaction back to queue A, then Queue Segments equal 3. |
| Talk Segments | The number of times an agent and customer talk. For example, in an interaction where an agent accepts an interaction, talks to the customer, places the customer on hold, and then talks the customer again, the Talk Segment equals 2. |
| Total ACW | The cumulative time spent in after-call work (ACW) on all interactions. After-call work is the work that an agent performs immediately following an interaction. Work may involve keying activity codes, updating customer databases, filling out forms, or initiating outbound contact. As a metric, it indicates the total time an agent takes to finish working on a call. If an agent must complete work before the agent can handle the next contact, then ACW is factored into the average handle time. |
| Total Alert | The total time Genesys Cloud alerts agents before the agent accepts or declines an interaction. |
| Total Contacting | The total time an interaction spent connecting to the agent's phone before dialing out. |
| Total Dialing | The total time spent dialing out. |
| Total Handle | The total amount of time agents spend on an interaction including time spent contacting, time spent dialing, talk time, hold time, and after call work. |
| Total Hold | The total amount of time the customer was on hold. |
| Total IVR | The total amount of time spent in IVR. |
| Total Queue | The amount of time the interaction spent waiting on an Automatic Call Distributor before connecting to an agent. |
| Total Talk |
The total amount of time the agent spends talking to the customer. For example, in an interaction where an agent accepts an interaction, talks to the customer for two minutes, places the customer on hold for one minute, and then talks to the customer again for two minutes, the Total Talk equals 4 minutes. Note: The total Talk times for Callbacks currently include both the agents' Callback session and agents' Call session, which results in an inflated time. For more information on callback analytics improvements, see Callback analytics improvements. |
| Transfers | A measurement of the number of interactions an agent answered in one queue and then transferred. A transfer counts for the queue in which an agent answers the interaction. This measurement is calculated by the number of interactions blind transferred or consult transferred. |
| Time to Abandon | The duration of time until the conversation was abandoned. |
| Total Barge-In | Total time spent on the interaction after barging into the conversation. |
| Total Coaching | Total time spent coaching in the conversation. |
| Total Voicemail | Total duration of voicemails included in the conversation. |
| User Segments | The number of times an agent (user) was on an interaction. For example, if agent A answered an email interaction twice, and agent B answered the same email interaction once, then user segments would be 3. |
| Wrap-up Segments | The number of times an interaction was in wrap-up. |
| Total Monitor | Total time that the user spent monitoring interactions. |
| Error Count | The number of errors for the interaction. |
| Active Total Callback | Active total callback duration is the sum of all calling activity for the call portions of the callback. For example, the active total callback duration could include all durations from the call portion of a callback: tContacting --> tDialing --> tTalk --> tHeld --> tTalk --> tAcw. |
| Active Park | Displays the duration of the interaction that is currently parked. |
| Total Park | Displays the total parked duration of the completed interaction. |
| Not Responding | The number of times an agent did not respond to the interaction. |
Outbound
| Column | Description |
|---|---|
| Column | Description |
| Campaign Name | The name of the campaign associated with the interaction. |
| Contact List | The name of the contact list associated with the interaction. |
| Contact ID | The contact ID associated with the interaction. |
| Call Analysis Result |
The type of call detected based on call analysis. Results include disconnect, live voice, busy, machine, no answer, SIT callable, fax, line connected, speech, SIT uncallable, and not found. |
| Outbound Attempt | The number of attempts made to call the customer. |
| Campaign | Whether an interaction has a campaign associated with it. |
| Campaign Start | The start date of the first outbound call of a campaign. |
| Time to Flow | The amount of time it took for the campaign call to enter a flow. |
| Time to Agent | The amount of time it took for the campaign call to reach an agent. |
| Campaign Caller Name | The name of the customer being called by the campaign. |
Routing
| Column | Description |
|---|---|
| Column | Description |
| Agent Bullseye Ring | Indicates the bullseye ring an agent is assigned to. |
| Bullseye Ring | Indicates the bullseye ring in which the interaction was answered. |
| Direct Routing | Indicates whether Direct Routing was requested and/or used. |
| Languages | Displays the languages set by the routing service for the interaction. |
| Manual Agents Assigned | On-queue agents who were manually assigned this waiting interaction. |
| Manual Assigner | User with the appropriate permissions who manually assigned this interaction to a waiting agent in the queue. |
| Predictive Agent Selected | Lists the agents used during predictive routing. |
| Predictive Agents Proposed |
Lists the agents evaluated during predictive routing. Note: If your role does not include the Routing > Predictor > View permission, then the Predictive Agents Proposed column does not appear.
|
| Preferred Agents | Lists the preferred agents requested during interaction routing, even if the system was not able to route the interaction to the preferred agents. Includes the agent's routing score. |
| Preferred Agents Requested | Displays whether an interaction had preferred agents requested due to preferred agents configuration, even if the system was not able to route the interaction to the preferred agents. |
| Preferred Rule | Indicates the rule in for the preferred agent. |
| Routing Requested | Displays the routing methods that were requested for the interaction. Gives insight into each of the routing methods the conversation went through prior to being answered, abandoned, or flow-out. The routing data is relevant beginning September 5, 2020. |
|
Routing Rule |
Indicates the routing rings associated with an interaction. |
| Routing Used | Displays the routing method that was used to get to the agent who answered the interaction. The routing data is relevant beginning September 5, 2020. |
| Skills | Displays the original skills that came from the flow. |
| Skills - Active | Displays the skills remaining on the interaction used for routing. |
| Skills — Removed | Displays skills removed from the interaction through bullseye routing. |
Surveys
| Column | Description |
|---|---|
| Column | Description |
| Has Survey Data | Displays whether an interaction is associated with survey data. |
| Promoter Score | The promoter score given by a survey respondent in a survey. Genesys Cloud uses the promoter score to calculate the survey's overall NPS. For more information about NPS, see Net Promoter Score web survey question overview. |
| Survey Form | The name of the survey form sent. |
| Survey Score | The completed surveys' percentage score. The score does not include NPS. |
| Survey Status |
Displays the status of the survey:
|
| Surveys | The number of surveys sent related to the interaction. |
| Survey Type | Displays the type of the survey, such as voice or web. One value is listed for each survey that is associated with the interaction. |
Queues Performance Detail view
Performance
| Column | Description | Columns live update |
|---|---|---|
| Column | Description | Columns live update |
| Offered | The number of interactions routed into the queue for an agent to answer. Offered interactions are either answered, abandoned, or flow-out interactions. |
Yes |
| Inbound Audio | The number of inbound audio or voice messages received from a customer. Notes: Since messaging is asynchronous, in rare instances, when an agent ends an interaction while an end customer finishes recording and sending a voice note, the last audio file attachment or voice note is not considered for analytics. The audio attachment of the conversation remains intact and is preserved as part of the conversation. There is no data loss. The agent still receives and views the voice note. You can see the impact only in the count of the inbound audio metric. The inbound audio metric can be undercounted. |
Yes |
| Outbound Audio | The number of outbound audio or voice messages sent by an agent. |
Yes |
| Answer % | The percentage of offered interactions that an agent answered. Calculated by: (Answered / Offered) * 100 |
Yes |
| Answered (in Answered % column) | A measurement of the number of assigned ACD interactions answered by an agent in a given period. Answered increments when the agent is the first to connect to the interaction. |
Yes |
| Abandon % | The percentage of offered interactions in which the customer disconnected before connecting with an agent. The abandon rate can identify queues that require extra staff to handle interactions in a timely manner. Calculated by: (Abandoned Count / Offered Count) * 100 |
Yes |
| Abandoned (in Abandoned % column) | The number of times an end user abandoned an interaction in a queue. For example, the customer hangs up before an agent answers, or the system disconnects the interaction. |
Yes |
| Outbound | This metric represents the number of outbound interactions placed on behalf of queue. |
Yes |
| Flow-Out | Flow-outs are interactions that enter and leave a queue without getting answered by an agent and without getting disconnected. Flow-outs are an indication of customer service level and queue productivity. High numbers of flow-outs can indicate staffing issues or ineffective agents when used with high handle times (bullseye matching metrics). Flow-outs can include transfers to voicemail, callbacks, and any system-driven events such as in-queue flows that transfer to another queue or external party after a certain amount of time. Flow-outs can also occur if the caller opts to exit out of the queue and return to the IVR. Offered interactions are either flow-out, answered, or abandoned interactions. |
Yes |
| ASA | The average amount of time an interaction waits in the queue before an agent answers. This metric does not include interactions that agents do not answer. Average Speed of Answer (ASA) is directly associated with the service level and provides insight into the customer service your organization provides. ASA is recorded in the interval in which the agent answered the interaction. Calculated by: Total Answered (tAnswered Sum) / Answered Count (tAnswered Count) Note: Raw values are provided in milliseconds. |
Yes |
| Service Level % |
Service level target is a contact center performance statistic expressed as “X percent of conversations answered in Y seconds.” For example, a goal of answering 80% of voice calls within 20 seconds provides a service level target of 80/20. You can set the service level target for each media type in a queue. Analytics uses this service level target to calculate whether you are within the service level % defined by your service level agreement (SLA). For more information about setting the service level target, see Create queues or Edit or delete queues. Note: In the performance views that are not queue-specific, the Service Level % is calculated by queue and displayed as a – on the aggregated group row since SLA targets vary by queue. The affected views are DNIS Performance Summary and Skills Performance views. To view individual queue service level %, click the + to expand the row.
The service level % is the percentage of interactions that meet your contact center's service level target. The formula to calculate the service level % is:
Number of Conversations Answered within SLA The numerator is calculated by taking the total answered conversations and subtracting the conversations that were not answered within the SLA threshold. Calculated by: (Answered Count – SLA Violation Count) Total Number of Conversations The Service Level Options configuration determines the denominator. With all the options below unchecked, the denominator is the count of answered conversations.
As the service level calculation depends on an organization’s configured options, the final formula to calculate the service level is:
Notes:
In this view, the service level set for the queue appears as a gray number beside the service level percentage for the interval. If the service level percentage for the interval is lower than the set service level, then the service level percentage is red. |
Yes |
| Avg Wait | The average amount of time an interaction is in a queue before an agent answers it, before the interaction moves out of the queue, or before the customer abandons the interaction. Calculated by: Total Wait Time / Interactions |
Yes |
| Handle | The total number of ACD and non-ACD interactions that agents were involved in for the selected media type. Handle increments in the interval in which the interaction ends, after the agent completes any after call work and completes the interaction. |
Yes |
| Avg Handle |
The average amount of time agents spent handling interactions. This calculation includes talk time, hold time, and after-call work. For outbound calls it also includes dialing and contacting time. Calculated by: (cumulative talk time + cumulative hold time + cumulative after-call work + cumulative dialing time + cumulative contacting time) / Number of interactions handled Note: The interactions can span multiple time intervals. For example, a 45-minute call spans two 30-minute intervals. However, metrics are assigned a single timestamp and reported in the interval into which this timestamp falls. The timestamps are assigned based on when the metric calculation is complete.
For instance, handle time will use the timestamp of after call work completion. In the example of a 45-minute call, the handle time falls in the second 30-minute interval because the handle time was calculated at the end of the call when ACW was submitted. In these views, the Avg Talk, Avg Hold, and Avg ACW columns do not equal the Avg Handle column because only some interactions include holds. This view calculates the average handle column using cumulative counts rather than averages. |
Yes |
| Avg Talk | The average number of seconds spent interacting on a media type. Calculated by: Total Talk time / Count of interactions with Talk time |
Yes |
| Avg Hold | The average number of seconds that interactions were placed on hold. Calculated by: Total Hold Time / Count of interactions with holds |
Yes |
| Avg ACW | The average amount of time agents spent completing after-call work. Calculated by: Total ACW / Interactions with ACW |
Yes |
| Avg Dialing | The average amount of time an agent spends dialing and waiting for a contact to answer during outbound interactions.
Calculated by: (total dialing time/ total number of dialing segments) |
Yes |
| Avg Contacting | The average amount of time an outbound interaction takes to connecting to the agent’s phone. Usually, this duration is short. However, if the agent uses a remote phone the duration may be longer. |
Yes |
| Total Handle | The total amount of time agents spend on an interaction including time spent contacting, time spent dialing, talk time, hold time, and after call work. |
Yes |
| Total Talk | The total amount of time spent interacting on all the conversations by the agent, within an interval. For example, in an interaction, where an agent accepts an interaction, talks to the customer for two minutes, places the customer on hold for one minute, and then talks to the customer again for two minutes, the Total Talk equals 4 minutes. |
Yes |
| Total Hold | The cumulative hold time for all interactions. |
Yes |
| Total ACW | The cumulative time spent in after-call work (ACW) on all interactions. After-call work is the work that an agent performs immediately following an interaction. Work may involve keying activity codes, updating customer databases, filling out forms, or initiating outbound contact. As a metric, it indicates the total time an agent takes to finish working on a call. If an agent must complete work before the agent can handle the next contact, then ACW is factored into the average handle time. |
Yes |
| Total Dialing | The total amount of time an outbound interaction spends dialing a contact. |
Yes |
| Total Contacting | The total amount of time outbound interactions take to connect to the agent’s phone. Usually, this duration is short. However, if the agent uses a remote phone the duration may be longer. |
Yes |
| Hold | The number of interactions with holds. |
Yes |
| Transfer | A measurement of the number of interactions an agent answered in one queue and then transferred. A transfer counts for the queue in which an agent answers the interaction. This measurement is calculated by the number of interactions blind transferred or consult transferred. |
Yes |
| Blind Transfer | The number of interactions an agent answered in one queue and then blind transferred. A blind transfer counts for the queue in which an agent answers the interaction. |
Yes |
| Consult Transfer | The number of call interactions an agent answered in one queue and then consult transferred, meaning they connected with a person or queue before transferring the call. A consult transfer counts for the queue in which an agent answers the interaction. See Consult transfer a call. |
Yes |
| Total Wait | The total amount of time an interaction is in a queue before an agent answers it, it flows out, or the customer abandons it. Genesys Cloud calculates the wait time in milliseconds. |
Yes |
| Avg Abandon | The average amount of time before a customer disconnects in an ACD queue before connecting with an agent. For example, the customer hangs up before an agent answers, or the system disconnects the interaction. |
Yes |
| Total Abandon | The total amount of time interactions are in queue waiting for an agent to answer them before customers abandoned the interactions. |
Yes |
| Connection | The number of interactions that initially connected to the contact center in a particular location, such as a queue or IVR. |
Yes |
| Inbound Media | The count of inbound media for an interaction. |
Yes |
| Transfer % | The number of transfers compared with the total number of interactions answered. Calculated by: (No. of transfers / interactions answered) * 100 |
Yes |
| Max Abandon | The maximum time of an abandoned interaction for the selected interval. |
Yes |
| Min Abandon | The minimum time of an abandoned interaction for the selected interval. |
Yes |
| Max Wait | The maximum amount of time spent waiting in queue for the selected interval. |
Yes |
| Min Wait | The minimum amount of time spent waiting in queue for the selected interval. |
Yes |
| Max Talk | The maximum amount of time spent interacting for the selected interval. |
Yes |
| Min Talk | The minimum amount of time spent interacting for the selected interval. |
Yes |
| Max Hold | The maximum amount of time spent on hold for the selected interval. |
Yes |
| Min Hold | The minimum amount of time spent on hold for the selected interval. |
Yes |
| Max ACW | The maximum amount of time spent on after call work for the selected interval. |
Yes |
| Min ACW | The minimum amount of time spent on after call work for the selected interval. |
Yes |
| Over SLA | Number of interactions that were over the defined Service Level. |
Yes |
| Met SLA | Number of interactions that met the defined service level. |
Yes |
| Short Abandon | Number of interactions that were short abandoned. |
Yes |
| Short Abandon % | Percent of interactions that were short abandoned. |
Yes |
| Abandon – No Short | Number of abandons excluding the short abandons. |
Yes |
| Abandon – No Short % | Percent of abandons excluding the short abandons. |
Yes |
| Outbound Attempt | Attempted outbound interactions for Dialer campaigns. |
Yes |
| Voicemail | Count of voicemails received. |
Yes |
| Error | The number of errors that occurred on the queue conversations. |
Yes |
| SL % | The service level percentage for the queue. |
Yes |
| SL Target % | The service level target percentage for the queue. |
Yes |
| Contacting | The number of contacting segments for the queue and interval. |
Yes |
| Dialing | The number of dialing segments for the queue and interval. |
Yes |
| Avg Hold Handled | The average time any interaction spent on hold. This calculation takes into account all interactions handled, not just those that were held. Calculated by: Total Hold Time / Number of Interactions Handled. |
Yes |
| Avg ACW Handled | The average time any interaction spent in ACW. This calculation takes into account all interactions handled, not just those that had ACW. Calculated by: Total ACW Time / Number of Interactions Handled |
Yes |
| Outbound Media | The number of outbound media for an interaction. |
Yes |
|
ACW |
The number of times after-call work (ACW) was completed. After-call work is the work that an agent performs immediately following an interaction. Work may involve keying activity codes, updating customer databases, filling out forms, or initiating outbound contact. As a metric, it indicates the total time an agent takes to finish working on a call. If an agent must complete work before the agent can handle the next contact, then ACW is factored into the average handle time. Note: By default, the summary of metrics displayed includes all activity for the agent. To filter down to the activities specific to a queue, you can apply a filter. |
Yes |
|
Talk |
The number of sessions where the user(s) interacted during conversations. A session includes the point where the agent joins the conversation to the point where they disconnect. |
Yes |
|
Wait |
The number of interactions that waited in the queue. |
Yes |
|
Avg Flow-Out |
The average amount of time an interaction spends in queue before it flows out. Calculated by: Total Flow Out Time / Count of interactions with flow-outs For more information, see Queues Performance Summary view. |
Yes |
|
Max Flow-Out |
The maximum amount of time an interaction spends in queue before it flows out. For more information, see Queues Performance Summary view. |
Yes |
|
Total Active Callback |
The time an agent spent on a callback while a call is active. |
Yes |
|
Min Active Callback |
The minimum time an agent spent on a callback while a call is active. |
Yes |
|
Max Active Callback |
The maximum time an agent spent on a callback while a call is active. |
Yes |
|
Avg Active Callback |
The average time an agent spent on a callback while a call is active. |
Yes |
|
Active Callback |
The instances of an agent on a callback while a call is active. |
Yes |
|
Min Flow-Out |
The minimum amount of time an interaction spends in queue before it flows out. For more information, see Queues Performance Summary view. |
Yes |
Routing
For an overview of routing methods, see Routing and evaluation methods.
| Column | Description | Columns live update |
|---|---|---|
| Bullseye Requested | The number of interactions in which bullseye routing was requested. |
No |
| Bullseye Requested % | The rate of answered interactions in which bullseye routing was requested in comparison to all answered interactions. |
No |
| Bullseye Used | The number of answered interactions in which bullseye routing was used. |
No |
| Bullseye Used % | The rate of interactions in which bullseye routing was used in comparison to all answered interactions. |
No |
|
Conditional Requested |
The number of interactions in which conditional routing was requested. | No |
|
Conditional Requested % |
The rate of answered interactions in which conditional routing routing was requested in comparison to all answered interactions. | No |
|
Conditional Used |
The number of interactions in which conditional routing was used. | No |
|
Conditional Used % |
The rate of interactions in which conditional routing was used in comparison to all answered interactions. | No |
| Direct Requested | The number of interactions in which direct routing was requested. | No |
|
Direct Requested % |
The rate of answered interactions in which direct routing was requested in comparison to all answered interactions. | No |
|
Direct Used |
The number of answered interactions in which direct routing was used. | No |
|
Direct Used % |
The rate of interactions in which direct routing was used in comparison to all answered interactions. | No |
| Last Requested | The number of answered interactions in which last routing was used. See Last agent handling. |
No |
| Last Requested % | The rate of interactions in which last routing was requested in comparison to all answered interactions. See Last agent handling. |
No |
| Last Used | The number of answered interactions in which last routing was used. See Last agent handling. |
No |
| Last Used % | The rate of interactions in which last routing was used in comparison to all answered interactions. See Last agent handling. |
No |
| Manual Used | The number of answered interactions in which manual routing was used. |
No |
| Manual Used % | The rate of interactions in which manual routing was used in comparison to all answered interactions. |
No |
| Predictive Requested | The number of answered interactions in which predictive routing was requested. |
No |
| Predictive Requested % | The rate of interactions in which predictive routing was requested in comparison with all answered interactions. |
No |
| Predictive Used | The number of answered interactions in which predictive routing was used. |
No |
| Predictive Used % | The rate of interactions in which predictive routing was used in comparison with all answered interactions. |
No |
| Preferred Requested | The number of answered interactions in which preferred agent routing was used. |
No |
| Preferred Requested % | The rate of interactions in which preferred agent routing was requested in comparison with all answered interactions. |
No |
| Preferred Used | The number of answered interactions in which preferred agent routing was used. |
No |
| Preferred Used % | The rate of interactions in which preferred agent routing was used in comparison to all answered interactions. |
No |
| Standard Requested | The number of answered interactions in which standard routing was requested. |
No |
| Standard Requested % | The rate of interactions in which standard routing was requested in comparison to all answered interactions. |
No |
| Standard Used | The number of answered interactions in which standard routing was used. |
No |
| Standard Used % | The rate of interactions in which standard routing was used in comparison to all answered interactions. |
No |
Surveys
| Column | Column Description | Columns live update |
|---|---|---|
| Response Rate | The number of surveys that customers complete compared with the total number of surveys sent. Surveys sent includes successfully delivered survey invitations and survey invitations that Genesys Cloud attempted to send but could not deliver due to an error, such as an invalid email address or invalid survey form. Calculated by: (Surveys Completed / Surveys Sent) * 100 |
No |
| Sent | The number of surveys sent. This metric includes successfully delivered survey invitations and survey invitations that Genesys Cloud attempted to send but could not deliver due to an error, such as an invalid email address or invalid survey form. |
No |
| In Progress | The number of surveys that customers opened but did not submit. This metric does not include surveys that customers opened but did not submit before the survey expired. |
No |
| Complete | The number of surveys customers have opened and submitted. |
No |
| Surveys Abandon | The number of surveys that customers opened but did not submit before the survey expired. |
No |
| Survey Expire | The number of surveys that expired before the customer opened it. |
No |
| Survey Errors | The number of surveys that Genesys Cloud attempted but failed due to an error. The error includes errors in delivery such as an invalid email address, errors that occurred during the Survey Invite Flow, or other errors in the survey creation. |
No |
| Avg Survey Score | The average of completed surveys' percentage scores. The average score does not include NPS. Calculated by (Sum of completed survey percentage scores / number of completed surveys) * 100 |
No |
| NPS | The Net Promoter ScoreSM (NPS) of completed surveys. The score can range from -100 to 100. Calculated by (Promoters - Detractors) / number of responses) * 100 For more information about Promoters, Detractors, and NPS, see Net Promoter Score web survey question overview. |
No |
| Complaint |
The number of errors related to email recipient, system blocking, or identifying the survey sender as spam. |
No |
| Outstanding |
The number of outstanding surveys. Calculated by (Number of surveys sent) – completed – expired – abandoned – bounced – complaints |
No |
| Full response | The number of full survey responses with all required questions that were answered by the customers. |
No |
| Partial Response | The number of partial survey responses with any required questions that were unanswered by the customers. |
No |
| Voice Survey | The number of voice surveys. |
No |
| Web Survey | The number of web surveys. |
No |
| Bounce | The number of times a survey was sent out and returned by the recipient's email server, usually caused by an invalid email address. |
No |
Speech and text analytics
| Column | Column Description | Columns live update |
|---|---|---|
| Avg Sentiment | Average customer sentiment score (-100 to 100) in the specified interval with the provided filters. |
No |
| Negative Sentiment Instances | The number of negative sentiment instances. For more information, see Understand sentiment analysis. |
No |
| Overall Avg Sentiment Score | The average overall sentiment score of the interactions. Calculated by: oSentimentScore.sum / oSentimentScore.count |
No |
| Positive Sentiment Instances | The number of positive sentiment instances. For more information, see Understand sentiment analysis. |
No |
| Sentiment Instances | Number of instances of sentiment in the given interval with the provided filters. |
No |
Queues Performance Summary view
Performance
| Column | Description | Columns live update |
|---|---|---|
| Column | Column Description | Columns live update |
| Name | The name of the queue. |
Yes |
| Inbound Audio | The number of inbound audio or voice messages received from a customer. Notes: Since messaging is asynchronous, in rare instances, when an agent ends an interaction while an end customer finishes recording and sending a voice note, the last audio file attachment or voice note is not considered for analytics. The audio attachment of the conversation remains intact and is preserved as part of the conversation. There is no data loss. The agent still receives and views the voice note. You can see the impact only in the count of the inbound audio metric. The inbound audio metric can be undercounted. |
Yes |
| Outbound Audio | The number of outbound audio or voice messages sent by an agent. |
Yes |
| Offer | The number of interactions routed into the queue for an agent to answer. Offered interactions are either answered, abandoned, or flow-out interactions. |
Yes |
| Answer % | The percentage of offered interactions that an agent answered. Calculated by: (Answered / Offered) * 100 |
Yes |
| Answer (in Answer % column) | A measurement of the number of assigned ACD interactions answered by an agent in a given period. Answered increments when the agent is the first to connect to the interaction. |
Yes |
| Abandon % | The percentage of offered interactions in which the customer disconnected before connecting with an agent. The abandon rate can identify queues that require extra staff to handle interactions in a timely manner. Calculated by: (Abandoned Count / Offered Count) * 100 |
Yes |
| Abandon (in Abandon % column) | The number of times an end user abandoned an interaction in a queue. For example, the customer hangs up before an agent answers, or the system disconnects the interaction. |
Yes |
| Outbound | This metric represents the number of outbound interactions placed on behalf of queue. |
Yes |
| Flow-Out | Flow-outs are interactions that enter and leave a queue without getting answered by an agent and without getting disconnected. Flow-outs are an indication of customer service level and queue productivity. High numbers of flow-outs can indicate staffing issues or ineffective agents when used with high handle times (bullseye matching metrics). Flow-outs can include transfers to voicemail, callbacks, and any system-driven events such as in-queue flows that transfer to another queue or external party after a certain amount of time. Flow-outs can also occur if the caller opts to exit out of the queue and return to the IVR. Offered interactions are either flow-out, answered, or abandoned interactions. |
Yes |
| ASA | The average amount of time an interaction waits in the queue before an agent answers. This metric does not include interactions that agents do not answer. Average Speed of Answer (ASA) is directly associated with the service level and provides insight into the customer service your organization provides. ASA is recorded in the interval in which the agent answered the interaction. Calculated by: Total Answered (tAnswered Sum) / Answered Count (tAnswered Count) Note: Raw values are provided in milliseconds. |
Yes |
| Service Level % |
Service level target is a contact center performance statistic expressed as “X percent of conversations answered in Y seconds.” For example, a goal of answering 80% of voice calls within 20 seconds provides a service level target of 80/20. You can set the service level target for each media type in a queue. Analytics uses this service level target to calculate whether you are within the service level % defined by your service level agreement (SLA). For more information about setting the service level target, see Create queues or Edit or delete queues. Note: In the performance views that are not queue-specific, the Service Level % is calculated by queue and displayed as a – on the aggregated group row since SLA targets vary by queue. The affected views are DNIS Performance Summary and Skills Performance views. To view individual queue service level %, click the + to expand the row.
The service level % is the percentage of interactions that meet your contact center's service level target. The formula to calculate the service level % is:
Number of Conversations Answered within SLA The numerator is calculated by taking the total answered conversations and subtracting the conversations that were not answered within the SLA threshold. Calculated by: (Answered Count – SLA Violation Count) Total Number of Conversations The Service Level Options configuration determines the denominator. With all the options below unchecked, the denominator is the count of answered conversations.
As the service level calculation depends on an organization’s configured options, the final formula to calculate the service level is:
Notes:
In this view, the service level set for the queue appears as a gray number beside the service level percentage for the interval. If the service level percentage for the interval is lower than the set service level, then the service level percentage is red. |
Yes |
| Avg Wait | The average amount of time an interaction is in a queue before an agent answers it, before the interaction moves out of the queue, or before the customer abandons the interaction. Calculated by: Total Wait Time / Interactions |
Yes |
| Handle | The total number of ACD and non-ACD interactions that agents were involved in for the selected media type. Handle increments in the interval in which the interaction ends, after the agent completes any after call work and completes the interaction. |
Yes |
| Avg Handle |
The average amount of time agents spent handling interactions. This calculation includes talk time, hold time, and after-call work. For outbound calls it also includes dialing and contacting time. Calculated by: (cumulative talk time + cumulative hold time + cumulative after-call work + cumulative dialing time + cumulative contacting time) / Number of interactions handled Note: The interactions can span multiple time intervals. For example, a 45-minute call spans two 30-minute intervals. However, metrics are assigned a single timestamp and reported in the interval into which this timestamp falls. The timestamps are assigned based on when the metric calculation is complete.
For instance, handle time will use the timestamp of after call work completion. In the example of a 45-minute call, the handle time falls in the second 30-minute interval because the handle time was calculated at the end of the call when ACW was submitted. In these views, the Avg Talk, Avg Hold, and Avg ACW columns do not equal the Avg Handle column because only some interactions include holds. This view calculates the average handle column using cumulative counts rather than averages. |
Yes |
| Avg Talk | The average number of seconds spent interacting on a media type. Calculated by: Total Talk time / Count of interactions with Talk time |
Yes |
| Avg Hold | The average number of seconds that interactions were placed on hold. Calculated by: Total Hold Time / Count of interactions with holds |
Yes |
| Avg ACW | The average amount of time agents spent completing after-call work. Calculated by: Total ACW / Interactions with ACW |
Yes |
| Avg Dialing | The average amount of time an agent spends dialing and waiting for a contact to answer during outbound interactions.
Calculated by: (total dialing time/ total number of dialing segments) |
Yes |
| Avg Contacting | The average amount of time an outbound interaction takes to connecting to the agent’s phone. Usually, this duration is short. However, if the agent uses a remote phone the duration may be longer. |
Yes |
| Total Handle |
The total amount of time agents spend on an interaction including time spent contacting, time spent dialing, talk time, hold time, and after call work. Sometimes, as after-call work overlaps with the talk time or the hold time, this sum of the cumulative metrics represented in Total Handle is not the same as the Handle metric, which eliminates any overlap. |
Yes |
| Total Talk | The total amount of time spent interacting on all the conversations by the agent, within an interval. For example, in an interaction, where an agent accepts an interaction, talks to the customer for two minutes, places the customer on hold for one minute, and then talks to the customer again for two minutes, the Total Talk equals 4 minutes. |
Yes |
| Total Hold | The cumulative hold time for all interactions. |
Yes |
| Total ACW | The cumulative time spent in after-call work (ACW) on all interactions. After-call work is the work that an agent performs immediately following an interaction. Work may involve keying activity codes, updating customer databases, filling out forms, or initiating outbound contact. As a metric, it indicates the total time an agent takes to finish working on a call. If an agent must complete work before the agent can handle the next contact, then ACW is factored into the average handle time. |
Yes |
| Total Dialing | The total amount of time an outbound interaction spends dialing a contact. |
Yes |
| Total Contacting | The total amount of time outbound interactions take to connect to the agent’s phone. Usually, this duration is short. However, if the agent uses a remote phone the duration may be longer. |
Yes |
| Hold | The number of interactions with holds. |
Yes |
| Transfer | A measurement of the number of interactions an agent answered in one queue and then transferred. A transfer counts for the queue in which an agent answers the interaction. This measurement is calculated by the number of interactions blind transferred or consult transferred. |
Yes |
| Blind Transfer | The number of interactions an agent answered in one queue and then blind transferred. A blind transfer counts for the queue in which an agent answers the interaction. |
Yes |
| Consult Transfer | The number of call interactions an agent answered in one queue and then consult transferred, meaning they connected with a person or queue before transferring the call. A consult transfer counts for the queue in which an agent answers the interaction. See Consult transfer a call. |
Yes |
| Avg Abandon | The average amount of time before a customer disconnects in an ACD queue before connecting with an agent. For example, the customer hangs up before an agent answers, or the system disconnects the interaction. |
Yes |
| Total Wait | The total amount of time an interaction is in a queue before an agent answers it, it flows out, or the customer abandons it. Genesys Cloud calculates the wait time in milliseconds. |
Yes |
| Total Abandon | The total amount of time interactions are in queue waiting for an agent to answer them before customers abandoned the interactions. |
Yes |
| Connection | The number of interactions that initially connected to the contact center in a particular location, such as a queue or IVR. |
Yes |
| Division | Displays the name of a division that an agent or queue belongs to. For more information, see About access control. |
Yes |
| Inbound Media | The count of inbound media for an interaction. |
Yes |
| Transfer % | The number of transfers compared with the total number of interactions answered. Calculated by: (No. of transfers / interactions answered) * 100 |
Yes |
| Max Abandon | The maximum time of an abandoned interaction for the selected interval. |
Yes |
| Min Abandon | The minimum time of an abandoned interaction for the selected interval. |
Yes |
| Max Wait | The maximum amount of time spent waiting in queue for the selected interval. |
Yes |
| Min Wait | The minimum amount of time spent waiting in queue for the selected interval. |
Yes |
| Max Talk | The maximum amount of time spent interacting for the selected interval. |
Yes |
| Min Talk | The minimum amount of time spent interacting for the selected interval. |
Yes |
| Max Hold | The maximum amount of time spent on hold for the selected interval. |
Yes |
| Min Hold | The minimum amount of time spent on hold for the selected interval. |
Yes |
| Max ACW | The maximum amount of time spent on after call work for the selected interval. |
Yes |
| Min ACW | The minimum amount of time spent on after call work for the selected interval. |
Yes |
| Over SLA | Number of interactions that were over the defined Service Level. |
Yes |
| Met SLA | Number of interactions that met the defined service level. |
Yes |
| Short Abandon | Number of interactions that were short abandoned. |
Yes |
| Short Abandon % | Percent of interactions that were short abandoned. |
Yes |
| Abandon – No Short | Number of abandons excluding the short abandons. |
Yes |
| Abandon – No Short % | Percent of abandons excluding the short abandons. |
Yes |
| Outbound Attempt | Attempted outbound interactions for Dialer campaigns. |
Yes |
| Voicemail | Count of voicemails received. |
Yes |
| Error | The number of errors that occurred on the queue conversations. |
Yes |
| SL % | The service level percentage for the queue. |
Yes |
| SL Target % | The service level target percentage for the queue. |
Yes |
| Contacting | The number of contacting segments for the queue and interval. |
Yes |
| Dialing | The number of dialing segments for the queue and interval. |
Yes |
| Avg Hold Handled | The average time any interaction spent on hold. This calculation takes into account all interactions handled, not just those that were held. Calculated by: Total Hold Time / Number of Interactions Handled. |
Yes |
| Avg ACW Handled | The average time any interaction spent in ACW. This calculation takes into account all interactions handled, not just those that had ACW. Calculated by: Total ACW Time / Number of Interactions Handled |
Yes |
| Outbound Media | The number of outbound media for an interaction. |
Yes |
|
ACW |
The number of times after-call work (ACW) was completed. After-call work is the work that an agent performs immediately following an interaction. Work may involve keying activity codes, updating customer databases, filling out forms, or initiating outbound contact. As a metric, it indicates the total time an agent takes to finish working on a call. If an agent must complete work before the agent can handle the next contact, then ACW is factored into the average handle time. Note: By default, the summary of metrics displayed includes all activity for the agent. To filter down to the activities specific to a queue, you can apply a filter. |
Yes |
|
Talk |
The number of sessions where the user(s) interacted during conversations. A session includes the point where the agent joins the conversation to the point where they disconnect. |
Yes |
|
Wait |
The number of interactions that waited in the queue. |
Yes |
|
Avg Flow-Out |
The average amount of time an interaction spends in queue before it flows out. Calculated by: Total Flow Out Time / Count of interactions with flow-outs For more information, see Queues Performance Summary view. |
Yes |
|
Max Flow-Out |
The maximum amount of time an interaction spends in queue before it flows out. For more information, see Queues Performance Summary view. |
Yes |
|
Total Active Callback |
The time an agent spent on a callback while a call is active. |
Yes |
|
Min Active Callback |
The minimum time an agent spent on a callback while a call is active. |
Yes |
|
Max Active Callback |
The maximum time an agent spent on a callback while a call is active. |
Yes |
|
Avg Active Callback |
The average time an agent spent on a callback while a call is active. |
Yes |
|
Active Callback |
The instances of an agent on a callback while a call is active. |
Yes |
|
Min Flow-Out |
The minimum amount of time an interaction spends in queue before it flows out. For more information, see Queues Performance Summary view. |
Yes |
Routing
For an overview of routing methods, see Routing and evaluation methods.
| Column | Description | Columns live update |
|---|---|---|
| Bullseye Requested | The number of interactions in which bullseye routing was requested. |
No |
| Bullseye Requested % | The rate of answered interactions in which bullseye routing was requested in comparison to all answered interactions. |
No |
| Bullseye Used | The number of answered interactions in which bullseye routing was used. |
No |
| Bullseye Used % | The rate of interactions in which bullseye routing was used in comparison to all answered interactions. |
No |
|
Conditional Requested |
The number of interactions in which conditional routing was requested. | No |
|
Conditional Requested % |
The rate of answered interactions in which conditional routing routing was requested in comparison to all answered interactions. | No |
|
Conditional Used |
The number of interactions in which conditional routing was used. | No |
|
Conditional Used % |
The rate of interactions in which conditional routing was used in comparison to all answered interactions. | No |
| Direct Requested | The number of interactions in which direct routing was requested. | No |
|
Direct Requested % |
The rate of answered interactions in which direct routing was requested in comparison to all answered interactions. | No |
|
Direct Used |
The number of answered interactions in which direct routing was used. | No |
|
Direct Used % |
The rate of interactions in which direct routing was used in comparison to all answered interactions. | No |
| Last Requested | The number of answered interactions in which last routing was used. See Last agent handling. |
No |
| Last Requested % | The rate of interactions in which last routing was requested in comparison to all answered interactions. See Last agent handling. |
No |
| Last Used | The number of answered interactions in which last routing was used. See Last agent handling. |
No |
| Last Used % | The rate of interactions in which last routing was used in comparison to all answered interactions. See Last agent handling. |
No |
| Manual Used | The number of answered interactions in which manual routing was used. |
No |
| Manual Used % | The rate of interactions in which manual routing was used in comparison to all answered interactions. |
No |
| Predictive Requested | The number of answered interactions in which predictive routing was requested. |
No |
| Predictive Requested % | The rate of interactions in which predictive routing was requested in comparison with all answered interactions. |
No |
| Predictive Used | The number of answered interactions in which predictive routing was used. |
No |
| Predictive Used % | The rate of interactions in which predictive routing was used in comparison with all answered interactions. |
No |
| Preferred Requested | The number of answered interactions in which preferred agent routing was used. |
No |
| Preferred Requested % | The rate of interactions in which preferred agent routing was requested in comparison with all answered interactions. |
No |
| Preferred Used | The number of answered interactions in which preferred agent routing was used. |
No |
| Preferred Used % | The rate of interactions in which preferred agent routing was used in comparison to all answered interactions. |
No |
| Standard Requested | The number of answered interactions in which standard routing was requested. |
No |
| Standard Requested % | The rate of interactions in which standard routing was requested in comparison to all answered interactions. |
No |
| Standard Used | The number of answered interactions in which standard routing was used. |
No |
| Standard Used % | The rate of interactions in which standard routing was used in comparison to all answered interactions. |
No |
Surveys
| Column | Column Description | Columns live update |
|---|---|---|
| Response Rate | The number of surveys that customers complete compared with the total number of surveys sent. Surveys sent includes successfully delivered survey invitations and survey invitations that Genesys Cloud attempted to send but could not deliver due to an error, such as an invalid email address or invalid survey form. Calculated by: (Surveys Completed / Surveys Sent) * 100 |
No |
| Sent | The number of surveys sent. This metric includes successfully delivered survey invitations and survey invitations that Genesys Cloud attempted to send but could not deliver due to an error, such as an invalid email address or invalid survey form. |
No |
| In Progress | The number of surveys that customers opened but did not submit. This metric does not include surveys that customers opened but did not submit before the survey expired. |
No |
| Complete | The number of surveys customers have opened and submitted. |
No |
| Surveys Abandon | The number of surveys that customers opened but did not submit before the survey expired. |
No |
| Survey Expire | The number of surveys that expired before the customer opened it. |
No |
| Survey Errors | The number of surveys that Genesys Cloud attempted but failed due to an error. The error includes errors in delivery such as an invalid email address, errors that occurred during the Survey Invite Flow, or other errors in the survey creation. |
No |
| Avg Survey Score | The average of completed surveys' percentage scores. The average score does not include NPS. Calculated by (Sum of completed survey percentage scores / number of completed surveys) * 100 |
No |
| NPS | The Net Promoter ScoreSM (NPS) of completed surveys. The score can range from -100 to 100. Calculated by (Promoters - Detractors) / number of responses) * 100 For more information about Promoters, Detractors, and NPS, see Net Promoter Score web survey question overview. |
No |
| Complaint |
The number of errors related to email recipient, system blocking, or identifying the survey sender as spam. |
No |
| Outstanding |
The number of outstanding surveys. Calculated by (Number of surveys sent) – completed – expired – abandoned – bounced – complaints |
No |
| Full response | The number of full survey responses with all required questions that were answered by the customers. |
No |
| Partial Response | The number of partial survey responses with any required questions that were unanswered by the customers. |
No |
| Voice Survey | The number of voice surveys. |
No |
| Web Survey | The number of web surveys. |
No |
| Bounce | The number of times a survey was sent out and returned by the recipient's email server, usually caused by an invalid email address. |
No |
Speech and text analytics
| Column | Column Description | Columns live update |
|---|---|---|
| Avg Sentiment | Average customer sentiment score (-100 to 100) in the specified interval with the provided filters. |
No |
| Negative Sentiment Instances | The number of negative sentiment instances. For more information, see Understand sentiment analysis. |
No |
| Overall Avg Sentiment Score | The average overall sentiment score of the interactions. Calculated by: oSentimentScore.sum / oSentimentScore.count |
No |
| Positive Sentiment Instances | The number of positive sentiment instances. For more information, see Understand sentiment analysis. |
No |
| Sentiment Instances | Number of instances of sentiment in the given interval with the provided filters. |
No |
Queues Wrap-up Detail view
| Column | Description |
|---|---|
| Wrap-up |
Displays the name of the wrap-up code that includes data for the queue and interval. |
| Handle | The total number of ACD and non-ACD interactions that agents were involved in for the selected media type. Handle increments in the interval in which the interaction ends, after the agent completes any after call work and completes the interaction. |
| Avg Handle |
The average amount of time agents spent handling interactions. This calculation includes talk time, hold time, and after-call work. For outbound calls it also includes dialing and contacting time. Calculated by: (cumulative talk time + cumulative hold time + cumulative after-call work + cumulative dialing time + cumulative contacting time) / Number of interactions handled Note: The interactions can span multiple time intervals. For example, a 45-minute call spans two 30-minute intervals. However, metrics are assigned a single timestamp and reported in the interval into which this timestamp falls. The timestamps are assigned based on when the metric calculation is complete.
For instance, handle time will use the timestamp of after call work completion. In the example of a 45-minute call, the handle time falls in the second 30-minute interval because the handle time was calculated at the end of the call when ACW was submitted. In these views, the Avg Talk, Avg Hold, and Avg ACW columns do not equal the Avg Handle column because only some interactions include holds. This view calculates the average handle column using cumulative counts rather than averages. |
| Avg Talk | The average number of seconds spent interacting on a media type. Calculated by: Total Talk time / Count of interactions with Talk time |
| Avg Hold | The average number of seconds that interactions were placed on hold. Calculated by: Total Hold Time / Count of interactions with holds |
| Avg ACW | The average amount of time agents spent completing after-call work. Calculated by: Total ACW / Interactions with ACW |
| Total Handle | The total amount of time agents spend on an interaction including time spent contacting, time spent dialing, talk time, hold time, and after call work. |
| Total Talk | The total amount of time spent interacting on all the conversations by the agent, within an interval. For example, in an interaction, where an agent accepts an interaction, talks to the customer for two minutes, places the customer on hold for one minute, and then talks to the customer again for two minutes, the Total Talk equals 4 minutes. |
| Total Hold | The cumulative time spent in after-call work (ACW) on all interactions. After-call work is the work that an agent performs immediately following an interaction. Work may involve keying activity codes, updating customer databases, filling out forms, or initiating outbound contact. As a metric, it indicates the total time an agent takes to finish working on a call. If an agent must complete work before the agent can handle the next contact, then ACW is factored into the average handle time. |
| Total ACW | The cumulative time spent in after-call work (ACW) on all interactions. After-call work is the work that an agent performs immediately following an interaction. Work may involve keying activity codes, updating customer databases, filling out forms, or initiating outbound contact. As a metric, it indicates the total time an agent takes to finish working on a call. If an agent must complete work before the agent can handle the next contact, then ACW is factored into the average handle time. |
| Hold | The number of interactions with holds. |
| % Handle | The percentage of interactions assigned the wrap-up code in relation to the total interactions for the selected dates and media type, for the selected agent. Calculated by (Handle for wrap-up code / total interactions for the selected date and media type for the selected agent) |
| % Total Handle | The percentage of the total length of the interactions assigned the wrap-up code in relation to the total length of interactions for the selected dates and media type, for the selected agent. Calculated by (Total Handle for the wrap-up code / total length of interactions for the selected dates and media type, for the selected agent) |
| % Total Talk Time | The talk time for a wrap-up code in relation to the total talk time for the selected dates. Calculated by (Total Talk Time for a wrap-up code / Total Talk Time) |
|
ACW |
The number of times after-call work (ACW) was completed. After-call work is the work that an agent performs immediately following an interaction. Work may involve keying activity codes, updating customer databases, filling out forms, or initiating outbound contact. As a metric, it indicates the total time an agent takes to finish working on a call. If an agent must complete work before the agent can handle the next contact, then ACW is factored into the average handle time. Note: By default, the summary of metrics displayed includes all activity for the agent. To filter down to the activities specific to a queue, you can apply a filter. |
|
Max ACW |
The maximum amount of time spent on after call work for the selected interval. |
|
Min ACW |
The minimum amount of time spent on after call work for the selected interval. |
|
Max Handle |
The maximum amount of time agents were involved in ACD and non-ACD interactions, including answered interactions, transfers, callbacks, and outbound calls. |
|
Min Handle |
The minimum amount of time agents were involved in ACD and non-ACD interactions, including answered interactions, transfers, callbacks, and outbound calls. |
|
Talk |
The number of sessions where the user(s) interacted during conversations. A session includes the point where the agent joins the conversation to the point where they disconnect. |
|
Max Talk |
The maximum amount of time spent interacting for the selected interval. |
|
Min Talk |
The minimum amount of time spent interacting for the selected interval. |
|
Max Hold |
The maximum amount of time spent on hold for the selected interval. |
|
Min Hold |
The minimum amount of time spent on hold for the selected interval. |
Scheduled Callbacks view
| Column | Description |
|---|---|
| ANI | Telephone number of the person who made the original call. |
| Agent Owner | Agent assigned to a callback. |
| Callback Number | Telephone number to be dialed. |
| Campaign | Campaign associated with the callback. This field is blank if the callback is not associated with a campaign. |
| Campaign Division | Division names of the outbound campaigns associated with the callback. |
| Conversation ID | Alphanumeric identifier that can be used to locate this callback. |
| Conversation Start | Date and time stamp for the start of the original conversation. |
| Division |
Displays the name of a division that an agent or queue belongs to. For more information, see About access control. |
| Duration | Number of days since the start of the original conversation. |
| External Tag | Displays the external tag that is attached to the conversation record. Note: This data is not available for web chat interactions. |
| Languages | Languages set by the routing service for the callback. |
| Name | Name of the person to be called back. |
| Queue | Queue to place the call on. This field is blank if there is no queue, which can occur if the callback is associated with a campaign. |
| Queue Division |
Division names of the queues associated with the callback. |
| Scheduled Time | Date and time when the callback occurs. |
| Skills | Expertise required for handling this callback. |
Scheduled Exports view
| Column | Description |
|---|---|
| Auto disable in |
The number of days remaining to confirm the scheduled export before it is disabled. To ensure you are not running a scheduled export indefinitely, you must confirm a scheduled export every 100 days, or it will be disabled.
|
| Base | The Performance view from which the data is exported. |
| Destination | A list of email addresses to send the exported file to. |
| Enabled | Indicates if the export is scheduled to run. |
| Granularity | For interval-based exports, granularity designates how intervals are partitioned within the export. |
| Name | The name of the exported file. |
| Schedule | The recurrence to run the export such as the scheduled day of the week and time, day of the month and time, or day of the quarter and time. |
| Time Period | The interval of time for your export, such as today, past 30 days, last quarter, or year to date. |
| Time Zone | The time zone selected for the export. The time values within the export are based on this time zone. |
Skills Performance view
| Column | Description |
|---|---|
| Offer | The number of interactions routed into the queue for an agent to answer. Offered interactions are either answered, abandoned, or flow-out interactions. |
| Answer % | The percentage of offered interactions that an agent answered. Calculated by: (Answered / Offered) * 100 |
| Answered (in Answered % column) | A measurement of the number of assigned ACD interactions answered by an agent in a given period. Answered increments when the agent is the first to connect to the interaction. |
| Abandon % | The percentage of offered interactions in which the customer disconnected before connecting with an agent. The abandon rate can identify queues that require extra staff to handle interactions in a timely manner. Calculated by: (Abandoned Count / Offered Count) * 100 |
| Flow-Out | Flow-outs are interactions that enter and leave a queue without getting answered by an agent and without getting disconnected. Flow-outs are an indication of customer service level and queue productivity. High numbers of flow-outs can indicate staffing issues or ineffective agents when used with high handle times (bullseye matching metrics). Flow-outs can include transfers to voicemail, callbacks, and any system-driven events such as in-queue flows that transfer to another queue or external party after a certain amount of time. Flow-outs can also occur if the caller opts to exit out of the queue and return to the IVR. Offered interactions are either flow-out, answered, or abandoned interactions. |
| ASA | The average amount of time an interaction waits in the queue before an agent answers. This metric does not include interactions that agents do not answer. Average Speed of Answer (ASA) is directly associated with the service level and provides insight into the customer service your organization provides. ASA is recorded in the interval in which the agent answered the interaction. Calculated by: Total Answered (tAnswered Sum) / Answered Count (tAnswered Count) Note: Raw values are provided in milliseconds. |
| Service Level % | Service level target is a contact center performance statistic expressed as “X percent of conversations answered in Y seconds.” For example, a goal of answering 80% of voice calls within 20 seconds provides a service level target of 80/20. You can set the service level target for each media type in a queue. Analytics uses this service level target to calculate whether you are within the service level % defined by your service level agreement (SLA). For more information about setting the service level target, see Create queues or Edit or delete queues. Note: In the performance views that are not queue-specific, the Service Level % is calculated by queue and displayed as a – on the aggregated group row since SLA targets vary by queue. The affected views are DNIS Performance Summary and Skills Performance views. To view individual queue service level %, click the + to expand the row.
The service level % is the percentage of interactions that meet your contact center's service level target. The formula to calculate the service level % is:
Number of Conversations Answered within SLA The numerator is calculated by taking the total answered conversations and subtracting the conversations that were not answered within the SLA threshold. Calculated by: (Answered Count – SLA Violation Count) Total Number of Conversations The Service Level Options configuration determines the denominator. With all the options below unchecked, the denominator is the count of answered conversations.
As the service level calculation depends on an organization’s configured options, the final formula to calculate the service level is:
Notes:
|
| Handle | The total number of ACD and non-ACD interactions that agents were involved in for the selected media type. Handle increments in the interval in which the interaction ends, after the agent completes any after call work and completes the interaction. |
| Avg Handle |
The average amount of time agents spent handling interactions. This calculation includes talk time, hold time, and after-call work. For outbound calls it also includes dialing and contacting time. Calculated by: (cumulative talk time + cumulative hold time + cumulative after-call work + cumulative dialing time + cumulative contacting time) / Number of interactions handled Note: The interactions can span multiple time intervals. For example, a 45-minute call spans two 30-minute intervals. However, metrics are assigned a single timestamp and reported in the interval into which this timestamp falls. The timestamps are assigned based on when the metric calculation is complete.
For instance, handle time will use the timestamp of after call work completion. In the example of a 45-minute call, the handle time falls in the second 30-minute interval because the handle time was calculated at the end of the call when ACW was submitted. In these views, the Avg Talk, Avg Hold, and Avg ACW columns do not equal the Avg Handle column because only some interactions include holds. This view calculates average handle column using cumulative counts rather than averages. |
| Avg Talk | The average number of seconds spent interacting on a media type. Calculated by: Total Talk time / Count of interactions with Talk time |
| Avg Hold | The average number of seconds that interactions were placed on hold. Calculated by: Total Hold Time / Count of interactions with holds |
| Avg ACW | The average amount of time agents spent completing after-call work. Calculated by: Total ACW / Interactions with ACW |
| Total Handle | The total amount of time agents spend on an interaction including time spent contacting, time spent dialing, talk time, hold time, and after call work. |
| Total Talk | The total amount of time spent interacting on all the conversations by the agent, within an interval. For example, in an interaction, where an agent accepts an interaction, talks to the customer for two minutes, places the customer on hold for one minute, and then talks to the customer again for two minutes, the Total Talk equals 4 minutes. |
| Total Hold | The cumulative hold time for all interactions. |
| Total ACW | The cumulative time spent in after-call work (ACW) on all interactions. After-call work is the work that an agent performs immediately following an interaction. Work may involve keying activity codes, updating customer databases, filling out forms, or initiating outbound contact. As a metric, it indicates the total time an agent takes to finish working on a call. If an agent must complete work before the agent can handle the next contact, then ACW is factored into the average handle time. |
| Hold | The number of interactions with holds. |
| Transfer | A measurement of the number of interactions an agent answered in one queue and then transferred. A transfer counts for the queue in which an agent answers the interaction. This measurement is calculated by the number of interactions blind transferred or consult transferred. |
| Transfer % | The number of transfers compared with the total number of interactions answered. Calculated by: (No. of transfers / interactions answered) * 100 |
| Max Abandon | The maximum time of an abandoned interaction for the selected interval. |
| Min Abandon | The minimum time of an abandoned interaction for the selected interval. |
| Avg Wait | The average amount of time an interaction is in a queue before an agent answers it, before the interaction moves out of the queue, or before the customer abandons the interaction. Calculated by: Total Wait Time / Interactions |
| Max Wait | The maximum amount of time spent waiting in queue for the selected interval. |
| Min Wait | The minimum amount of time spent waiting in queue for the selected interval. |
| Max Talk | The maximum amount of time spent interacting for the selected interval. |
| Min Talk | The minimum amount of time spent interacting for the selected interval. |
| Max Hold | The maximum amount of time spent on hold for the selected interval. |
| Min Hold | The minimum amount of time spent on hold for the selected interval. |
| Max ACW | The maximum amount of time spent on after call work for the selected interval. |
| Min ACW | The minimum amount of time spent on after call work for the selected interval. |
| Over SLA | Number of interactions that were over the defined Service Level. |
| Met SLA | Number of interactions that met the defined service level. |
| Short Abandon | Number of interactions that were short abandoned. |
| Short Abandon % | Percent of interactions that were short abandoned. |
| Abandon – No Short | Number of abandons excluding the short abandons. |
| Abandon – No Short % | Percent of abandons excluding the short abandons. |
| Outbound Attempt | Attempted outbound interactions for Dialer campaigns. |
| Voicemail | Count of voicemails received. |
|
Abandon |
The number of times an end user abandoned an interaction in a queue. For example, the customer hangs up before an agent answers, or the system disconnects the interaction. |
|
ACW |
The number of times after-call work (ACW) was completed. After-call work is the work that an agent performs immediately following an interaction. Work may involve keying activity codes, updating customer databases, filling out forms, or initiating outbound contact. As a metric, it indicates the total time an agent takes to finish working on a call. If an agent must complete work before the agent can handle the next contact, then ACW is factored into the average handle time. Note: By default, the summary of metrics displayed includes all activity for the agent. To filter down to the activities specific to a queue, you can apply a filter. |
|
Max Handle |
The maximum amount of time agents were involved in ACD and non-ACD interactions, including answered interactions, transfers, callbacks, and outbound calls. |
|
Min Handle |
The minimum amount of time agents were involved in ACD and non-ACD interactions, including answered interactions, transfers, callbacks, and outbound calls. |
|
Talk |
The number of sessions where the user(s) interacted during conversations. A session includes the point where the agent joins the conversation to the point where they disconnect. |
|
Total Abandon |
The total amount of time interactions are in queue waiting for an agent to answer them before customers abandoned the interactions. |
|
Wait |
The number of interactions that waited in the queue. |
|
Avg Flow-Out |
The average amount of time an interaction spends in queue before it flows out. Calculated by: Total Flow Out Time / Count of interactions with flow-outs For more information, see Queues Performance Summary view. |
|
Max Flow-Out |
The maximum amount of time an interaction spends in queue before it flows out. For more information, see Queues Performance Summary view. |
|
Total Active Callback |
The time an agent spent on a callback while a call is active. |
|
Min Active Callback |
The minimum time an agent spent on a callback while a call is active. |
|
Max Active Callback |
The maximum time an agent spent on a callback while a call is active. |
|
Avg Active Callback |
The average time an agent spent on a callback while a call is active. |
|
Active Callback |
The instances of an agent on a callback while a call is active. |
|
Min Flow-Out |
The minimum amount of time an interaction spends in queue before it flows out. For more information, see Queues Performance Summary view. |
Survey Performance Summary view
| Column | Column Description |
|---|---|
| Column | Column Description |
| Name | The name of the survey form. |
| Response Rate | The number of surveys that customers complete compared with the total number of surveys sent. Surveys sent includes successfully delivered survey invitations and survey invitations that Genesys Cloud attempted to send but could not deliver due to an error, such as an invalid email address or invalid survey form. Calculated by: (Surveys Completed / Surveys Sent) * 100 |
| Sent | The number of surveys sent. This metric includes successfully delivered survey invitations and survey invitations that Genesys Cloud attempted to send but could not deliver due to an error, such as an invalid email address or invalid survey form. |
| In Progress | The number of surveys that customers opened but did not submit. This metric does not include surveys that customers opened but did not submit before the survey expired. |
| Complete | The number of surveys customers have opened and submitted. |
| Abandon | The number of surveys that customers opened but did not submit before the survey expired. |
| Expire | The number of surveys that expired before the customer opened it. |
| Errors | The number of surveys that Genesys Cloud attempted but failed due to an error. The error includes errors in delivery such as an invalid email address, errors that occurred during the Survey Invite Flow, or other errors in the survey creation. |
| Bounce | The number of times a survey was sent out and returned by the recipient's email server, usually caused by an invalid email address. |
| Score |
The average of completed surveys' percentage scores. The average score does not include NPS. Calculated by (Sum of completed survey percentage scores / number of completed surveys) * 100 Beside the score average, this column also displays the lowest percentage score in red and the highest percentage score in green. |
| NPS |
The Net Promoter ScoreSM (NPS) of completed surveys. The score can range from -100 to 100. Calculated by (Promoters - Detractors) / number of responses) * 100 For more information about Promoters, Detractors, and NPS, see Net Promoter Score web survey question overview. Beside the NPS, this column also displays the number of responses for each group of customer ratings: Detractors (red): customer rating of 0-6 Passives (yellow): customer rating of 7-8 Promoters (green): customer rating of 9-10
|
| Complaint |
The number of errors related to email recipient, system blocking, or identifying the survey sender as spam. |
| Full response |
The number of full survey responses with all required questions that were answered by the customers. |
| Partial Response |
The number of partial survey responses with any required questions that were unanswered by the customers. |
| Voice Survey |
The number of voice surveys. |
| Web Survey |
The number of web surveys. |
| Outstanding |
The number of outstanding surveys. Calculated by (Number of surveys sent) – completed – expired – abandoned – bounced – complaints |
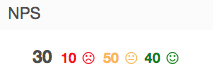
Surveys Performance Detail view
| Column | Column Description |
|---|---|
| Questions | The name of the question group or, when expanded, the question text. Hover over the portion of a question to see the full question text. |
| Responses | The number of responses for each question group or question. |
| Score |
The average score for a question group or question based on the number of points the survey form creator assigned to it. The average for question groups does not include NPS question responses. Calculated by (Sum of all responses for the question / Total number of responses to the question) Besides the score average, this column also displays the lowest score in red and the highest score in green. Note: This column displays no score if the question has no responses or the question type is read only, free text, or NPS. |
| Conditional |
Whether the survey form creator set the question group or question as conditional. Conditional question groups and questions appear to the customer based on their previous answer choice. |
Topic Trends Detail view
| Column | Description |
|---|---|
| Column | Description |
| Interval | The interval start date or time. |
| Interactions | The number of communications for the topic and interval. |
| Total Interactions Analyzed | The total communications for all topics. |
| Positive Interactions | The number of interactions during which the average sentiment is >= +20. |
| Neutral Interactions | The number of interactions during which the average sentiment is >= -20 and < +20. |
| Negative Interactions | The number of interactions during which the average sentiment is < -20. |
| Positive Interactions % | The percent of all interactions that have an overall positive sentiment score (>= +20). |
| Neutral Interactions % | The percent of all interactions that have an overall neutral sentiment score (>= -20 and < +20). |
| Negative Interactions % | The percent of all interactions that have an overall negative sentiment score (< -20). |
| Avg Agent Talk | The average agent talk time. |
| Avg Agent Talk % | The average agent talk time as a percentage of interactions. |
| Avg Customer Talk | The average customer talk time. |
| Avg Customer Talk % | The average customer talking time as a percentage of interactions. |
| Avg Hold/Music | The average of hold time and music time across interactions. |
| Avg Hold/Music % | The average hold and music time as a percentage of interactions. |
| Avg Overtalk | The average overtalk time across interactions, where both the agent and customer talk at the same time. |
| Avg Overtalk % | The average overtalk time as a percentage of interactions, where both the agent and customer talk at the same time. |
| Avg Silence | The average silent time across interactions. |
| Avg Silence % | The average silent time as a percentage of interactions. |
| Avg Talk and Silence | The average of both the talking time and silent time. |
| Overtalk Instances | The number of instances of overtalk time, where both the agent and customer talk at the same time. |
| Average Sentiment Score | The average sentiment score of interactions. |
Topic Trends Summary view
| Column | Description |
|---|---|
| Column | Description |
| Name | The name of the topics. |
| Legend | The colors used in the chart. |
| Interactions | The number of communications for the topic. |
| Interactions % | The percentage of communications for this topic out of all communications across all topics. |
| Dialect | The language associated with the interaction. |
| Participant | The type of participant, whether Internal, External, or All. |
| Sentiment | Shows the spread of sentiment for the topics shown. |
| Positive Interactions | The number of interactions during which the average sentiment is >= +20. |
| Neutral Interactions | The number of interactions during which the average sentiment is >= -20 and < +20. |
| Negative Interactions | The number of interactions during which the average sentiment is < -20. |
| Positive Interactions % | The percent of all interactions that have an overall positive sentiment score (>= +20). |
| Neutral Interactions % | The percent of all interactions that have an overall neutral sentiment score (>= -20 and < +20). |
| Negative Interactions % | The percent of all interactions that have an overall negative sentiment score (< -20). |
| Avg Agent Talk | The average agent talk time. |
| Avg Agent Talk % | The average agent talk time as a percentage of interactions. |
| Avg Customer Talk | The average customer talk time. |
| Avg Customer Talk % | The average customer talking time as a percentage of interactions. |
| Avg Hold/Music | The average of hold time and music time across interactions. |
| Avg Hold/Music % | The average hold and music time as a percentage of interactions. |
| Avg Overtalk | The average overtalk time across interactions, where both the agent and customer talk at the same time. |
| Avg Overtalk % | The average overtalk time as a percentage of interactions, where both the agent and customer talk at the same time. |
| Avg Silence | The average silent time across interactions. |
| Avg Silence % | The average silent time as a percentage of interactions. |
| Avg Talk and Silence | The average of both the talking time and silent time. |
| Overtalk Instances | The number of instances of overtalk time, where both the agent and customer talk at the same time. |
| Average Sentiment Score | The average sentiment score of interactions. |
Workitem Performance view
| Column | Description |
|---|---|
| Column | Description |
| Avg Duration |
The average amount of time that a workitem has spent in a specific status. Note: The avg duration is calculated only after the workitem has transitioned to another state or the workitem is terminated.
|
| Created | Number of workitems created. |
| Deleted | Number of workitems deleted. |
| Met SLA |
The total number of workitems terminated on a date that matches the date filter criteria and also before the due date. |
| Over SLA |
The total number of workitems terminated on a date that matches the date filter criteria and also after the due date. |
| Purged | Number of workitems purged. |
| Service Level % |
The service level % is the percentage of workitems that met SLA and the total number of workitems terminated during the date criteria. The formula to calculate the service level % is:
For example, if the total number of workitems terminated at the specified date is 125 and the total number of Over SLA is 15.
|
| Status | The current status of the workitem defined by the custom status transitions of the worktype. |
| Status Category |
The status category of the workitem. The predefined status categories are Open, In Progress, On Hold, and Closed. |
| Terminated |
The number of workitems terminated. |
| Transitions | The count of workitems that have transitioned into another status or out of the status or status category listed. |
| Workbin | Name of the workbin. |
| Worktype | Name of the worktype. |


For real-time examples and more advanced Workitems metric definitions, see Genesys Cloud Developer Center.
Wrap-Up Performance Summary view
| Column | Description |
|---|---|
| Handle | The total number of ACD and non-ACD interactions that agents were involved in for the selected media type. Handle increments in the interval in which the interaction ends, after the agent completes any after call work and completes the interaction. |
| % Handle | The percentage of interactions assigned the wrap-up code in relation to the total interactions for the selected dates and media type. Calculated by (Handle for the wrap-up code / total interactions for the selected date and media type) |
| Avg Handle |
The average amount of time agents spent handling interactions. This calculation includes talk time, hold time, and after-call work. For outbound calls it also includes dialing and contacting time. Calculated by: (cumulative talk time + cumulative hold time + cumulative after-call work + cumulative dialing time + cumulative contacting time) / Number of interactions handled Note: The interactions can span multiple time intervals. For example, a 45-minute call spans two 30-minute intervals. However, metrics are assigned a single timestamp and reported in the interval into which this timestamp falls. The timestamps are assigned based on when the metric calculation is complete.
For instance, handle time will use the timestamp of after call work completion. In the example of a 45-minute call, the handle time falls in the second 30-minute interval because the handle time was calculated at the end of the call when ACW was submitted. In these views, the Avg Talk, Avg Hold, and Avg ACW columns do not equal the Avg Handle column because only some interactions include holds. This view calculates average handle column using cumulative counts rather than averages. |
| Avg Talk | The average number of seconds spent interacting on a media type. Calculated by: Total Talk time / Count of interactions with Talk time |
| Avg Hold | The average number of seconds that interactions were placed on hold. Calculated by: Total Hold Time / Count of interactions with holds |
| Avg ACW | The average amount of time agents spent completing after-call work. Calculated by: Total ACW / Interactions with ACW |
| Total Handle | The total amount of time agents spend on an interaction including time spent contacting, time spent dialing, talk time, hold time, and after call work. |
| Total Talk | The total amount of time spent interacting on all the conversations by the agent, within an interval. For example, in an interaction, where an agent accepts an interaction, talks to the customer for two minutes, places the customer on hold for one minute, and then talks to the customer again for two minutes, the Total Talk equals 4 minutes. |
| Total Hold | The cumulative hold time for all interactions. |
| Total ACW | The cumulative time spent in after-call work (ACW) on all interactions. After-call work is the work that an agent performs immediately following an interaction. Work may involve keying activity codes, updating customer databases, filling out forms, or initiating outbound contact. As a metric, it indicates the total time an agent takes to finish working on a call. If an agent must complete work before the agent can handle the next contact, then ACW is factored into the average handle time. |
| Hold | The number of interactions with holds. |
| % Total Handle | The percentage of the total length of the interactions assigned the wrap-up code in relation to the total length of interactions for the selected dates and media type. Calculated by (Total Handle for the wrap-up code / total length of interactions for the selected dates and media type) |
| % Total Talk Time | The talk time for a wrap-up code in relation to the total talk time for the selected dates. Calculated by (Total Talk Time for a wrap-up code / Total Talk Time) |
|
ACW |
The number of times after-call work (ACW) was completed. After-call work is the work that an agent performs immediately following an interaction. Work may involve keying activity codes, updating customer databases, filling out forms, or initiating outbound contact. As a metric, it indicates the total time an agent takes to finish working on a call. If an agent must complete work before the agent can handle the next contact, then ACW is factored into the average handle time. Note: By default, the summary of metrics displayed includes all activity for the agent. To filter down to the activities specific to a queue, you can apply a filter. |
|
Max ACW |
The maximum amount of time spent on after call work for the selected interval. |
|
Min ACW |
The minimum amount of time spent on after call work for the selected interval. |
|
Max Handle |
The maximum amount of time agents were involved in ACD and non-ACD interactions, including answered interactions, transfers, callbacks, and outbound calls. |
|
Min Handle |
The minimum amount of time agents were involved in ACD and non-ACD interactions, including answered interactions, transfers, callbacks, and outbound calls. |
|
Talk |
The number of sessions where the user(s) interacted during conversations. A session includes the point where the agent joins the conversation to the point where they disconnect. |
|
Max Talk |
The maximum amount of time spent interacting for the selected interval. |
|
Min Talk |
The minimum amount of time spent interacting for the selected interval. |
|
Max Hold |
The maximum amount of time spent on hold for the selected interval. |
|
Min Hold |
The minimum amount of time spent on hold for the selected interval. |