
Agents Schedule Detail view
View an agent’s schedule for the dates selected. For more information about schedules, see About workforce management.
Note: You can also access your schedule from Activity > Schedule tab. For more information, see Agent activity overview.
Set a default time zone in the workspace
You can set the default time zone in the analytics workspace before viewing any analytics view.
To set the default time zone in the workspace, follow these steps:
- Click Performance > Workspace.
- On the left side, from the Time zone drop-down menu, select the required time zone as the default time zone for the analytics workspace.
To view the agent details tabs, perform the following steps:
- Click Performance > Workspace.
- From the Agents Performance Summary view, click an agent.
- From the Agents Performance Detail view, click the Schedule tab.
- Hover over the schedule for more information about it. The view highlights the current day in a contrasting background and indicates the current time with a horizontal bar.
- To see different dates in a week, use the Week selector. Use the left triangle and right triangle to select a date range.
- Click the Gear icon to view timezone selector and select the required timezone.
- To see the most current data, click Refresh .
- Click the tabs to open to the agent’s Performance, Statuses, Evaluations, Interactions, Schedule, Scorecard, and Development detail views.
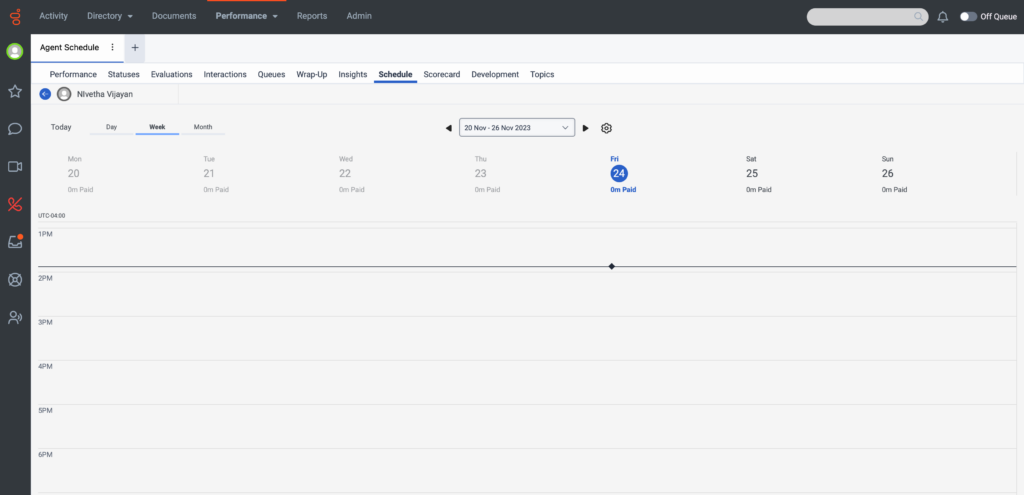
Note: The Today tab focuses on the current day, week, or month view to show today’s date. The Day tab enables you to view a single day’s schedule and expands the initial week or month view to give more details for a specific day.
View your schedule
To access your schedule from the Agent Activity tab, perform the following steps:
- Click the Activity > Schedule tab.
- To see the most current data, click Refresh . This view does not update automatically.
To access your schedule from the Agent Dashboard, perform the following steps:
- Click Performance > Workspace > My Performance.
- Click the Schedule tab.
- To see the most current data, click Refresh . This view does not update automatically.
Access your schedule
You can access your schedule either from the Agent Activity tab or from the Agent Dashboard.
- To view your schedule, do the following:
- For today’s schedule, click the Today tab.
- For a daily schedule, click the Day tab.
- For a weekly schedule, click the Week tab.
- For a monthly schedule, click the Month tab.
- Hover over the schedule for more information about it. The view highlights the current day in a contrasting background and indicates the current time with a horizontal bar. If you are out of adherence, the system displays a message at the top of your schedule and outlines the conflicting activity in red. For more information, see View out of adherence notifications.
- To see different dates, use the left triangle and right triangle and select the date range.
- To see different time zone in the Workspace view, use the Gear icon and select the required time zone. You cannot change the time zones in the Activity view.