
Queues Performance Summary view
The following permissions:
- Analytics > Conversation Aggregate > View
- Analytics > Data Export > All
- Analytics > Speech and Text Analytics Aggregates > View
- Directory > User > View
- Routing > Queue > View
- UI > Supervisor Queue Details > View
- Groups > Team > View (to filter agent list by Work Team)
To see survey columns and data:
- Analytics > Survey Aggregate > View
- Quality > Survey Form > View
To see current and past metrics and data for queues, click Performance > Workspace > Contact Center > Queue Performance. Customize the view with filters and column controls.
Set a default time zone in the workspace
You can set the default time zone in the analytics workspace before viewing any analytics view.
To set the default time zone in the workspace, follow these steps:
- Click Performance > Workspace.
- On the left side, from the Time zone drop-down menu, select the required time zone as the default time zone for the analytics workspace.
For more information about a specific queue, click the queue’s name to see its Queues Performance Detail view.
To view aggregate data about a group of selected queues, filter for and select multiple queues and click View as group. Genesys Cloud displays the Queues Performance Detail view with aggregate data for the queues that you selected.
To export the data in the view, click Export .
To save the view with your filter and column settings, click Save .
This view updates automatically except when you use filters from the Filters pane. To see the most current data, click Refresh .
Note: The Offer, Answer %, Abandon %, ASA, Service Level, and Avg Wait columns show metrics for inbound interactions handled in a queue. All other columns show metrics for both inbound and outbound interactions that a queue handled.
Customize the view
To show only certain data, customize the queues performance summary view. For example, you can choose to show only certain columns or filter to see certain types of interactions. If you return to the Queue Summary Detail view, then your filters and column changes remain. You can also save your filter and column settings as a saved view to switch quickly between different data of interest in the same view.
Filter by queues to populate the summary row with aggregate data about those queues.
To customize analytics views, use the date filter.
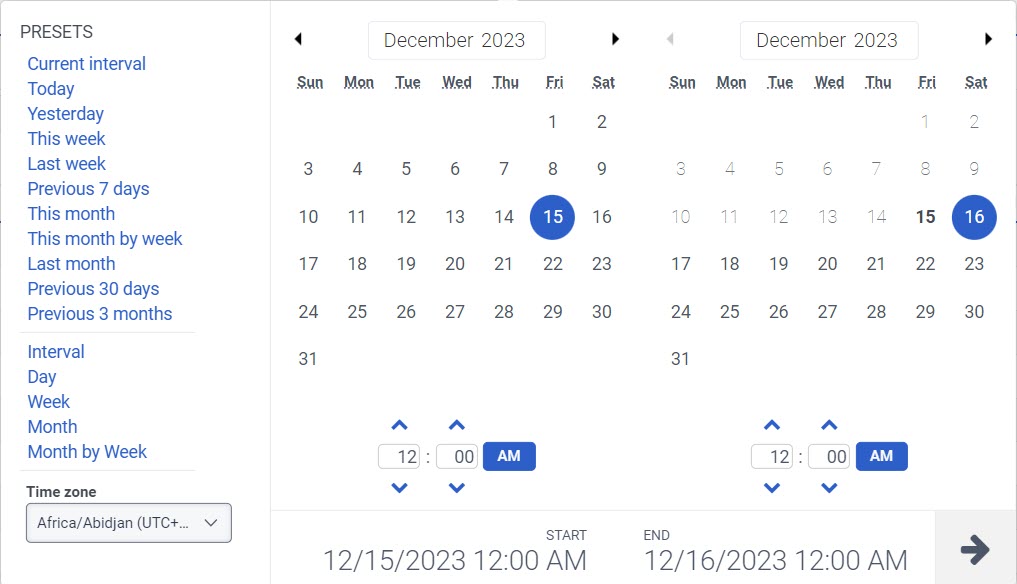
To filter metrics by date or configure a custom date range, use presets. When filtering metrics for this view, select any custom date range up to 6 weeks.
To use a preset to filter metrics, complete the following steps:
- To display the date filter, click the date.
- In the Presets list, select a preset date option.
Date presets
| Presets | Description |
|---|---|
| Current interval | Shows data for the current 30-minute time period. |
| Today | Shows data for the time period that includes the current interval. |
| Yesterday | Shows data for the previous day. |
| This week | Shows data for a Sunday through Saturday time period. |
| Last week | Shows data for the previous week, Sunday through Saturday. |
| Previous 7 days | Shows data for the previous seven days. |
| This month | Shows data for the current month, with no extra days. |
| This month by week | Shows data for the current calendar month starting on Sunday and ending on Saturday, including extra days if the month does not start on Sunday or end on Saturday. |
| Last month | Shows data for the previous calendar month with no extra days. |
| Previous 30 days | Shows data for the previous 30 days. |
| Previous 3 months | Shows data for the previous 3 months. For example, Nov 1, 2022 – Jan 31, 2023. |
| Interval | Shows data for a 30-minute time period. |
| Day | Shows data for a single 24-hour day. |
| Week | Shows data for a Sunday through Saturday time period. |
| Month | Shows data for the exact month with no extra days. If the current month is selected, you can see the data up to the current date. |
| Month by Week | Shows data for a calendar month starting on Sunday and ending on Saturday, including extra days if the month does not start on Sunday or end on Saturday. |
To use a custom date range to filter metrics, complete the following steps:
- Click the date to display the date filter.
- Select a start date and an end date on the calendar, and click the filter arrow .
To view data for a different time period using the same date presets, click the arrows on either side of the date display. ![]()
For example, to view data for the previous day, click the Day preset, and then click the arrow on the left side of the date.
To view data for a different time zone using the same date presets, from the Time zone drop-down menu, select the required time zone. You can create and save reports with the same selected time zone.
- To filter by media type, click the Filter icon
 .
. - Select the media type.
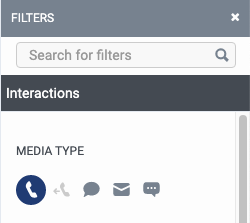
- When filtering you can select more than one media type. Click the relevant media type to select or deselect the type.
- You cannot select the voice and callback types at the same time.
- If you select voice, the callback option will be deselected, and if you select callback, the voice interaction will be deselected.
The selected media type icon is displayed above the column headers.
Data in the view can be displayed in a chart. To view the chart, click the Show/Hide chart icon .
To show or hide topic columns, click the Pick columns icon on the right side and then search or scroll to select the columns you want to view.
To rearrange topic columns, click a column header and drag it.
To reset a view to default column settings, click Reset view to defaults ![]() .
.
You can select up to 20 topic columns.
For more information about the metrics shown in the columns, see the Available Columns section in this article.
To enter names of queues you want to view, click the Filter queue(s) search icon . Enter the name of the queue and select the queue from the search results. You can continue to enter and select additional queues to add to the view.
Filter by selecting multiple queues
You can select multiple queues to filter by.
- In the queue's row, select the check box.
- Continue selecting queue check boxes to add to filters.
- Click Add to filters.
To use the summary row above the queue rows to see aggregate metrics for multiple queues, search for and select multiple queues. The summary row then shows aggregate metrics for the selected queues.
View aggregate data
To view aggregate data about a group of selected queues, filter for multiple queues and click View as group. Genesys Cloud displays the Queues Performance Detail view with aggregate data for the queues that you selected.
To filter by information about the interaction, click Filters , and then search or scroll to select the filter you want to use.
Some metrics are not relevant for all filters. For example, the "offer" metric only applies to queues, not users. If you filter by a user, then the offer column does not include data.
Interactions filters
| Filter | Description |
|---|---|
| Skills |
Displays metrics for interactions with agents who have the selected skills. Filter for multiple skills at one time by entering other skills and searching again. |
| Languages |
Displays metrics for interactions with agents who have the selected languages. Filter for multiple languages at one time by entering other languages and searching again. |
| Direction | Displays information about interactions of the selected directions. |
| Initial Direction | Displays information about interactions with the selected initial direction. |
| DNIS | Displays information for interactions with the selected DNIS numbers.
|
| Session DNIS | Displays information for interactions with the selected DNIS number. The DNIS number could have been dialed any time during the interaction.
|
| To | Displays information for interactions sent to the selected email addresses.
|
| User |
Displays information associated with the selected users. Filter for multiple users at one time by entering other users and searching again. To see and select inactive users in the User filter search, select Include inactive users. To see and select deleted users in the User filter search, select Include deleted users. |
| Wrap-up |
Displays information for interactions that have the selected wrap-up codes. Filter for multiple wrap-up codes at one time by entering other wrap-up codes and searching again. |
| Message Type |
Displays metrics for interactions of the selected ACD message type. This filter only appears if you set the media type filter to Message. If you do not have any message types selected, the view displays information for all message types. Genesys Cloud currently supports the following message types: Facebook, Line, Open, SMS, Twitter, Web Messaging, and WhatsApp. |
| Has Media | Only shows interactions that have multimedia content. This filter only appears if you set the media type filter to Message. |
| Provider | The source provider for the conversation. For example, Genesys Cloud EMAIL, Edge, and so on. |
| Routing Used | Displays the routing method that was used to get to the agent who answered the interaction. The routing data is relevant beginning September 5, 2020. |
| Routing Requested | Displays the routing methods that were requested for the interaction. Gives insight into each of the routing methods the conversation went through prior to being answered, abandoned, or flow-out. The routing data is relevant beginning September 5, 2020. |
| Agent Assist |
Yes displays data for interactions that had Agent Assist. No displays data for interactions that did not have Agent Assist. |
| Work Team | Displays metrics for interactions associated with the selected work team. Filter for multiple work teams at one time by entering other work teams and searching again. For more information, see Work teams overview. |
| First Queue | Displays data for the first queue of an interaction. Select the First Queue check box to retrieve queue statistics for only the first queue that the interaction occurred on. |
| External Tag | Displays information for interactions that have the External Tag attached to the conversation record. Note: External tag data is not available for web chat interactions. |
Notes:
- Real-time updates stop while any filters in the Filters pane are active.
- The skills and languages filters use agents’ ACD skills or languages, not the skills or languages listed in their profiles. To add an ACD skill or language to an agent, see Manage ACD skills.
- When you apply skill or language filters, the view shows the SLA. However, if the SLA is below the target, the view does not show SLA targets and the color does not change.
To filter by information about the outbound details of the interaction:
- Click Filters .
- Click the Outbound tab.
- Search or scroll to select the filter you want to use.
Outbound filters
| Filter | Description |
|---|---|
| Contact ID |
Unique system ID for the user. |
| Contact List |
Displays metrics for interactions associated with the selected contact lists. Filter for multiple contact lists at one time by entering other contact list names and searching again. |
To filter by information about the Predictive Engagement journey details of the interaction:
- Click Filter .
- Click the Journey tab.
Journey filters
| Filter | Description |
|---|---|
| Has Customer Journey Data | Displays data for interactions that have customer journey data related to Predictive Engagement. |
| Proactive | Displays data for interactions where Predictive Engagement offered a chat during a customer's website visit based on the Predictive Engagement action map settings. |
To filter by information about External Contact details of the interaction:
- Click Filter .
- Click the External Contact tab.
External Contact filters
| Filter | Description |
|---|---|
| External Contact | Displays information about interactions associated with the selected external contact. You can filter for:
When you filter by external contact, the contact name appears with the associated organization name. Filter for multiple external contacts at one time by entering another contact and searching again. Enable Include merged contacts to search all the contacts that relate to the external contacts in the filter. Note: You can associate each merged contact with many individual contact IDs. When you enable the Include merged contacts, all merged contact IDs are automatically added to the search. The search filters are limited to 200 total search dimensions.
For example, if you merge one contact into five other contacts, the search, performed along with the merged contacts, filters a total of six contacts. If an organization heavily uses the merged contacts, a search for a few external contacts can hit the search filter limit. |
| External Organization | Displays information about interactions associated with the selected external organization. You can filter for:
Filter for multiple external organizations at one time by entering another organization and searching again. |
Available columns
Your customizations determine the metric columns that the view shows.
Performance
| Column | Description |
|---|---|
| Column | Column Description |
| Queues | The name of the queue. |
| Offer | The number of interactions routed into the queue for an agent to answer. Offered interactions are either answered, abandoned, or flow-out interactions. |
| Answer % | The percentage of offered interactions that an agent answered. Calculated by: (Answered / Offered) * 100 |
| Answer (in Answer % column) | A measurement of the number of assigned ACD interactions answered by an agent in a given period. Answered increments when the agent is the first to connect to the interaction. |
| Abandon % | The percentage of offered interactions in which the customer disconnected before connecting with an agent. The abandon rate can identify queues that require extra staff to handle interactions in a timely manner. Calculated by: (Abandoned Count / Offered Count) * 100 |
| Abandon (in Abandon % column) | The number of times an end user abandoned an interaction in a queue. For example, the customer hangs up before an agent answers, or the system disconnects the interaction. |
| Outbound | This metric represents the number of outbound interactions placed on behalf of queue. |
| Flow-Out | Flow-outs are interactions that enter and leave a queue without getting answered by an agent and without getting disconnected. Flow-outs are an indication of customer service level and queue productivity. High numbers of flow-outs can indicate staffing issues or ineffective agents when used with high handle times (bullseye matching metrics). Flow-outs can include transfers to voicemail, callbacks, and any system-driven events such as in-queue flows that transfer to another queue or external party after a certain amount of time. Flow-outs can also occur if the caller opts to exit out of the queue and return to the IVR. Offered interactions are either flow-out, answered, or abandoned interactions. |
| ASA | The average amount of time an interaction waits in queue before an agent answers it. This metric does not include interactions that agents do not answer. ASA is directly associated with the service level and provides insight into the customer service your company provides. ASA is recorded in the interval in which the agent answered the interaction. Calculated by: Total Answered (tAnswered Sum) / Answered Count (tAnswered Count) Note: Raw values are provided in milliseconds. |
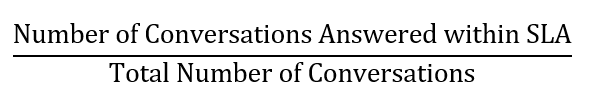
| Service Level % |
Service level target is a contact center performance statistic expressed as “X percent of conversations answered in Y seconds.” For example, a goal of answering 80% of voice calls within 20 seconds provides a service level target of 80/20. You can set the service level target for each media type in a queue. Analytics uses this service level target to calculate whether you are within the service level % defined by your service level agreement (SLA). For more information about setting the service level target, see Create queues or Edit or delete queues. Note: In the skill group row, the Service Level target displays a -. To view individual queue service level target values for each queue, click the + to expand the row.
The service level % is the percentage of interactions that meet your contact center's service level target. The formula to calculate the service level % is:
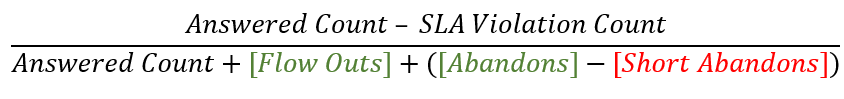
Number of Conversations Answered within SLA The numerator is calculated by taking the total answered conversations and subtracting the conversations that were not answered within the SLA threshold. Calculated by: (Answered Count – SLA Violation Count) Total Number of Conversations The Service Level Options configuration determines the denominator. With all the options below unchecked, the denominator is the count of answered conversations.
As the service level calculation depends on an organization’s configured options, the final formula to calculate the service level is:
Note: With the Flowouts and Abandons enabled, the Flowouts and the Abandons are added into the denominator when calculating the service level. With the Short Abandons disabled, the Short Abandons are subtracted from the Abandons when calculating the service level.
In this view, the service level set for the queue appears as a gray number beside the service level percentage for the interval. If the service level percentage for the interval is lower than the set service level, then the service level percentage is red. |
| Avg Wait | The average amount of time an interaction is in a queue before an agent answers it, it flows out, or the customer abandons it. Calculated by: Total Wait Time / Interactions |
| Handle | The total number of ACD and non-ACD interactions that agents were involved in for the selected media type. Handle increments in the interval in which the interaction ends, after the agent completes any after call work and completes the interaction. |
| Avg Handle |
The average amount of time agents spent handling interactions. This calculation includes talk time, hold time, and after-call work. For outbound calls it also includes dialing and contacting time. Calculated by: (cumulative talk time + cumulative hold time + cumulative after-call work + cumulative dialing time + cumulative contacting time) / Number of interactions handled Note: The interactions can span multiple time intervals. For example, a 45-minute call spans two 30-minute intervals. However, metrics are assigned a single timestamp and reported in the interval into which this timestamp falls. The timestamps are assigned based on when the metric calculation is complete.
For instance, handle time will use the timestamp of after call work completion. In the example of a 45-minute call, the handle time falls in the second 30-minute interval because the handle time was calculated at the end of the call when ACW was submitted. In these views, the Avg Talk, Avg Hold, and Avg ACW columns do not equal the Avg Handle column because only some interactions include holds. This view calculates the average handle column using cumulative counts rather than averages. |
| Avg Talk | The average number of seconds spent interacting on a media type. Calculated by: Total Talk time / Count of interactions with Talk time |
| Avg Hold | The average number of seconds that interactions were placed on hold. Calculated by: Total Hold Time / Count of interactions with holds |
| Avg ACW | The average amount of time agents spent completing after-call work. Calculated by: Total ACW / Interactions with ACW |
| Avg Dialing | The average amount of time an agent spends dialing and waiting for a contact to answer during outbound interactions.
Calculated by: (total dialing time/ total number of dialing segments) |
| Avg Contacting | The average amount of time an outbound interaction takes to connecting to the agent’s phone. Usually, this duration is short. However, if the agent uses a remote phone the duration may be longer. |
| Total Handle |
The total amount of time agents spend on an interaction including time spent contacting, time spent dialing, talk time, hold time, and after call work. Sometimes, as after-call work overlaps with the talk time or the hold time, this sum of the cumulative metrics represented in Total Handle is not the same as the Handle metric, which eliminates any overlap. |
| Total Talk | The total amount of time spent interacting on all the conversations by the agent, within an interval. For example, in an interaction, where an agent accepts an interaction, talks to the customer for two minutes, places the customer on hold for one minute, and then talks to the customer again for two minutes, the Total Talk equals 4 minutes. |
| Total Hold | The cumulative hold time for all interactions. |
| Total ACW | The cumulative time spent in after-call work (ACW) on all interactions. After-call work is the work that an agent performs immediately following an interaction. Work may involve keying activity codes, updating customer databases, filling out forms, or initiating outbound contact. As a metric, it indicates the total time an agent takes to finish working on a call. If an agent must complete work before the agent can handle the next contact, then ACW is factored into the average handle time. |
| Total Dialing | The total amount of time an outbound interaction spends dialing a contact. |
| Total Contacting | The total amount of time outbound interactions take to connect to the agent’s phone. Usually, this duration is short. However, if the agent uses a remote phone the duration may be longer. |
| Hold | The number of interactions with holds. |
| Transfer | A measurement of the number of interactions an agent answered in one queue and then transferred. A transfer counts for the queue in which an agent answers the interaction. This measurement is calculated by the number of interactions blind transferred or consult transferred. |
| Blind Transfer | The number of interactions an agent answered in one queue and then blind transferred. A blind transfer counts for the queue in which an agent answers the interaction. |
| Consult | The number of interactions an agent answered and then consulted with another participant with or without fully transferring the interaction. A consult counts for the queue in which an agent answers the interaction, even if they consult with another queue. |
| Consult Transfer | The number of call interactions an agent answered in one queue and then consult transferred, meaning they connected with a person or queue before transferring the call. A consult transfer counts for the queue in which an agent answers the interaction. See Consult transfer a call. |
| Avg Abandon | The average amount of time before a customer disconnects in an ACD queue before connecting with an agent. For example, the customer hangs up before an agent answers, or the system disconnects the interaction. |
| Time to Abandon |
The average amount of time before a customer disconnects in an ACD queue before connecting with an agent. For example, the customer hangs up before an agent answers, or the system disconnects the interaction. Note: This metric column is only available in the exported data for this view. It contains the same data as the Avg Abandon column. |
| Total Wait | The total amount of time an interaction is in a queue before an agent answers it, it flows out, or the customer abandons it. Genesys Cloud calculates the wait time in milliseconds. |
| Total Abandon | The total amount of time interactions are in queue waiting for an agent to answer them before customers abandoned the interactions. |
| Connection | The number of interactions that initially connected to the contact center in a particular location, such as a queue or IVR. |
| Division | Displays the name of a division that an agent or queue belongs to. For more information, see About access control. |
| Inbound Media | The count of inbound media for an interaction. |
| Transfer % | The number of transfers compared to the total number of interactions answered. Calculated by: (# of transfers / interactions answered) * 100 |
| Max Abandon | The maximum time of an abandoned interaction for the selected interval. |
| Min Abandon | The minimum time of an abandoned interaction for the selected interval. |
| Max Wait | The maximum amount of time spent waiting in queue for the selected interval. |
| Min Wait | The minimum amount of time spent waiting in queue for the selected interval. |
| Max Talk | The maximum amount of time spent interacting for the selected interval. |
| Min Talk | The minimum amount of time spent interacting for the selected interval. |
| Max Hold | The maximum amount of time spent on hold for the selected interval. |
| Min Hold | The minimum amount of time spent on hold for the selected interval. |
| Max ACW | The maximum amount of time spent on after call work for the selected interval. |
| Min ACW | The minimum amount of time spent on after call work for the selected interval. |
| Over SLA | Number of interactions that were over the defined Service Level. |
| Met SLA | Number of interactions that met the defined service level. |
| Short Abandon | Number of interactions that were short abandoned. |
| Short Abandon % | Percent of interactions that were short abandoned. |
| Abandon – No Short | Number of abandons excluding the short abandons. |
| Abandon – No Short % | Percent of abandons excluding the short abandons. |
| Outbound Attempt | Attempted outbound interactions for Dialer campaigns. |
| Voicemail | Count of voicemails received. |
| Error | The number of errors that occurred on the queue conversations. |
| SL % | The service level percentage for the queue. |
| SL Target % | The service level target percentage for the queue. |
| Contacting | The number of contacting segments for the queue and interval. |
| Dialing | The number of dialing segments for the queue and interval. |
| Avg Hold Handled | The average time any interaction spent on hold. This calculation takes into account all interactions handled, not just those that were held. Calculated by: Hold / Total Hold |
| Avg ACW Handled | The average time any interaction spent in ACW. This calculation takes into account all interactions, not just those interactions that had ACW time. Calculated by: ACW / Total ACW |
| Outbound Media | The number of outbound media for an interaction. |
|
ACW |
The number of times after-call work (ACW) was completed. After-call work is the work that an agent performs immediately following an interaction. Work may involve keying activity codes, updating customer databases, filling out forms, or initiating outbound contact. As a metric, it indicates the total time an agent takes to finish working on a call. If an agent must complete work before the agent can handle the next contact, then ACW is factored into the average handle time. |
|
Talk |
The number sessions where user(s) interacted during conversations. A session includes the point where the agent joins the conversation to the point where they disconnect. |
|
Wait |
The number of interactions that waited in the queue. |
|
Avg Flow Out |
The average amount of time an interaction spends in queue before it flows out. Calculated by: Total Flow Out Time / Count of interactions with flow-outs For more information, see Queues Performance Summary view. |
|
Max Flow Out |
The maximum amount of time an interaction spends in queue before it flows out. For more information, see Queues Performance Summary view. |
|
Min Flow Out |
The minimum amount of time an interaction spends in queue before it flows out. For more information, see Queues Performance Summary view. |
Routing
For an overview of routing methods, see Routing and evaluation methods.
| Column | Description |
|---|---|
| Bullseye Requested | The number of interactions in which bullseye routing was requested. |
| Bullseye Requested % | The rate of answered interactions in which bullseye routing was requested in comparison to all answered interactions. |
| Bullseye Used | The number of answered interactions in which bullseye routing was used. |
| Bullseye Used % | The rate of interactions in which bullseye routing was used in comparison to all answered interactions. |
|
Conditional Requested |
The number of interactions in which conditional routing was requested. |
|
Conditional Requested % |
The rate of answered interactions in which conditional routing routing was requested in comparison to all answered interactions. |
|
Conditional Used |
The number of interactions in which conditional routing was used. |
|
Conditional Used % |
The rate of interactions in which conditional routing was used in comparison to all answered interactions. |
| Last Requested | The number of answered interactions in which last routing was used. See Last agent handling. |
| Last Requested % | The rate of interactions in which last routing was requested in comparison to all answered interactions. See Last agent handling. |
| Last Used | The number of answered interactions in which last routing was used. See Last agent handling. |
| Last Used % | The rate of interactions in which last routing was used in comparison to all answered interactions. See Last agent handling. |
| Manual Used | The number of answered interactions in which manual routing was used. |
| Manual Used % | The rate of interactions in which manual routing was used in comparison to all answered interactions. |
| Predictive Requested | The number of answered interactions in which predictive routing was requested. |
| Predictive Requested % | The rate of interactions in which predictive routing was requested in comparison with all answered interactions. |
| Predictive Used | The number of answered interactions in which predictive routing was used. |
| Predictive Used % | The rate of interactions in which predictive routing was used in comparison with all answered interactions. |
| Preferred Requested | The number of answered interactions in which preferred agent routing was used. |
| Preferred Requested % | The rate of interactions in which preferred agent routing was requested in comparison with all answered interactions. |
| Preferred Used | The number of answered interactions in which preferred agent routing was used. |
| Preferred Used % | The rate of interactions in which preferred agent routing was used in comparison to all answered interactions. |
| Standard Requested | The number of answered interactions in which standard routing was requested. |
| Standard Requested % | The rate of interactions in which standard routing was requested in comparison to all answered interactions. |
| Standard Used | The number of answered interactions in which standard routing was used. |
| Standard Used % | The rate of interactions in which standard routing was used in comparison to all answered interactions. |
Surveys
| Column | Column Description |
|---|---|
| Response Rate | The number of surveys that customers complete compared with the total number of surveys sent. Surveys sent includes successfully delivered survey invitations and survey invitations that Genesys Cloud attempted to send but could not deliver due to an error, such as an invalid email address or invalid survey form. Calculated by: (Surveys Sent / Surveys Completed) * 100 |
| Sent | The number of surveys sent. This metric includes successfully delivered survey invitations and survey invitations that Genesys Cloud attempted to send but could not deliver due to an error, such as an invalid email address or invalid survey form. |
| In Progress | The number of surveys that customers opened but did not submit. This metric does not include surveys that customers opened but did not submit before the survey expired. |
| Complete | The number of surveys customers have opened and submitted. |
| Surveys Abandon | The number of surveys that customers opened but did not submit before the survey expired. |
| Survey Expire | The number of surveys that expired before the customer opened it. |
| Survey Errors | The number of surveys that Genesys Cloud attempted but failed due to an error. The error includes errors in delivery such as an invalid email address, errors that occurred during the Survey Invite Flow, or other errors in the survey creation. |
| Avg Survey Score | The average of completed surveys' percentage scores. The average score does not include NPS. Calculated by (Sum of completed survey percentage scores / number of completed surveys) * 100 |
| NPS | The Net Promoter ScoreSM (NPS) of completed surveys. The score can range from -100 to 100. Calculated by (Promoters - Detractors) / number of responses) * 100 For more information about Promoters, Detractors, and NPS, see Net Promoter Score web survey question overview. |
| Bounce | The number of times a survey was sent out and returned by the recipient's email server, usually caused by an invalid email address. |
Speech and text analytics
| Column | Column Description |
|---|---|
| Avg Sentiment | Average sentiment score (-100 to 100) in the given interval with the provided filters. |
| Negative Sentiment Instances | The number of negative sentiment instances. For more information, see Understand sentiment analysis. |
| Positive Sentiment Instances | The number of positive sentiment instances. For more information, see Understand sentiment analysis. |
| Sentiment Instances | Number of instances of sentiment in the given interval with the provided filters. |