
Queues Activity Summary view
The following permissions:
- Analytics > Conversation Aggregate > View
- Analytics > Conversation Detail > View
- Analytics > Queue Observation > View
- Directory > User > View
- Routing > Queue > View
- UI > Supervisor Queue Details > View
To open the Queues Activity Summary view and see real-time statistics for all queues at the same time, click Performance > Workspace > Contact Center > Queue Activity. This view updates in real time. If the data does not appear to update in real time, click Refresh to resync the view.
To save the view with your filter and column settings, click Save .
Access other views from the Queues Activity Summary view:
- To see more details about a specific queue and open its Queues Activity Detail view, click the queue’s name.
- To see more information about current and past queue performance in the Queues Performance Summary view, click the Performance tab.
For more information about seeing statistics for only the queues you are a member of, see My Queues Activity view.
Customize the view
Customize the Queues Activity Summary view to show only certain data. For example, you can choose to show only certain columns or filter to see certain types of interactions. Your customizations remain as you leave and return to a view. You can also save your filter and column settings as a saved view to switch between different data of interest in the same view.
- To filter by media type, click the Filter icon
 .
. - Select the media type.
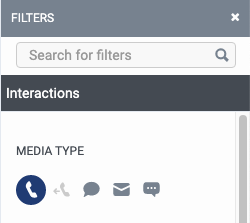
- When filtering you can select more than one media type. Click the relevant media type to select or deselect the type.
- You cannot select the voice and callback types at the same time.
- If you select voice, the callback option will be deselected. If you select callback, the voice interaction will be deselected.
- The available media types may vary from those shown above.
The selected media type icon is displayed above the column headers. For more information about various media types and their settings, see the Set behavior and thresholds for all interaction types section in the Create and configure queues.
| Icon | Media Type |
|---|---|
| All | All media types |
| Voice | |
| Callback | |
| Chat | |
| Messages |
To enter names of queues you want to view, click the Filter queue(s) search icon . Enter the name of the queue and select the queue from the search results. You can continue to enter and select additional queues to add to the view.
Filter by selecting multiple queues
You can select multiple queues to filter by.
- In the queue's row, select the check box.
- Continue selecting queue check boxes to add to filters.
- Click Add to filters.
To populate the summary row above the queue rows to see aggregate metrics for multiple queues, search for and select multiple queues. The summary row then shows aggregate metrics for the selected queues.
To show or hide columns:
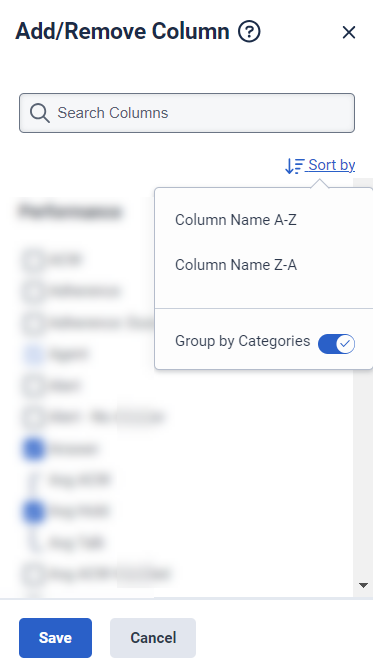
- Click the Pick columns icon on the right side. The Add/Remove Column pane appears.
- (Optional) To sort the columns in ascending or alphabetical order, click Sort by > Column Name A-Z.
- (Optional) To sort the columns in descending or reverse alphabetical order, click Sort by > Column Name Z-A.
- (Optional) To categorize or uncategorize the columns, click Sort by and enable or disable the Group by Categories toggle. Click the image to enlarge.
- Search or scroll to select the columns you want to view. Note: You can also use keyboard navigation to choose the columns.
- Click Save. The selected columns appear on the screen. Note: The column selections appear only after saving the changes and do not apply to the table immediately.
To rearrange the columns, click a column header and drag it.
To reset a view to default column settings, click Reset view to defaults ![]() .
.
You can select up to 20 columns.
For more information about the metrics shown in the columns, see the Available Columns section in this article.
To enter names of queues you want to view, click the Filter queue(s) search icon . Enter the name of the queue and select the queue from the search results. You can continue to enter and select additional queues to add to the view.
Filter by selecting multiple queues
You can select multiple queues to filter by.
- In the queue's row, select the check box.
- Continue selecting queue check boxes to add to filters.
- Click Add to filters.
To collapse or expand the summary row in the view, to the right of the summary row, click Collapse or Expand .
Available columns
To view the available columns, see Queues Activity Summary view section in the View available columns in performance views by category article.
To view the consolidated list of available columns in the performance views, see Consolidated view of available columns in performance views.
To view the list of available columns in the performance views by category, see View available columns in performance views by category.
Interpret counts in the Queues Activity view
In both the summary and detail views, user statuses and routing statuses sometimes add up to more than the total number of agents in the queue. This situation arises when agents change their user status while working with interactions.
For example, agents Bob and Alex are each working with an interaction. Bob changes his status to Break, and Alex changes his status to Meeting, but they both still have a chat interaction. In this situation, the view displays “2” in the Off Queue section, but it also displays “2” in the Interacting section.