Series: Contact center planning
Plan metrics, measurement, and reporting
Most contact centers use performance metrics to measure success in hourly, daily, weekly, monthly, and annual time frames. It is essential to implement the right objective and subjective performance metrics to determine what you do right and where you go wrong.
It is a challenge for every contact center leader to find the right mix of objective and subjective metrics that:
- Support the organization’s mission and strategy,
- Accurately reflect the customer experience you want,
- Reflect how efficiently you are running your business.
The best time to revisit contact center metrics and measurements is during new contact center technology implementation. Keep in mind that calculations used to measure metrics, especially your new technology, may use different terms, calculations, and report layouts. You may have access to new performance statistics and have to figure out if they are relevant in your environment.
Selecting a limited number of key performance objectives is part of a comprehensive measurement strategy. If users must pay attention to every available statistic, they will not see the connection between contact center metrics and daily activities — or know where to focus their efforts. That’s why it is vital that the leadership team:
- Identify the key performance indicators (KPIs) most important to the contact center,
- Communicate them across all levels of the contact center,
- Describe how to measure them and the actions that impact them.
Refer to the standard contact center metrics below for examples of commonly used KPIs.
Questions
Discuss the following questions with your team:
- Do contact center metrics align with the organization’s mission and strategy and your Customer Experience Strategy? If the CES describes the desired customer experience, then key contact center metrics should reflect whether the contact center carries out the strategy. If not, point the way toward prime areas of improvement.
- Do KPIs and supporting metrics cascade throughout the contact center into team and individual performance metrics?
- Do you consider how metrics drive employee behaviors? For example, rigid individual handle-time metrics can make agents rush–an unintended consequence. Conflicting or misaligned metrics may drive behaviors that are at odds with your mission and objectives.
- Are all individual metrics within the individual or team’s ability to control? For example, agents don’t control how many calls they receive during their shift.
- Are contact center objectives clearly defined, measurable, actionable, and attainable?
- Do reporting stakeholders clearly understand where each metric is derived along with the metrics and calculations used for each? Can report stakeholders explain each metric and explain why it is important, how it fits into the overall strategy, and how they and other employees impact it?
- Have you matched report stakeholders with the reports and statistics they need? Be aware that senior leadership does not need as much detail that supervisors require. Do not bog leaders down with extraneous information.
- Is data organized and presented in a way that is easy to understand on reports and dashboards? When statistic layouts are confusing or unclear, it is unlikely stakeholders will use the data for its intended purpose.
Actions
Take the following actions before moving forward in the planning phase:
| Preparation | Assigned to | Complete date |
|---|---|---|
| Gather current reports and determine if they are still relevant, valid, and useful. Document required metrics/measurements/statistics with their current definitions, calculations, and targets. | ||
| Identify potential gaps in current and future reporting and define future needs and requirements. Determine if there are elements of the current reporting environment to replicate in the new system. Determine if there are requirements that weren’t possible to meet in the past that is possible with the new system. | ||
| Identify current sources of reporting metrics, and review level of effort in creating and delivering reports. Focus on opportunities to automate. | ||
| Consider cross-functional reporting requirements for departments outside the contact center. For example, the marketing team may value a report that shows call volume by marketing source. Or the product management team may find meaning in the contact center’s product complaints by customer, product, and complaint type. | ||
| Ensure that all employees fully understand how the organization manages performance and how they and managers access performance metrics. Verify the accuracy of calculations and data sources before you hold employees accountable for performance objectives. |
Standard contact center metrics
| Metric | Definition |
|---|---|
| Metric | Definition |
| Abandon % | The percentage of offered interactions in which the customer disconnected before connecting with an agent. The abandon rate can identify queues that require extra staff to handle interactions in a timely manner. Calculated by: (Abandoned Count / Offered Count) * 100 |
| Abandon | The number of times an end user abandoned an interaction in a queue. For example, the customer hangs up before an agent answers, or the system disconnects the interaction. |
| Average abandon | The average amount of time before a customer disconnects in an ACD queue before connecting with an agent. For example, the customer hangs up before an agent answers, or the system disconnects the interaction. |
| Total abandon | The total amount of time interactions are in queue waiting for an agent to answer them before customers abandoned the interactions. |
| Active agents | The number of active agents. In some views, this number is shown next to the total number of queue members. |
| After-call work (ACW) | The number of times after-call work (ACW) was completed. After-call work is the work that an agent performs immediately following an interaction. Work may involve keying activity codes, updating customer databases, filling out forms, or initiating outbound contact. As a metric, it indicates the total time an agent takes to finish working on a call. If an agent must complete work before the agent can handle the next contact, then ACW is factored into the average handle time. |
| Answered | A measurement of the number of assigned ACD interactions answered by an agent in a given period. Answered increments when the agent is the first to connect to the interaction. |
| Answer % | The percentage of offered interactions that an agent answered. Calculated by: (Answered / Offered) * 100 |
| Meal | The time spent in the Meal status for the specified period. |
| Average wait | The average amount of time an interaction is in a queue before an agent answers it, before the interaction moves out of the queue, or before the customer abandons the interaction. Calculated by: Total Wait Time / Interactions |
| Average hold | The average number of seconds that interactions were placed on hold. Calculated by: Total Hold Time / Count of interactions with holds |
| Average after-call work (Avg ACW) | The average amount of time agents spent completing after-call work. Calculated by: Total ACW / Interactions with ACW |
| Avg talk | The average number of seconds spent interacting on a media type. Calculated by: Total Talk time / Count of interactions with Talk time |
| Connection | The number of connected customer sessions. A customer session includes any activity where an external party has joined a conversation. For example, a single customer session indicates a customer calling the system to go through the IVR, waiting in the queue, and getting answered. |
| Contacts handled | The total number of ACD and non-ACD interactions that agents were involved in for the selected media type. Handle increments in the interval in which the interaction ends, after the agent completes any after call work and completes the interaction. |
| Customers interacting | The number of customers in conversation or on chat with an agent. |
| Customers waiting | An instantaneous observation of the number of interactions waiting in the queue to be answered. Waiting is calculated by the sum total of the number of interactions waiting. |
| Handle | The total number of ACD and non-ACD interactions that agents were involved in for the selected media type. Handle increments in the interval in which the interaction ends, after the agent completes any after call work and completes the interaction. |
| Average handle time (AHT) | The average amount of time agents spent handling interactions. This calculation includes talk time, hold time, and after-call work. For outbound calls it also includes dialing and contacting time. Calculated by: (cumulative talk time + cumulative hold time + cumulative after-call work + cumulative dialing time + cumulative contacting time) / Number of interactions handled Note: The interactions can span multiple time intervals. For example, a 45-minute call spans two 30-minute intervals. However, metrics are assigned a single timestamp and reported in the interval into which this timestamp falls. The timestamps are assigned based on when the metric calculation is complete.
For instance, handle time will use the timestamp of after call work completion. In the example of a 45-minute call, the handle time falls in the second 30-minute interval because the handle time was calculated at the end of the call when ACW was submitted. |
| Average speed of answer (ASA) | The average amount of time an interaction waits in queue before an agent answers it. This metric does not include interactions that agents do not answer. ASA is directly associated with the service level and provides insight into the customer service your company provides. ASA is recorded in the interval in which the agent answered the interaction. Calculated by: Total Answered (tAnswered Sum) / Answered Count (tAnswered Count) Note: Raw values are provided in milliseconds. |
| Held interactions | The number of interactions with holds. |
| Hold | The cumulative hold time for all interactions. |
| Interacting | The time that the agent was handling interactions or the number of interactions handled by an agent. |
| Training | The time spent in the Training status for the specified period. |
| Logged in | The total amount of time a user is logged in for the specified period. |
| Meeting | The time spent in the Meeting status for the specified period. |
| Offered | The number of interactions routed into the queue for an agent to answer. Offered interactions are either answered, abandoned, or flow-out interactions. |
| Offered to assignment | A measurement of call attempts that reach the Assignment Service including abandoned calls. |
| Break | The time spent in the Break status for the specified period. |
| On Queue | The On Queue metric represents the number of agents that are on queue for a specific queue. |
| Off Queue | Off Queue represents the number of agents that are off queue for a specific queue. These agents are in another status, such as Available, Busy, or Meeting. Agents in the Out of Office and Offline statuses are not included in this number. |
| On unassigned interactions | This metric represents the number of agents currently working on non-assigned interactions. This value may not indicate misappropriated work. Non-assigned interactions could include after call work calls. |
| Remote | The name or number in communication with the named agent. A name appears only if the remote number matches a directory entry. Note: Genesys Cloud obtains the remote number from the telco carrier. If the telco carrier does not provide data in the header, the location of the remote number will appear as the remote number. |
| Service level % | Service level target is a contact center performance statistic expressed as “X percent of conversations answered in Y seconds.” For example, a goal of answering 80% of voice calls within 20 seconds provides a service level target of 80/20. You can set the service level target for each media type in a queue. Analytics uses this service level target to calculate whether you are within the service level % defined by your service level agreement (SLA). For more information about setting the service level target, see Create queues or Edit or delete queues. Note: In the performance views that are not queue-specific, the Service Level % is calculated by queue and displayed as a – on the aggregated group row since SLA targets vary by queue. The affected views are DNIS Performance Summary and Skills Performance views. To view individual queue service level %, click the + to expand the row.
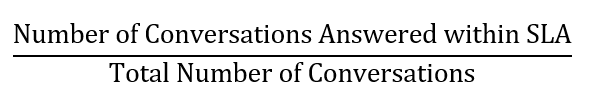
The service level % is the percentage of interactions that meet your contact center's service level target. The formula to calculate the service level % is:
Number of Conversations Answered within SLA The numerator is calculated by taking the total answered conversations and subtracting the conversations that were not answered within the SLA threshold. Calculated by: (Answered Count – SLA Violation Count) Total Number of Conversations The Service Level Options configuration determines the denominator. With all the options below unchecked, the denominator is the count of answered conversations.
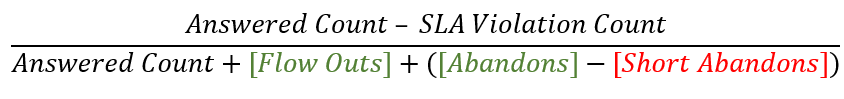
As the service level calculation depends on an organization’s configured options, the final formula to calculate the service level is:
Note: With the Flowouts and Abandons enabled, the Flowouts and the Abandons are added into the denominator when calculating the service level. With the Short Abandons disabled, the Short Abandons are subtracted from the Abandons when calculating the service level. |
| Staffed agents | An instantaneous observation/query equivalent to Joined to Queue X. Staffed agents are the set of people that are currently staffed on a queue. |
| Supplemental agents | An instant observation/query equivalent to Role of Agent & Eligible to Join Queue X & Online & not joined to queue X. Supplemental agents are the set of people that can be staffed for a queue. |
| Total Talk | The total amount of time spent interacting on all the conversations by the agent, within an interval. For example, in an interaction, where an agent accepts an interaction, talks to the customer for two minutes, places the customer on hold for one minute, and then talks to the customer again for two minutes, the Total Talk equals 4 minutes. |
| Time in status | The amount of time the agent has been in the current status. |
| Transfer % | The number of transfers compared to the total number of interactions answered. Calculated by: (# of transfers / Interactions Answered) * 100 |
| Transfer | A measurement of the number of interactions an agent answered in one queue and then transferred. A transfer counts for the queue in which an agent answers the interaction. This measurement is calculated by the number of interactions blind transferred or consult transferred. |
| Consult | The number of interactions an agent answered and then consulted with another participant with or without fully transferring the interaction. A consult counts for the queue in which an agent answers the interaction, even if they consult with another queue. |
| Trunk load | Trunk load is a time-related metric that includes all components of a voice interaction, other than the after-call work which does not require a circuit. Trunk load = Ring + Attendant/IVR + Assignment + Talk Time |
| Total wait | The total amount of time an interaction is in a queue before an agent answers it, it flows out, or the customer abandons it. Genesys Cloud calculates the wait time in milliseconds. |
| Waiting | The number of interactions that waited in the queue. |
| Working interactions | A derived metric of the total count of unique interactions being worked by an agent within a time period. Calculated by: Unique Interactions Holding + Talking + ACW. |
| Communicating | The agent is on a non-ACD call, and, in relation to agent utilization and call routing, Genesys Cloud treats the non-ACD call like an ACD call. For example, administrators could configure agent utilization so Genesys Cloud does not route new interactions to agents while they are on an ACD or non-ACD call. This status only appears if administrators have selected “Count non-ACD calls in utilization capacity” within the agent utilization configuration. |
| Not Responding | An agent was On Queue or Interacting and did not answer an offered interaction. The agent could still be handling and completing other previous interactions. While Not Responding, the agent does not receive new interactions. |
| Available | The time spent in the Available status for the specified period. |
| Away | The time spent in the Away status for the specified period. |
| Busy | The time spent in the Busy status for the specified period. |
| Idle (Away) | The time spent in the Away status. Genesys Cloud puts agents into the Idle status when they are logged on to the desktop application but the screen saver engages, the screen locks, or the system enters sleep mode because of the agent's inactivity. The amount of time it takes for Genesys Cloud to change the agent's status to Idle depends on the user's system settings. When an agent enters Idle status, Genesys Cloud displays the agent's status as Away (for example, on the agent's profile page). |
| Idle | The amount of time an agent spends in the Idle routing status. This routing status represents agents who are On Queue and able to take interactions but are not currently working with interactions. |
| Flow-Out | Flow-outs are interactions that enter and leave a queue without getting answered by an agent and without getting disconnected. Flow-outs are an indication of customer service level and queue productivity. High numbers of flow-outs can indicate staffing issues or ineffective agents when used with high handle times (bullseye matching metrics). Flow-outs can include transfers to voicemail, callbacks, and any system-driven events such as in-queue flows that transfer to another queue or external party after a certain amount of time. Flow-outs can also occur if the caller opts to exit out of the queue and return to the IVR. Offered interactions are either flow-out, answered, or abandoned interactions. |
| Outbound | This metric represents the number of outbound interactions placed on behalf of queue. |
| Total handle | The total amount of time agents spend on an interaction including time spent contacting, time spent dialing, talk time, hold time, and after call work. |
| Total dialing | The total amount of time an outbound interaction spends dialing a contact. |
| Average dialing | The average amount of time an agent spends dialing and waiting for a contact to answer during outbound interactions.
Calculated by: (total dialing time/ total number of dialing segments) |
| Total contacting | The total amount of time outbound interactions take to connect to the agent’s phone. Usually, this duration is short. However, if the agent uses a remote phone the duration may be longer. |
| Average contacting | The average amount of time an outbound interaction takes to connecting to the agent’s phone. Usually, this duration is short. However, if the agent uses a remote phone the duration may be longer. |
| Alert - No Answer |
The number of times an agent was alerted to a conversation but did not answer the conversation. Note: This metric does not specifically count the number of times an agent was placed in a Not Responding routing status. An agent is transitioned to Not Responding status after a specific alert time threshold for ACD-routed conversations. Alert – No Answer can be incremented for all conversation types for any situation where an alert was not followed by an answer event.
|
| Total Alert - No Answer | The total number of seconds Genesys Cloud offered an agent an interaction before the agent declined the interaction or the interaction timed out. |
| Alert | The number of times agents receive an alert for interactions. |
| Total Alert | The total time Genesys Cloud alerts agents before the agent accepts or declines an interaction. |
| Avg Flow | The average amount of time that an entry spent in the flow. |
| Entries | The total number of times that calls enter the flow or flow version. A call can enter a flow multiple times. |
| Max Flow | The longest amount of time that an entry spent in the flow. |
| Total Flow | The total time entries spent in the flow. |
| Avg Disconnect | The average amount of time until an entry disconnected in a flow. |
| Customer Disconnect | The number of times customers disconnected in a flow, including the percentage of customer disconnects compared with the disconnect count. |
| Customer Short Disconnect | The number of times customers disconnected in a flow before a short disconnect time. Includes the percentage of customer short disconnects compared with the disconnect count. The default short disconnect time is less than 10 seconds, though administrators can set the short disconnect time to any threshold they want. For more information, see the Configure analytics settings section in Configure contact center analytics options. |
| Disconnect | The number of entries that disconnected in the flow, including the percentage of entries that disconnected compared with the total number of entries. |
| Flow Disconnect | The number of times a flow disconnected entries, including the percentage of flow disconnects compared with the total number of disconnects. |
| Max Disconnect | The longest amount of time that an entry spent in the flow before disconnecting. |
| System Error Disconnect | The number of times entries disconnected in a flow due to a system error. This column includes the percentage of system error disconnects compared with the total number of disconnects. |
| Total Disconnect | The total amount of time an entry spent in a flow until it disconnected. |
| ACD Exit | The number of times an entry exited a flow to an ACD queue. Includes the percentage of ACD exits compared with the total number of exits. |
| ACD Voicemail Exit | The number of times an entry exited a flow to an ACD voicemail. Includes the percentage of ACD voicemail exits compared with the total number of exits. |
| Avg Exit | The average amount of time that an entry spent in a flow before exiting. |
| Exit | The number of entries that exited the flow to another destination, such as an ACD queue, ACD voicemail, or user. Includes the percentage of exits compared with the total number of entries. |
| Flow exit | The number of times an entry exited a flow to another flow. Includes the percentage of flow exits compared with the total number of exits. |
| Group Exit | The number of times an entry exited a flow to a group. Includes the percentage of group exits compared with the total number of exits. |
| Max Exit | The longest amount of time that an entry spent in the flow before exiting. |
| Number Exit | The number of times an entry exited a flow to a number. Includes the percentage of number exits compared with the total number of exits. |
| Secure Flow Exit | The number of times an entry exited a flow to a secure flow. Includes the percentage of secure flow exits compared with the total number of exits. |
| Total Exit | The total amount of time an entry spent in a flow until it exited the flow to another destination, such as an ACD queue, ACD voicemail, or user. |
| User Exit | The number of times an entry exited a flow to a user. Includes the percentage of user exits compared with the total number of exits. |
| User Voicemail Exit | The number of times an entry exited a flow to a user's voicemail. Includes the percentage of user voicemail exits compared with the total number of exits. |
| Avg Outcomes (Flow Outcomes) | The average number of flow outcomes per entries into the flow. Calculated by: number of flow outcomes / number of entries |
| Failure (Flow Outcomes) | The number of flow outcomes that were failures. Includes the percentage of failure outcomes compared with the total number of outcomes. |
| Outcome (Flow Outcomes) | The number of flow outcomes. |
| Over SLA | The number of sessions that exceeded the service level target. |
| Success (Flow Outcomes) | The number of flow outcomes that were success. Includes the percentage of success outcomes compared with the total number of outcomes. |
| Met SLA | Number of interactions that met the defined service level. |
| Short Abandon % | Percent of interactions that were short abandoned. |
| Short Abandon Count | Number of interactions that were short abandoned. |
| Adherence Status | The current adherence status of the user, including In Adherence, Out of Adherence, Unscheduled, Ignored, or Unknown. |
| Scheduled Activity | The activity for which the user is currently scheduled, including On Queue Work, Break, Meal, Meeting, Off Queue Work, Time Off, Training, Unavailable, or Unscheduled. |
| Adherence Duration | The amount of time represented in days, hours, minutes, and seconds, of the adherence exception. |
| Min Alert | The minimum amount of time an agent was being alerted. |
| Max Alert | The maximum amount of time an agent was being alerted. |
| Min Alert - No Answer | The minimum amount of time an agent was being alerted without responding to an interaction. |
| Max Alert - No Answer | The maximum amount of time an agent was being alerted without responding to an interaction. |
| Min Handle | The minimum amount of time agents were involved in ACD and non-ACD interactions, including answered interactions, transfers, callbacks, and outbound calls. |
| Max Handle | The maximum amount of time agents were involved in ACD and non-ACD interactions, including answered interactions, transfers, callbacks, and outbound calls. |
| Min Talk | The minimum amount of time spent interacting for the selected interval. |
| Max Talk | The maximum amount of time spent interacting for the selected interval. |
| Min Hold | The minimum amount of time spent on hold for the selected interval. |
| Max Hold | The maximum amount of time spent on hold for the selected interval. |
| Min Answer | The minimum amount of time an agent spent answering assigned ACD interactions for the selected interval. |
| Max Answer | The maximum amount of time an agent spent answering assigned ACD interactions for the selected interval. |
| Min ACW | The minimum amount of time spent on after call work for the selected interval. |
| Max ACW | The maximum amount of time spent on after call work for the selected interval. |
| Blind Transfer | The number of interactions an agent answered in one queue and then blind transferred. A blind transfer counts for the queue in which an agent answers the interaction. |
| Blind Transfer % | The percentage of interactions an agent answered in one queue and then blind transferred. |
| Consult Transfer | The number of call interactions an agent answered in one queue and then consult transferred, meaning they connected with a person or queue before transferring the call. A consult transfer counts for the queue in which an agent answers the interaction. See Consult transfer a call. |
| Consult Transfer % | The percentage of interactions an agent answered in one queue and then consult transferred. |
| Max Wait | The maximum amount of time spent waiting in queue for the selected interval. |
| Dials |
The number of interactions initiated by the campaign. |
| Contacts | The number of interactions initiated by a remote party and connected to an agent. |
| Campaign Connect Rate | The total number of interactions detected as live voice interactions, divided by the total number of interactions initiated, expressed as a percentage. This rate is based on the previous 10-minute time interval. |
| Total Abandon |
The total amount of time interactions are in the queue waiting for an agent to answer them before customers abandoned the interactions. |
| Dial Abandon Rate |
The percentage of Compliance Abandons divided by total dials. |
| Contact Abandon Rate |
The percentage of Compliance Abandons divided by total contacts. |
| Dialing | The length of time that the call spent dialing and ringing. For example, a call that rings for 15 seconds and then disconnects show Dialing as 15 seconds. |
| Time to Agent | The length of time that elapsed from when a customer answered the call to when an agent answered the call, including call analysis. This column is empty if the call is in preview mode, transferred to the outbound flow, or gets disconnected or abandoned before an agent answers it. |
| Time to flow | The length of time from when a customer answered the call to when the system transfers the call into an outbound flow. This column is empty if the call is in preview mode or if the call transferred to the queue. |
| Time to abandon |
The duration of time until the conversation was abandoned. |
| Disconnect time | The time that the call disconnected. |
| Skills | Displays the skills set by the routing services for the interaction. |
| Active Total Callback | Active total callback duration is the sum of all calling activity for the call portions of the callback. For example, the active total callback duration could include all durations from the call portion of a callback: tContacting --> tDialing --> tTalk --> tHeld --> tTalk --> tAcw. |
| IVR Segments | The number of times the interaction enters an IVR. |
| Total IVR | The total amount of time that interactions spent in IVRs. |