
Series: Historical adherence
Navigate the historical adherence view
Prerequisites
- Workforce Management > Adherence > View permission
- Groups > Work Teams > View permission
Information in the historical adherence view varies based on the number of agents in the management, work teams, and dates requested. Due to this, retrieving data for the first time could take several minutes. After the first view, the default view that loads is the same data that you selected during your previous visit. To view data based on work teams, see Access the historical adherence view.
The following table lists the fields and its corresponding descriptions.
| Area | Description |
|---|---|
| Date filter | Displays the week selection done in the previous selection. You can however modify the date range by clicking the date selector icon. |
| By Adherence dropdown | Use this dropdown to view agent details either by adherence or conformance. |
| By Agents dropdown | Use this dropdown to select the adherence view based on the number of agents in the currently selected management unit or by the total number of exceptions for the selected time range. You can view the exception data of an agent by clicking the corresponding links in the Exceptions column in the table below. |
| Average Adherence % | Displays the average adherence percentage of the agents in the management unit for the selected time range. |
| Target Adherence % | Displays the target adherence percentage to be achieved in the selected time range. |
| Average Conformance | Displays the average conformance percentage of the entire management unit for the selected time range. This information appears when in the Conformance view. |
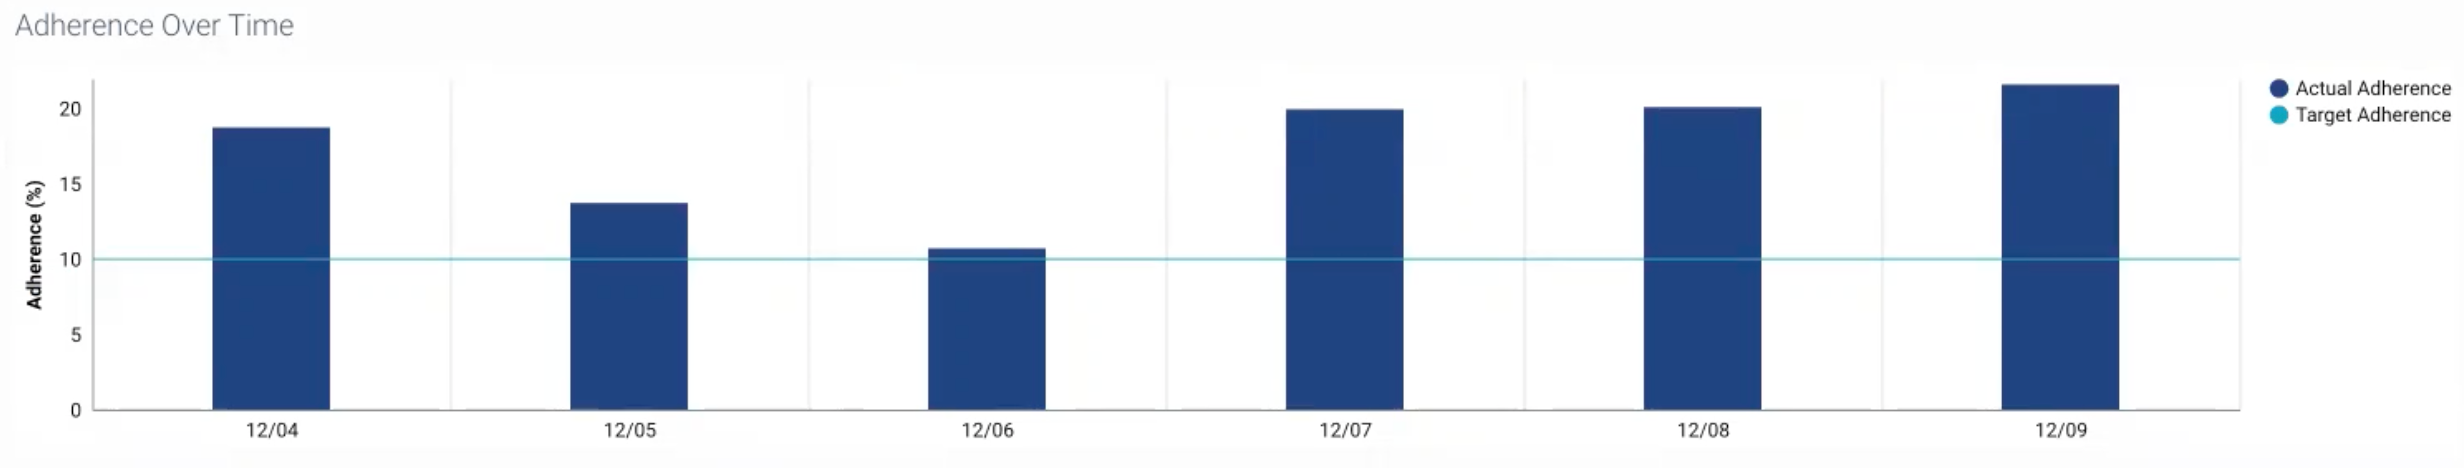
| Adherence over time bar chart |
Shows adherence percentage for the selected period. Click or point to a bar to see adherence percentages about a specific date in the selected range.
This bar chart displays by default on the Historical Adherence view. This chart is also displayed when the data is selected for adherence and does not display when the data is selected for conformance. This selection is made in the By Adherence dropdown on the upper right of the page. Click a bar to view a detailed report for the selected date. Note: When you view this chart for your work team the target adherence graph line is not displayed when the agents belong to different management units as the target adherence can be different for each management unit. In case, the target adherence is the same for the management units the agent map under, then the average target adherence graph line is displayed.
|
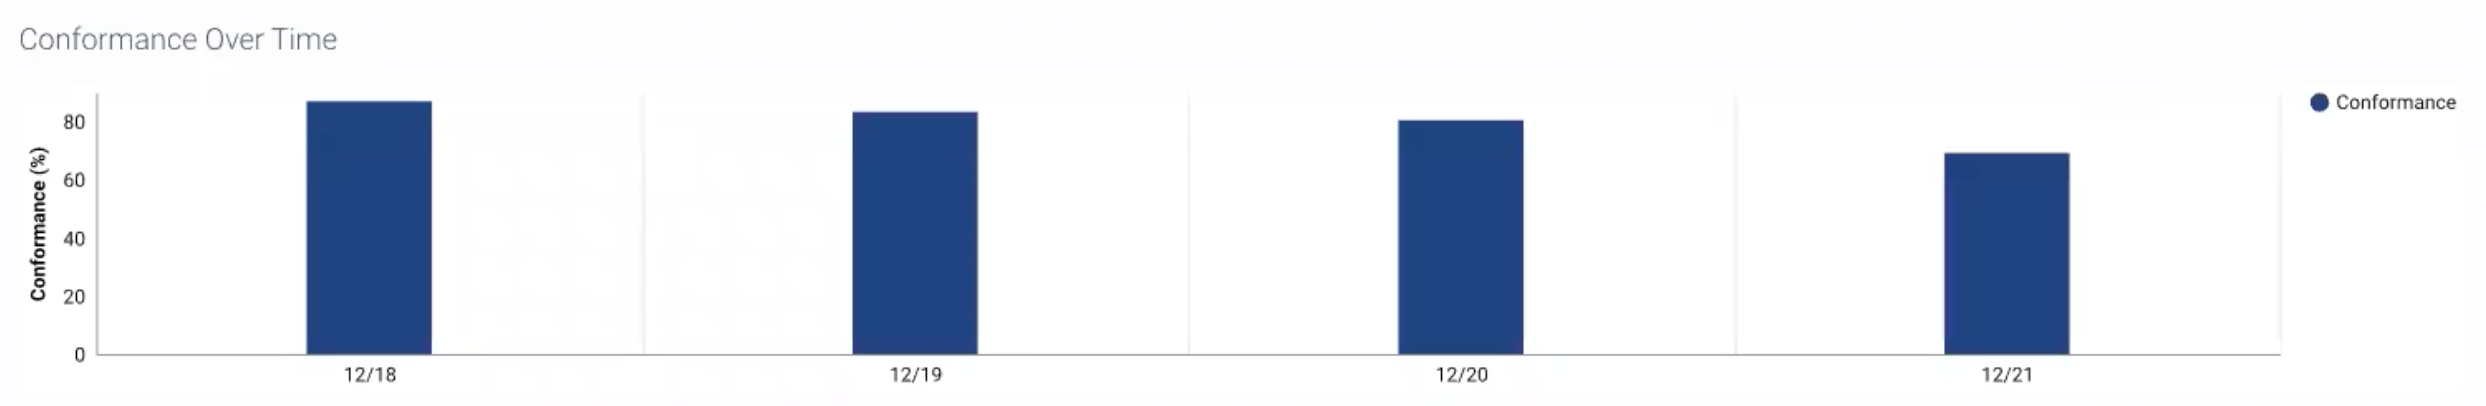
| Conformance over time bar chart |
Shows conformance percentage for the selected period. Click or point to a bar to see conformance percentages about a specific data in the selected range.
This bar chart displays only when you select conformance in the By Adherence dropdown on the upper right of the page. Click a bar to view a detailed report for the selected date. |
| Search | Use this field to perform search or filter the data in the data grid for a particular selection. |
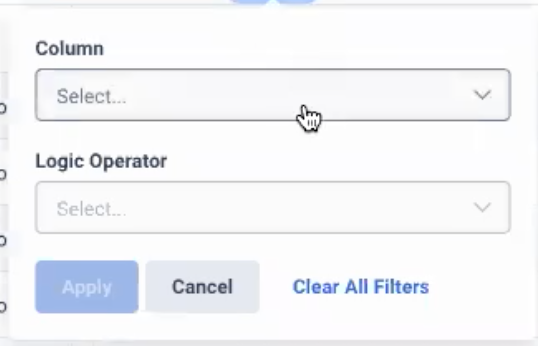
| Filter |
You can filter the data displayed by clicking the Filter icon. Select the required metric from the Column dropdown and the agents from the Logic Operator dropdown.
Click Apply to view the data as per your selection. You can perform the same action when in the Exceptions view. |
| Export | Use this field to download the .csv file by clicking the Export button. You can perform the same action when in the Exceptions view. |
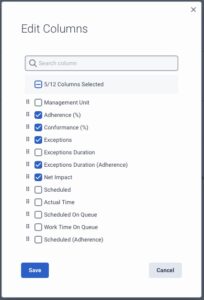
| Settings |
You can customize the columns to view adherence for agents and adherence for exceptions in the table view by clicking the Gear icon. In the Edit Columns popup, modify the view. The columns available in agents view and exception view are different. The Edit Column pop-up for adherence for agents displays the following columns from which you can select the required columns to be displayed.
Similarly, you can perform the same actions when in the Exceptions view. When you click Save, you can view the updated columns. |
| Agent |
The number of agents in the currently selected management unit. In day and week views, you can:
|
| Management unit |
Displays the management unit the agent belongs. This is helpful especially during work team view where agents can belong to different management units. When you hover on the management unit detail, the following details are displayed:
|
| Adherence % | The agent’s percentage of adherence. This figure is calculated as follows: (1 – (total exception time / (total scheduled time in interval))) * 100; range: 0-100%. |
| Conformance % |
The agent’s percentage of conformance. This figure is calculated as follows: (total in conformance time / total time for scheduled activities for conformance in interval) * 100; min: 0%. Note: If an agent works, but is not on the schedule, then appears in the Conformance column for this agent. |
| Exceptions |
The agent’s total number of exceptions for the selected time period. Use the link in this field to combine individual exceptions by agent. This view includes the management unit, exception start date and time, duration, duration adherence, impact, scheduled code, actual code, scheduled activity, actual activity, status, and secondary status. You can view the same data by selecting Exceptions from the Agent dropdown on the upper right of the page. |
| Exceptions Duration (Adherence) |
The total time of exceptions for the period, minus the exception count, multiplied by configured minimum exception threshold (exceptionDuration – (exceptionCount * exceptionThresholdSeconds)). |
| Impact | Displays whether the data in the view has a positive or negative impact. When the arrow points upwards, it indicates a positive impact and when downwards, it indicates a negative impact. |
| Exceptions Duration | The agent’s total exception time for the selected time period. |
| Scheduled | The length of time that the agent was scheduled for any activity category. If Working Outside Shift Considered Exception is enabled, then this column includes the length of time that the agent was on queue, but not scheduled. |
| Actual Time | The actual length of time for which Genesys Cloud contains valid data. |
| Net impact column |
Indicates whether the total impact for the selected date range is positive, negative, or neutral. For example, 10-minutes positive impact and 12-minutes negative impact equals 2-minutes negative net impact for the selected period. |
| Scheduled column |
The length of time the agent was scheduled for any activity category. |
| Scheduled (Adherence) column |
The length of time that the agent was scheduled for any activity category. If Working Outside Shift Considered Exception is enabled, then this column includes the length of time that the agent was on queue, but not scheduled. |
| Actual Time column |
The actual length of time for which Genesys Cloud contains valid data. |
| Agent exception level grid |
Click the next to an agents name to view specific details about each exception, including:
|
The Exceptions view displays the agent data for the selected time range. To view the exceptions view of an agent, perform the following steps:
- In the Historical Adherence view, in the table below, in the Exceptions column, select the required agent.
- Click the link available against every agent.
The Exceptions view is displayed. The upper section of the view displays the average adherence percentage, average conformance percentage, target adherence percentage along with the impact. In the table below, you can view exception details including the management unit, start date and time, duration, duration (adherence), impact, scheduled code, actual code, scheduled categories, actual, status, and secondary status.
| Action | Description |
|---|---|
| Search | Use this field to perform search or filter the data in the data grid for a particular selection. |
| Filter |
You can filter the data displayed by clicking the Filter icon. Select the required metric from the Column dropdown and the agents from the Logic Operator dropdown.
Click Apply to view the data as per your selection. You can perform the same action when in the Exceptions view. |
| Export |
Use this field to download the .csv file by clicking the Export button. |
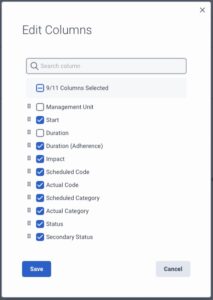
| Settings |
You can customize the columns in the table view by clicking the Gear icon. In the Edit Columns popup, modify the view. The columns are available in agents view and exception view are different.
When you click Save, you can view the updated columns. |
| View exception details of agents | You can switch to view the details of other agents in the management unit. In the upper right of the view is the agent details selection feature. Click the  field to select the agent from the list or use the forward and backward buttons to select the agent and view agent specific exception details. field to select the agent from the list or use the forward and backward buttons to select the agent and view agent specific exception details. |
| Back | Click the Back button to navigate back to the main table of agents. |
By default, this view uses the business unit’s time zone (new regions) or the management unit’s time zone (existing regions). Users with administrator permissions can change the displayed time zone by selecting from the list in the upper right corner of the view. This option is helpful for administrators who access the view from a different time zone.
This section shows a historical adherence bar chart for the selected date or date range. Click or point to a bar to see adherence percentages about a specific date in the selected range.
In week, month, or custom range view, when you click a bar, or shift-click multiple bars on the graph, the adherence percentage changes to the summary and exception information for the selected date or range. Click the bar again to reset the bar to the selected period. This example shows the graph in week view:
Use date filters to customize your view of current historical adherence metrics. You can select a single date, or a specific week, month, or custom date range.
- Click the date filter.
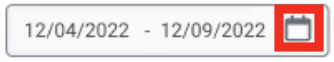
- Click a view option for the chosen date type.

The view displays the time period for the selected filter.
You can view the data that was selected during the previous session. If you want to update the current interval statistics, then refresh the page. If the selected date filter shows historical data (past intervals), then the view does not refresh.
To view metrics for a different time period using the same filter settings, select the date picker and select the required date range.
To view metrics for the time period that includes the current interval, click Today. 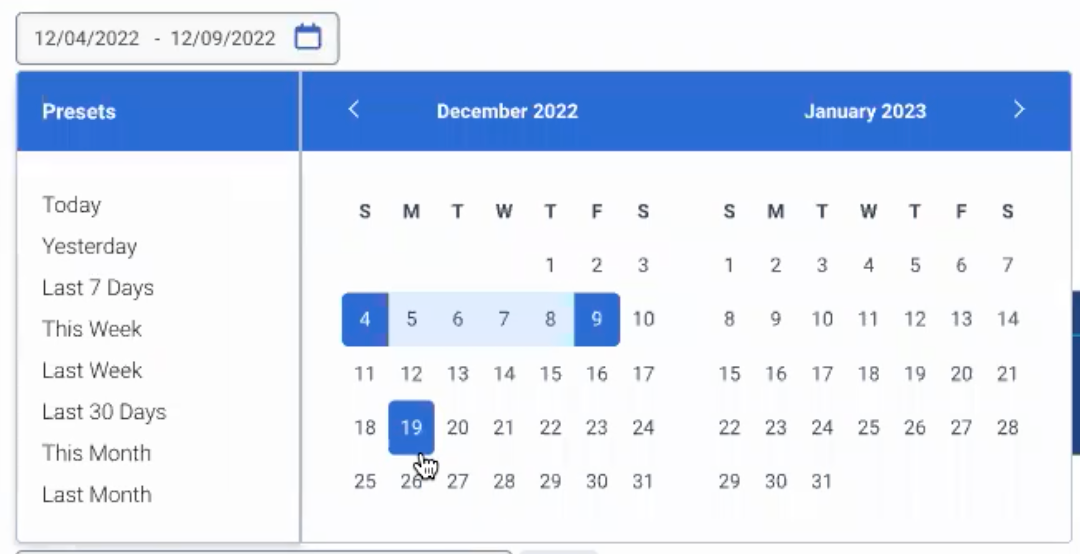
Historical adherence metric definitions include:
Agent-specific exception metric definitions include:
| Metric | Definition | ||||||
|---|---|---|---|---|---|---|---|
| Start | The start date or time of the adherence exception. | ||||||
| Duration (Adherence) | The exception duration of the adherence exception minus the configured minimum exception threshold. | ||||||
| Impact |
The positive, negative, neutral, or unknown impact of the adherence exception.
|
||||||
| Scheduled | The scheduled activity category based on the scheduled activity code. | ||||||
| Actual | The actual activity category based on status to activity mapping. | ||||||
| Status | The selected agent’s status during the exception. Note: When the status is “On Queue,” the routing status also displays. |
||||||
| Secondary Status |
The selected agent’s secondary status, if the agent sets one. |
||||||
| Duration | The duration of the adherence exception. By default, this column is hidden. |
Use the export feature to export historical adherence data in CSV format. Historical adherence exports data in UTC times. The exported data includes all information in the agent exception level grid.
To export the data, click the Export icon. The data downloads in CSV format to your specified location.