
Series: Intraday monitoring
Manage the displayed metrics
You can add, remove, rearrange, and configure the displayed metrics to customize the intraday monitoring view.
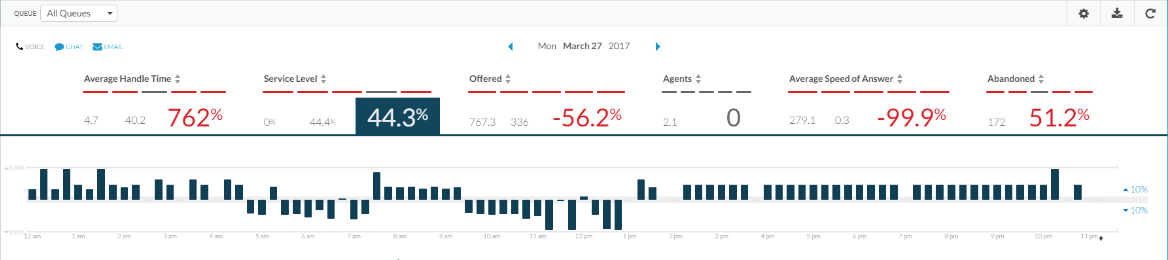
Click the percentage for the metric you want to view in graph form.
Notes:
- Graphs are not available for the following columns: Answered, Abandoned, and Completed.
- Use the up and down arrows on the right side of the graph to configure the valid range. Values outside the valid range appear in red.
- The differences of percentages such as service level and occupancy display as a percentage difference, not as a percent of a percent.
- Values in red indicate that the metric is out of the acceptable range. In the graph below, that range is plus or minus 10% as shown to the far right of the graph.
- Below each metric, the system includes lines that indicate the last five intervals.
Genesys Cloud remembers the display settings you set here.
- Click the display button located in the upper right corner.
 The Display Options dialog box opens.
 - From the Time Format list, choose to set the time format in:
- Duration (default)
- Digital
- Seconds
- Use the up and down arrows to choose the digits of precision. Note: The default setting is 0; options include 0, 1, or 2.
- Use the up and down arrows to set the minimum target percent for answered interactions.
- Use the up and down arrows to set the maximum target percent for abandoned interactions.
- Use the up and down arrows to set the minimum target percent for completed interactions.
- Click OK.
- Click the arrow at the end of an existing column. A list of metrics appear.
- To add a specific metric, click the metric you want to add to the view.
- To insert the next available metric from the list, click Insert column. The next available metric column appears after the selected one.
- Click the arrow at the end of the metric you want to replace. A list of metrics appear.
- Click the metric you want to display. The new metric column appears, replacing the existing one.
- Click the arrow at the end of the metric you want to remove. A list of metrics appear.
- Click Hide Column. The next available metric column appears after the selected one.
- Click the arrow at the end of any metric. A list of metrics appear.
- Click Reset to defaults.
Work with the intraday monitoring view :Previous Suggested Article Next Suggested Article: Export intraday monitoring data