Series: Intraday monitoring
Intraday monitoring overview
Intraday monitoring enables you to see the differences between what was originally forecast and what actually occurs in real time for the current day. Administrators can make informed schedule adjustments throughout the day to suit changing conditions; for example, add agents to improve service levels or send agents home if too many agents are available. Intraday monitoring is mostly beneficial for monitoring the current day’s actual activities, but can also be useful to view data from past or future days.
- Intraday monitoring uses the planning group configurations that were originally used to create the forecast that is linked to the published schedule for a specific day. Therefore, if planning group configurations have been changed since the forecast was generated, those changes will not be reflected. Actuals displayed in intraday monitoring, including headcount, are based on the planning group configuration when the forecast was created.
- Answered, abandoned, and completed percentages are percent of offered calls.
- For interaction-based metrics, forecast averages are average-weighted by offered.
- For interaction based-metrics, actual averages are average-weighted by completed, with the exception of service level and average speed of answer. Service level is average-weighted by (answered + abandoned). Average speed of answer is average-weighted by answered.
- Service level is calculated as the percent of interactions answered within service level objective of (answered + abandoned) interactions.
- To ensure accurate predicted ASA values, make sure the schedule contains all agents that answer interactions in the planning groups. The predicted ASA calculation only uses the number of agents that handle the planning group from the published schedule.
- Intraday monitoring only displays inbound statistics.
- To compare values between intraday monitoring and other views, make sure you add an appropriate filter.
- Intraday monitoring only includes agents currently in the selected business unit. An agent’s queue membership and which planning groups can be handled are based on the current queue configuration, whether or not the schedule is in the past. Scheduling configuration information (shrinkage, etc.) uses currently configured values.
- In the intraday monitoring grid, the agents Scheduled value displays the average, not total, counts.
- Intraday monitoring uses the planning groups that were used to create the forecast that is linked with the published schedule for that day.
- The schedule must be a published, load-based schedule that includes the date to view in intraday monitoring.
- If actuals appear low in the intraday monitoring view, it could be due to planning group configuration. Remember these key items when you configure planning groups:
- The <none> option for languages and skills specifically means that the interaction has either no language or no skill. The setting does not mean “any” language or “any” skill.
- When you configure skills in a planning group, selecting more than one skill means that the planning group is make up of interactions with all the skills selected, not any of skills listed.
You can use the intraday monitoring features to compare the forecast and actual contact center activity, including the number of interactions or average handle time, in the data column view. The information is displayed in numeric value of each 15-, 30-, or 60-minute interval, and includes columns that highlight the differences between forecast data and actual data.
Red values mean the data should be further investigated. Summary values appear at the top. The forecast value summaries are for the full user-selected time range, whereas the actual value summaries are for the historical range.
By default, the intraday monitoring view displays the following metrics. To add, remove, or change the displayed order, see Manage the displayed metrics.
- Service Level
- Offered
- Answered
- Abandoned
- Average Handle Time
- Agents
Hidden by default:
- Completed
- Average Talk Time
- Average After Call Work Time
- Average Speed of Answer
- Occupancy
View from a different time zone
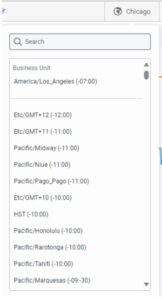
By default, this view uses the business unit’s time zone. Users with administrator permissions can change the displayed time zone by selecting from the list in the upper right corner of the view. The time zone of the business unit is listed at the top of the list of time zones for reference. This option is helpful for administrators who access the view from a different time zone. Click the image to enlarge. 
Access the intraday monitoring view
- Click Admin.
- Under Workforce Management, click Intraday Monitoring.
- Click Menu > Supervisor > Intraday Monitoring.
- From the Business Unit list, located in the upper right corner, select the business unit.
For more information about intraday monitoring, see the following articles.
| Task | Description |
|---|---|
| Work with the intraday monitoring view | Perform various tasks in the intraday monitoring view. |
| Manage the displayed metrics | Add, remove, rearrange, and configure the metrics displayed in intraday monitoring. |
| Export intraday monitoring data |
Export intraday monitoring data in CSV format so that you can import it into future forecasts. |
| Change intraday monitoring display options |
Change the display interval; select the time format to display; configure minimum target percentages for answered, abandoned, and completed interactions. |
| Workforce management metric definitions |
Learn about the metrics available in intraday monitoring. |

