
Agent activity insights
- Genesys Cloud EX, Genesys Cloud CX 3, Genesys Cloud CX 3 Digital, Genesys Cloud CX 1 WEM Add-on II, or Genesys Cloud CX 2 WEM Add-on I license
Permissions for agents:
- Coaching > Appointment > Participate
-
Gamification > Scorecard > View
-
Gamification > Agent Profile Membership > View
-
Gamification > Insights > View
- Learning > Assignment > View
- UI > Agent Activity > View
- Workforce Management > Agent Schedule > View
Supervisor permissions:
- Gamification > Scorecard > All
- Gamification > Insights > All
The Insights view enables supervisors to gain insights about an agent’s performance between two specific dates. As a supervisor, you can access a single and comparative view of how each agent on your team performs these key measures:
- Compared with their goals
- Compared with self over time
- Compared with their peer group
With the information in the Insights tab, supervisors can recognize good or poor performance and decide the best action required for the agent’s and team’s development and engagement.
From the Insights tab, supervisors can see performance data for an entire profile and for a specific agent associated with the selected profile.
Before you work with the information in the Insights tab, specify the profile, division, the manager, or supervisor to whom the agents report, the time interval, and the date range to obtain the list that you want to analyze. After you select the origin of the information that you want to appear in the Insights tab, see the Performance Insights area for a detailed view of the entire profile’s performance. From the agent list in the Performance Insights area, you can drill down to view performance data about a specific agent. For more information, see the following sections.
Select the origin of the performance data that you want to analyze
- To access the Insights tab, perform one of the following actions:
- Select Activity > Insights.
- Select Performance > Workspace > Employee Engagement > Insights.
- From the Profile list, select the profile with the agents that you want to analyze. For more information about profiles, see Gamification profiles overview.
- When you work with the Default profile, from the Division list select the division with the agents you want to analyze. For more information about profiles, see Divisions overview.
- From the Time Interval list, and the Compare and To fields, select the timespan of the performance data you want to analyze.
You can select any two weeks.
– This week compared with last week
– This week compared with two weeks ago
– Last week compared with two weeks ago
You can select any two months.
– This month compared with last month
– This month compared with two months ago
– Last month compared with two months agoAnalyze profile performance data
- To access the Insights tab, perform one of the following actions:
- Select Activity > Insights.
- Select Performance > Workspace > Employee Engagement > Insights.
- From the Profile list, select the profile with the agents that you want to analyze. For more information about profiles, see Gamification profiles overview.
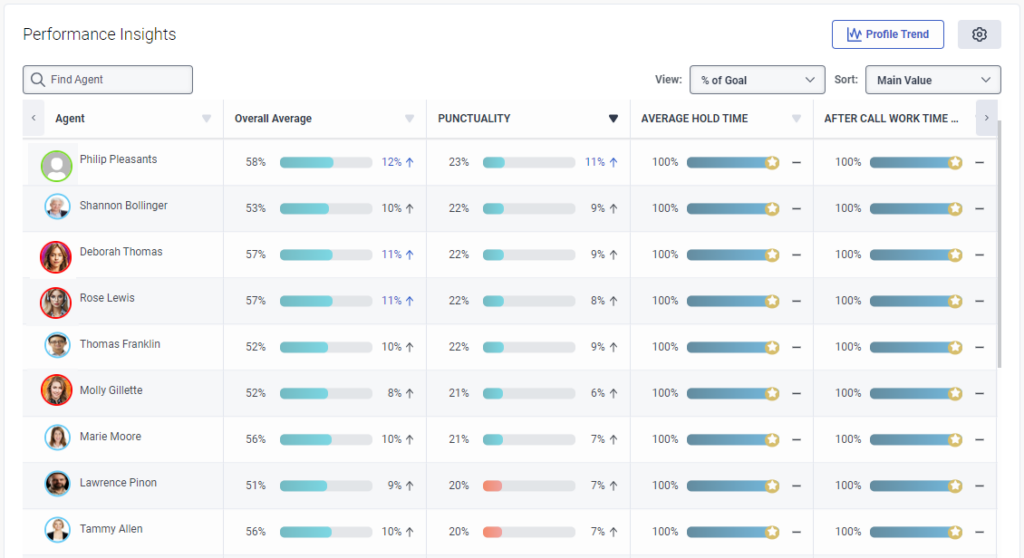
- From the View list, select how you want to view the profile data.
- % of Goal – Shows each user’s accrued points divided by the total attainable points during the selected time interval (expressed as a percentage).
- Average Value – Shows the average value of all workdays that contain data for each metric (expressed in the metric unit. For example, percentage, time, and so on).
Average Value is not applicable for the “Overall Average” column.
- From the Sort list, select how you want to sort the agents list.
- Main Value – Sorts according to the % of goal or average value.
- Improvement – Sorts according to the improvement or decline between the comparative and primary periods.
- To set the performance threshold and the data that you want to view, click the Settings icon . When you finish, click Save Settings.
Threshold Description Good % of Goal (Equal or Above) Indicates that the agent received all or more of the allocated points. A green line signifies a good threshold. Bad % of Goal (Equal or Below) Indicates that the agent received all or less than the allocated points. A red line signifies a bad threshold. Improvement % (Equal or Above) Indicates that the agent received the same or more points compared with the previous time frame. An improvement is represented by a green percentage with an arrow pointing up. Decline % (Equal or Above) Indicates that the agent received the same or fewer points compared with the previous time frame. A decline is represented by a red percentage with an arrow pointing down. Note: For example, the agent does a great job (green line) handling interactions, but also handles fewer interactions (red percentage, with a downward arrow) than in the previous time frame.
Gamification includes a set of predefined metrics that, usually, you can customize to suit your goals. The metric type determines the unit of measure used (percent, seconds, or a number).
The metrics are either built in or external. The following table lists the built-in metrics. For more information about external metrics, see Configure external metrics for performance scorecards.
Note: If your start date changed, the data in the Insights tab may only update the next day. For more information, see Activate gamification for your organization.Metric name Options Units Metric measured Overall Average The average amount of time that agents spent handling interactions compared with their maximum points. After Call Work Time Ratio Media types Queues
Percent Total After Call Work time / Total handle time Average After Call Work Media types Queues
Seconds Total After Call Work time / Count of interactions
For more information, see after contact work (ACW).Average Handle Time Media types
Queues
Seconds Total handle time / Count of interactions Average Hold Time Media types
Queues
Seconds Total hold time / Count of interactions with a hold Calls Transferred Ratio Media types Queues
Percent Total calls transferred / Total calls for a day Punctuality* N/A Seconds Seconds within range of actual activity start time Activities to measure against: - On Queue
- Break
- Meal
- Training
- Meeting
Note: The maximum number for the punctuality metric per profile is 1.
* Requires workforce management (WFM)
- To sort the agent list in ascending or descending order, click a column heading.
- Hover over a column heading to view the objectives for the specific data. For example, in the following image, the objective for Average After Call Work is between 30s and 1m. 350 points represent 100% of the objective. With this tooltip, you can quickly distinguish if the agent needs help and whether they are either rushing through their ACW or taking too long to complete it. If the agent does not meet the objective, they receive less points. For more information about objectives, see Configure gamification profile metrics.

- Hover over each value on the screen to drill down and view more detailed information.
Notes:- The presence status color of individual agent avatars reflects the Genesys Cloud color coding in real time. For more information, see Presence, status, and activity indicators overview.
- When you hover over an agent’s avatar, a pop-up card appears with the agent’s activity details and workforce management-related actions.
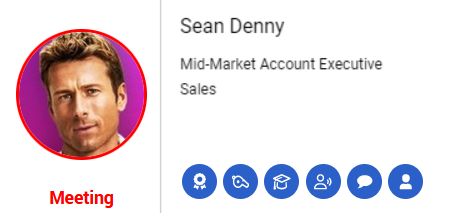
- The presence status color of individual agent avatars reflects the Genesys Cloud color coding in real time. For more information, see Presence, status, and activity indicators overview.
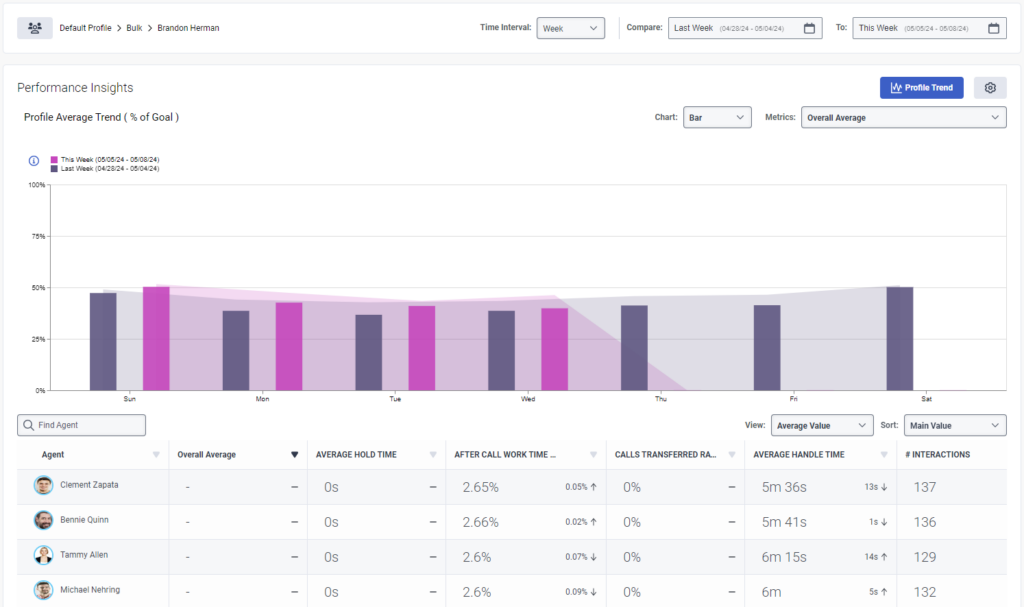
- To view a bar or line chart about how the entire profile is working regarding the selected time interval, click Profile Trend at the top of the agent list.
- From the Metrics list, you can configure the chart to show data for the selected metric.
Note: Each profile is associated with a different set of metrics. - The View drop-down lets you set whether you want to inspect data as % of Goal or Average value.
- Hover over the chart for details about the current and previous day.
- From the Metrics list, you can configure the chart to show data for the selected metric.
Compare profile with agent performance data
The Profile trend option allows you to visually compare trends for the overall profile, if you select agents under Insights. The low chroma chart in the background depicts the overall profile average of the selected metric, whereas the bars with the saturated colors represent the performance of the agent selected by the Reports to filtering.
To see comparisons for date and profile average, hover over the chart.
Click the image to enlarge.
 Note: To display the performance data only for a given date range, click the Last month or This month date range. Click the empty space to the right of the date ranges to reset the view.
Analyze agent performance data
You can drill down to a specific agent’s performance data to get a better understanding of the specific agent’s performance (that is, is the agent improving or not). This drill down also enables you to determine focus areas for the specific agent.
Notes:- To send the agent’s performance details to someone else to review, click the Shareable Link at the top of the view.
- From the Follow-up list at the top of the view, along with the information about the specific agent in the agent’s performance view, you can send recognition to the agent, create a new coaching appointment, assign a module, and send a message to the specific agent.
- To access the Insights tab, perform one of the following actions:
- Select the origin of the performance data that you want to analyze. See Select the origin of the performance data you want to analyze.
- Perform the steps in Analyze profile performance data.
- From the agent’s list that appears, click the name of the specific agent whose performance data you want to view.
Note: The Profile, Division, and Reports to fields at the top of the view indicate the profile, division, and the supervisor or manager associated with the specific agent. - From the Time Interval list, and the Compare and To fields, select the timespan of the performance data you want to analyze.
You can select any two weeks.
– This Week compared with Last Week
– This Week compared with Two Weeks ago
– Last Week compared with Two Weeks agoYou can select any two months.
– This Month compared with Last Month
– This Month compared with Two Months ago
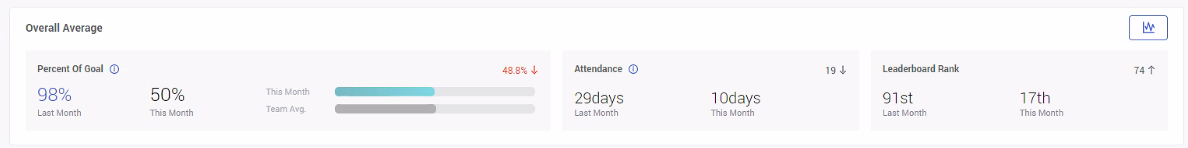
– Last Month compared with Two Months agoNote: The view saves and retains your last selection as a preference for the next time you access the Insights tab. - Review the agent’s Overall Average performance.
- Percent of Goal – Indicates what percentage of the agent completed his or her goal during the current and previous time interval. From here, you can also see the agent’s performance compared with the profile average (Team Avg).
- Leaderboard Rank – Indicates the agent’s rank compared with the agents in the profile for the current and previous time interval.
- Attendance – Indicates attendance for the current and previous time interval. This value indicates the weight of the agent’s improvement or decline.
- To open the Agents Interactions Detail view associated with the specific agent in a new browser tab, click the Interaction link in the upper right corner of the Performance Details area. For more information, see Agents Interactions Detail view.
- To view the data in the form of a bar or line graph, click the Show Graph icon
 .
. - (Optional) To view how the values were calculated, hover over the information icon
 next to Percent of Goal and Attendance.
 - From the Search Metric field, search for the metric you want to analyze for the specific agent.
- The Scorecard button navigates to the most recent scorecard of the agent.
- From the Sort by: list, choose how you want to view the metrics.
- % of Goal (low to high) – Shows the lowest to highest % of goal.
- % of Goal (high to low) – Shows the highest to lowest % of goal.
- Improvement (low to high) – Shows the largest decline in improvement to the largest increase in improvement.
- Improvement (high to low) – Shows the largest increase in improvement to the largest decline in improvement.
- Review the percent of goal, leaderboard rank, and average value for each metric associated with the specific agent.
- Click View Objective to view where the specific agent ranks compared with where the agent should be ranked.
For example, in the following number of interactions with objective views, you can see that the agent has not met the objective. The agent should have at least 80 interactions for good performance and at least 100 interactions for on target performance during the selected time interval.


For example, in the following overall average section for a specific user, you can see that the agent improved 41.35% this month compared with the previous month. You can also see that this specific agent is now the fourth best leader among the agent’s in the selected gamification profile. However, all of this data is based on four days of work, compared with the 16 days the agent worked during the previous month.
Click the image to enlarge.
![]()