
Analytics add-on real-time analytics dashboards
Analytics Add-on (A3S) real-time reporting solution is based on Kibana and Elasticsearch cloud clusters. Kibana is an open, front end application that sits on top of the Elastic Stack and provides search and data visualization capabilities for data indexed in Elasticsearch. Kibana is commonly known as the charting tool for the Elastic Stack (previously referred to as the ELK Stack after Elasticsearch, Logstash, and Kibana).
Kibana also acts as the user interface for monitoring, managing, and securing an Elastic Stack cluster, and as the centralized hub for built-in solutions developed on the Elastic Stack. Kibana’s interface allows you to query data in Elasticsearch indexes and then visualize the results through standard chart options or built-in apps like Lens, Canvas, and Maps. You can choose between different chart types, change the aggregations of numbers, and filter specific segments of data.
A3S real-time is a visualization-based solution for monitoring contact center performance in near real-time (up to 5 seconds). Genesys Cloud uses the data to create bar charts, pie charts, tables, histograms, and more. A dashboard view combines these visual elements to provide real-time analytical views.
Within the A3S real-time solution, you can:
- Create dashboards or wallboards to monitor agents, agent groups, queues, and more.
- Customize visuals to display user-defined donut, grid, key performance indicators (KPI), lists, or line charts.
- Use the standard visualization templates and dashboards included in the solution, or customize your own visualizations to quickly create dashboards based on the business requirements.
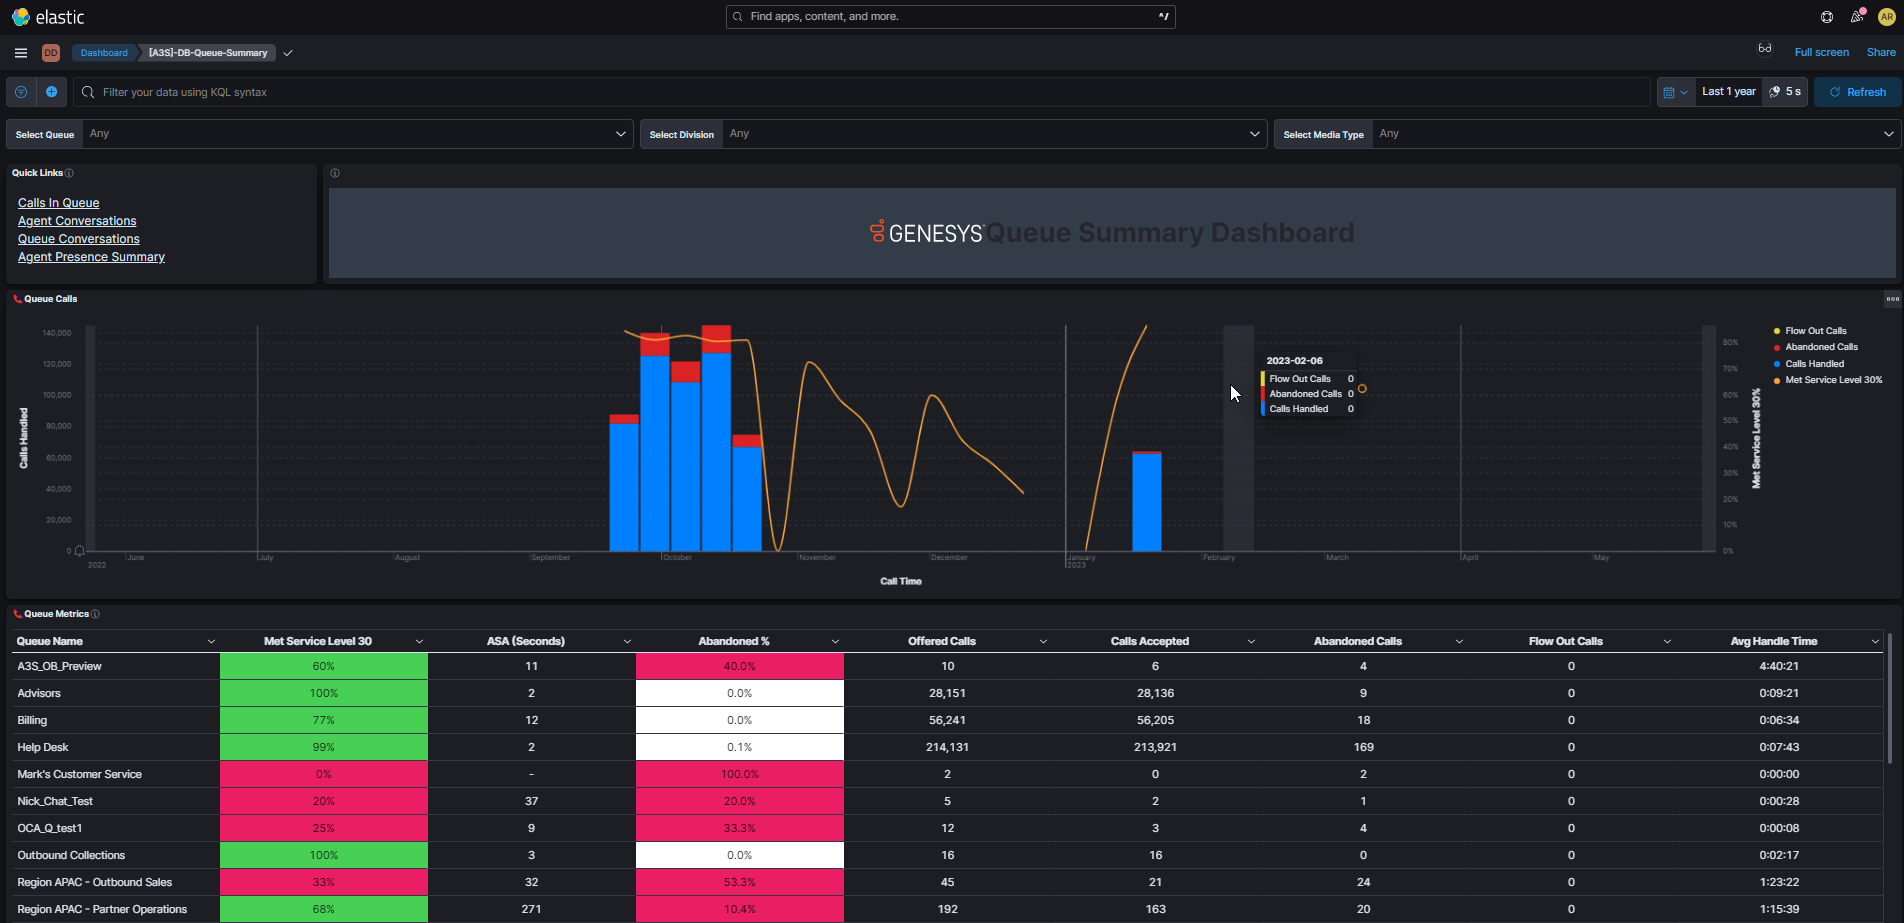
- On the left side side navigation bar, click Dashboard. The dashboard interface opens with the list of existing dashboards.
- Click Analytics > Dashboard. A list of out-of-the-box (OOTB) real-time dashboards appears.
- Select the required dashboard. For example, the Queue Summary Dashboard:
You can add multiple search filters in Kibana and reduce the number of document matches received from Elasticsearch.
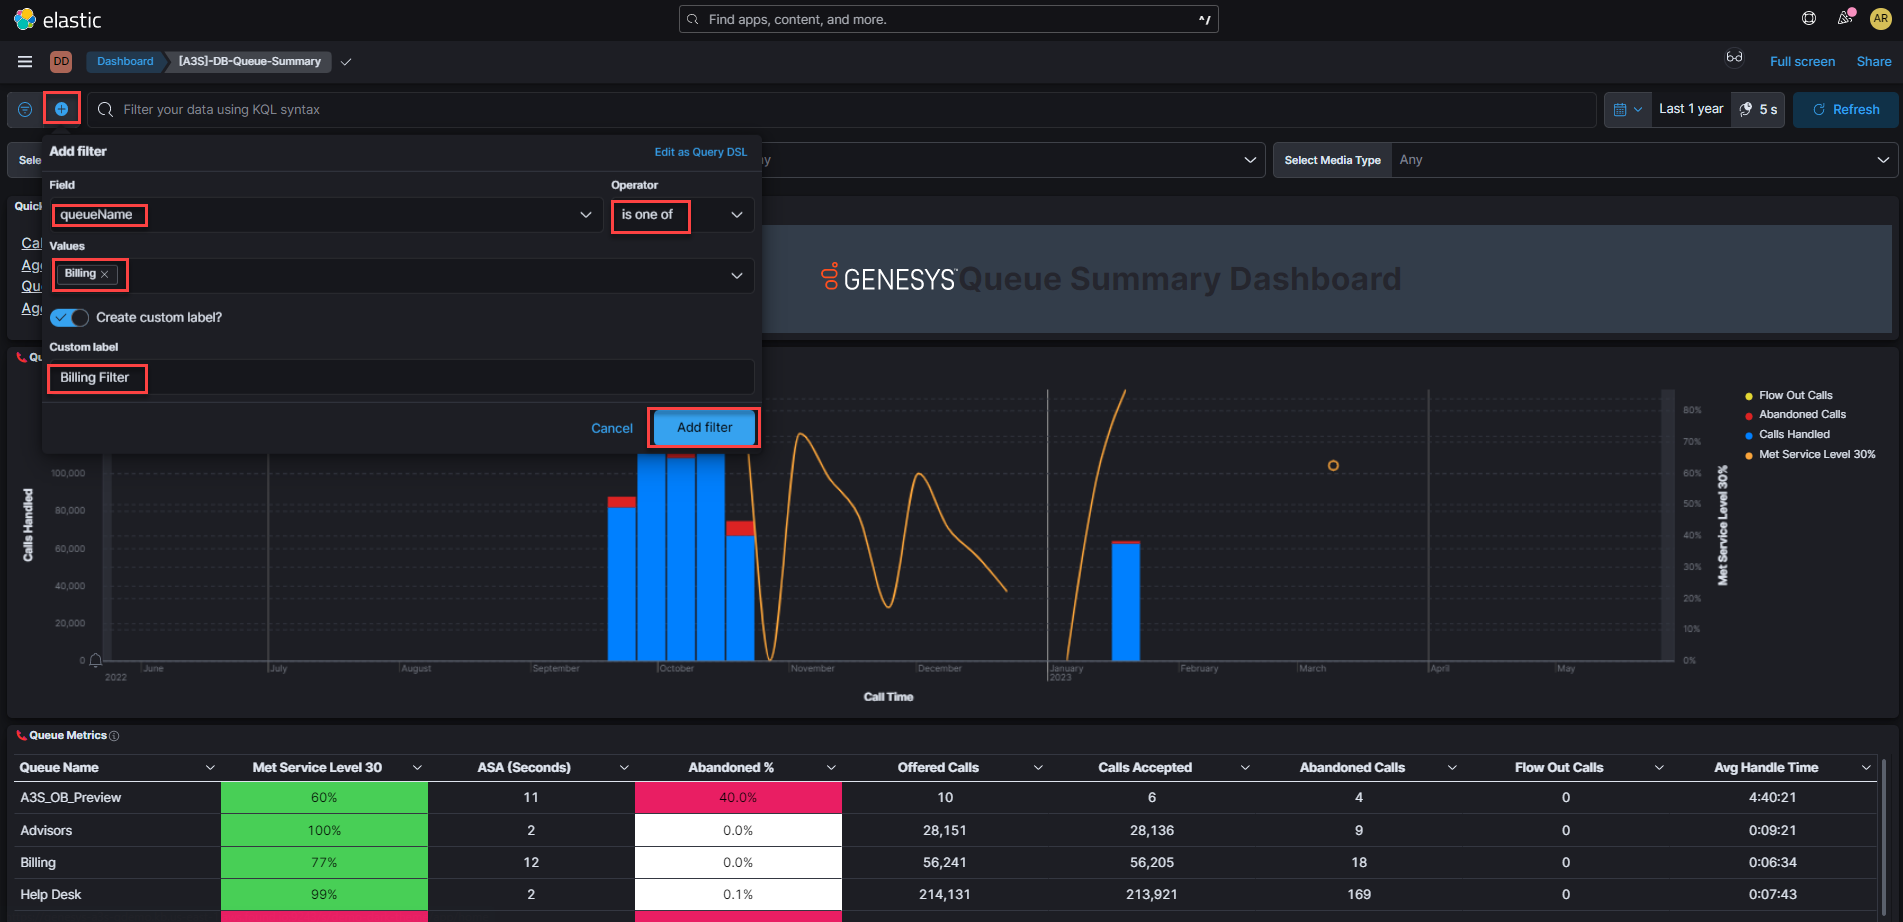
To add a filter to the dashboard:
- In the upper left corner, click
 .
. - From the Field drop-down menu, select the required field name. For example, queueName.
- From the Operator drop-down menu, select the required operator. For example, is one of.
- In the Values field, enter the required value. For example, Billing.
- In the Create custom label? field, enable the custom label.
- In the Custom label field, enter a meaningful name for the label. For example, Billing Filter.

- Click Add Filter. The filtered results appear on the dashboard.
Note: To remove a filter from the dashboard, in the upper left corner, click the icon next to the filter name.
The global time filter displays data within a specified time range when the index contains time-based events. The default time range is 15 minutes. But you can customize it.
To add a global time filter to the dashboard:
- Click Advanced Settings.
- In Quick select, set a time based on the last or next number of seconds, minutes, hours, or any other time unit.
- In Commonly used, select a time range from options such as Last 15 minutes, Today, and Week to date.
- In Recently used date ranges, use a previously selected data range.
- In Refresh every, specify an automatic refresh rate, which refreshes the dashboard.
- To set start and end times, click the bar next to the time filter. A dialog box appears.
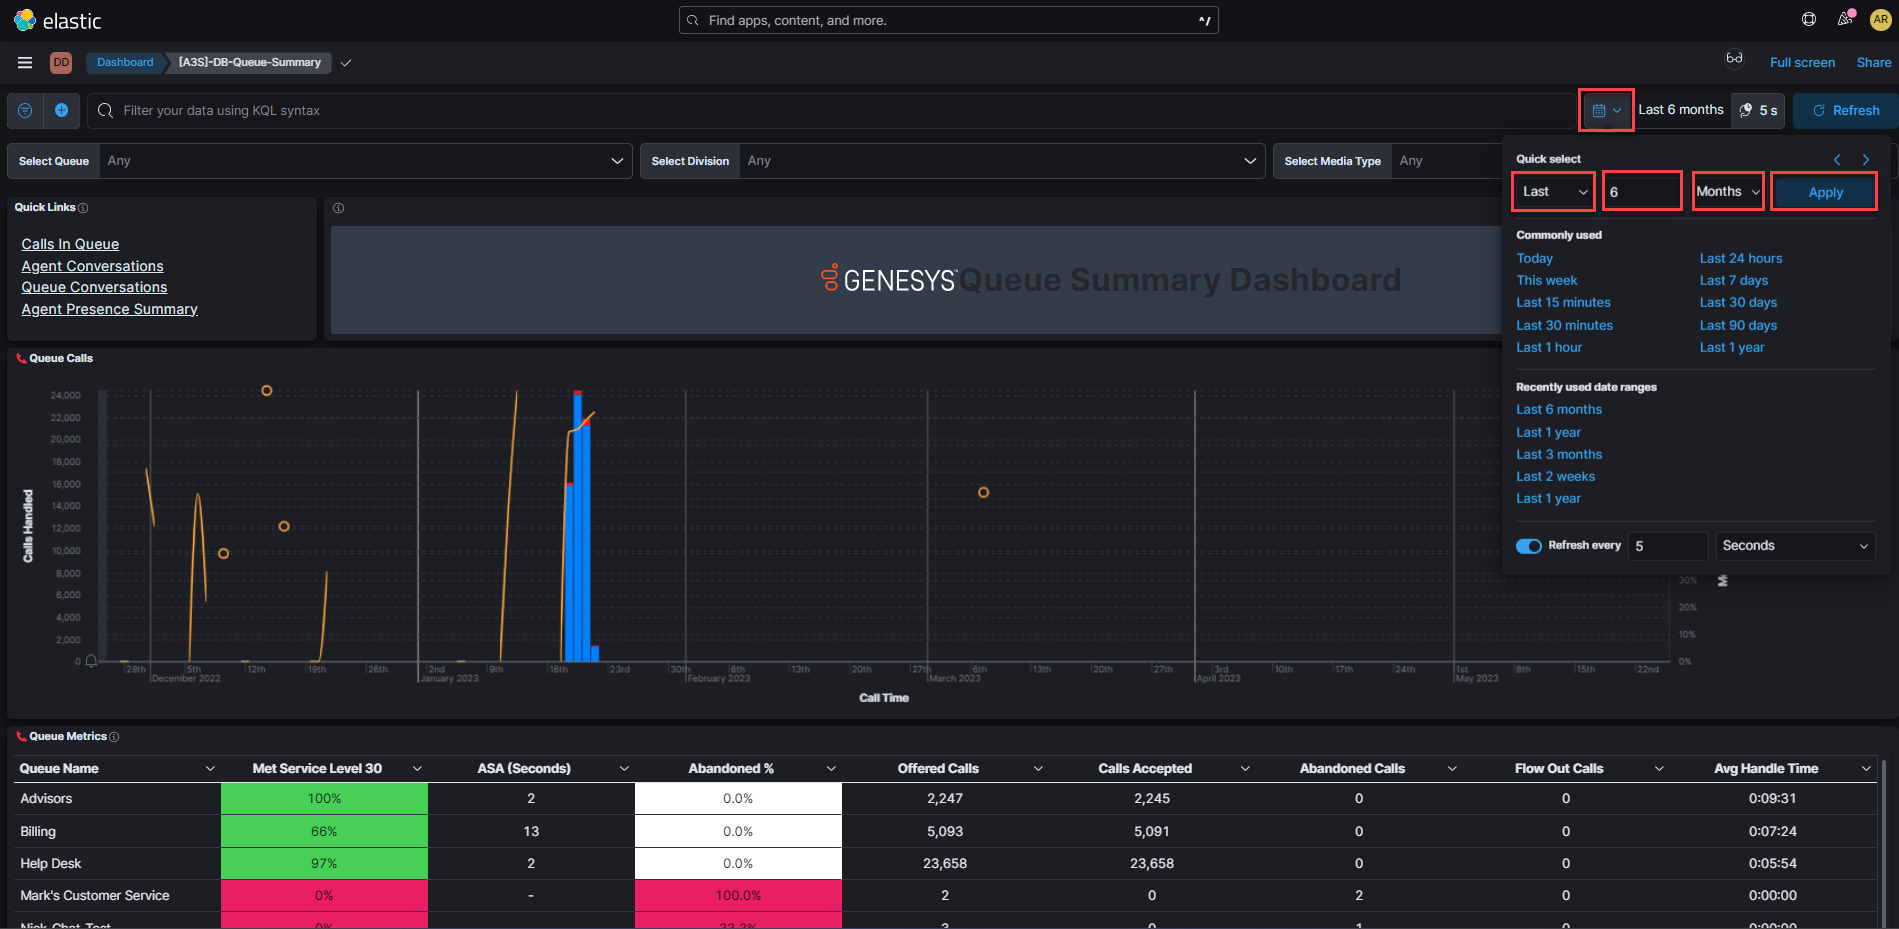
- In the dialog box, select Absolute, Relative, or Now, and specify the required options. For example, to get data for the last six months:
- In the upper-right corner, select the calendar icon.
- Under Quick select:
- Choose Last from the drop-down menu.
- Type 6
- Choose Months from the drop-down menu.

- Click Apply.
You can save the dashboard for future use or to share with others. You can also export the dashboards from Kibana.
To export a dashboard:
- In the upper-right corner, select Share.
- Select the format. The dashboard exports.