Analytics add-on historical analytics report accelerators
Analytics Add-on (A3S) includes out-of-the-box historical reporting and integration capabilities for Genesys Cloud customer’s Bring Your Own Business Intelligence (BYOBI) / Data Warehouse (DWH) as an end-to-end managed service. This solution provides a “quick start” way to understand the performance of your contact center, is built on Snowflake, and leverages Tableau or Microsoft PowerBI. You can customize these reports as required by yourself or through other PS-enabled services.
Expand the following sections for true visualization samples of the dashboard & reporting templates.
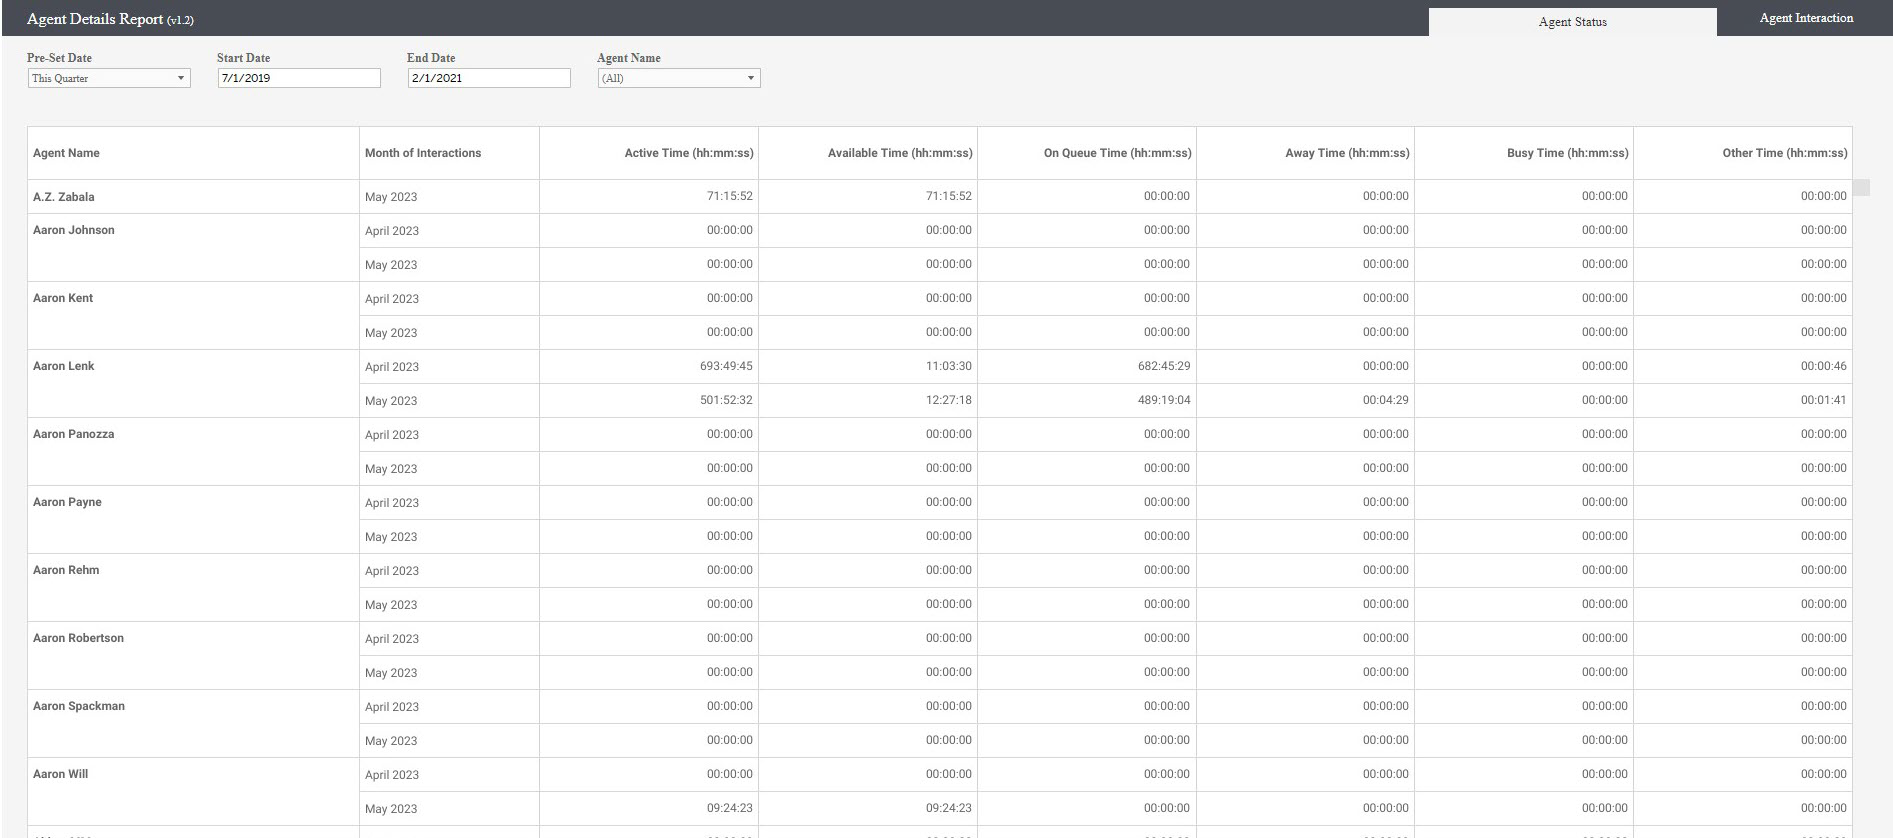
The agent status details report provides details about the list of agents and their time spent in each status. This report helps the contact center managers and supervisors to learn about the time used by each agent and helps them in utilizing the agent when not answering an interaction.
This report provides a list of KPIs including Active Time (time logged into Genesys Cloud), Available Time, On Queue Time, Away Time, Busy Time, Other Time (a grouping of other customized presence data from Genesys Cloud). You can drill down to view the list of interactions based on year, quarter, month, week, and day using the + or – button.
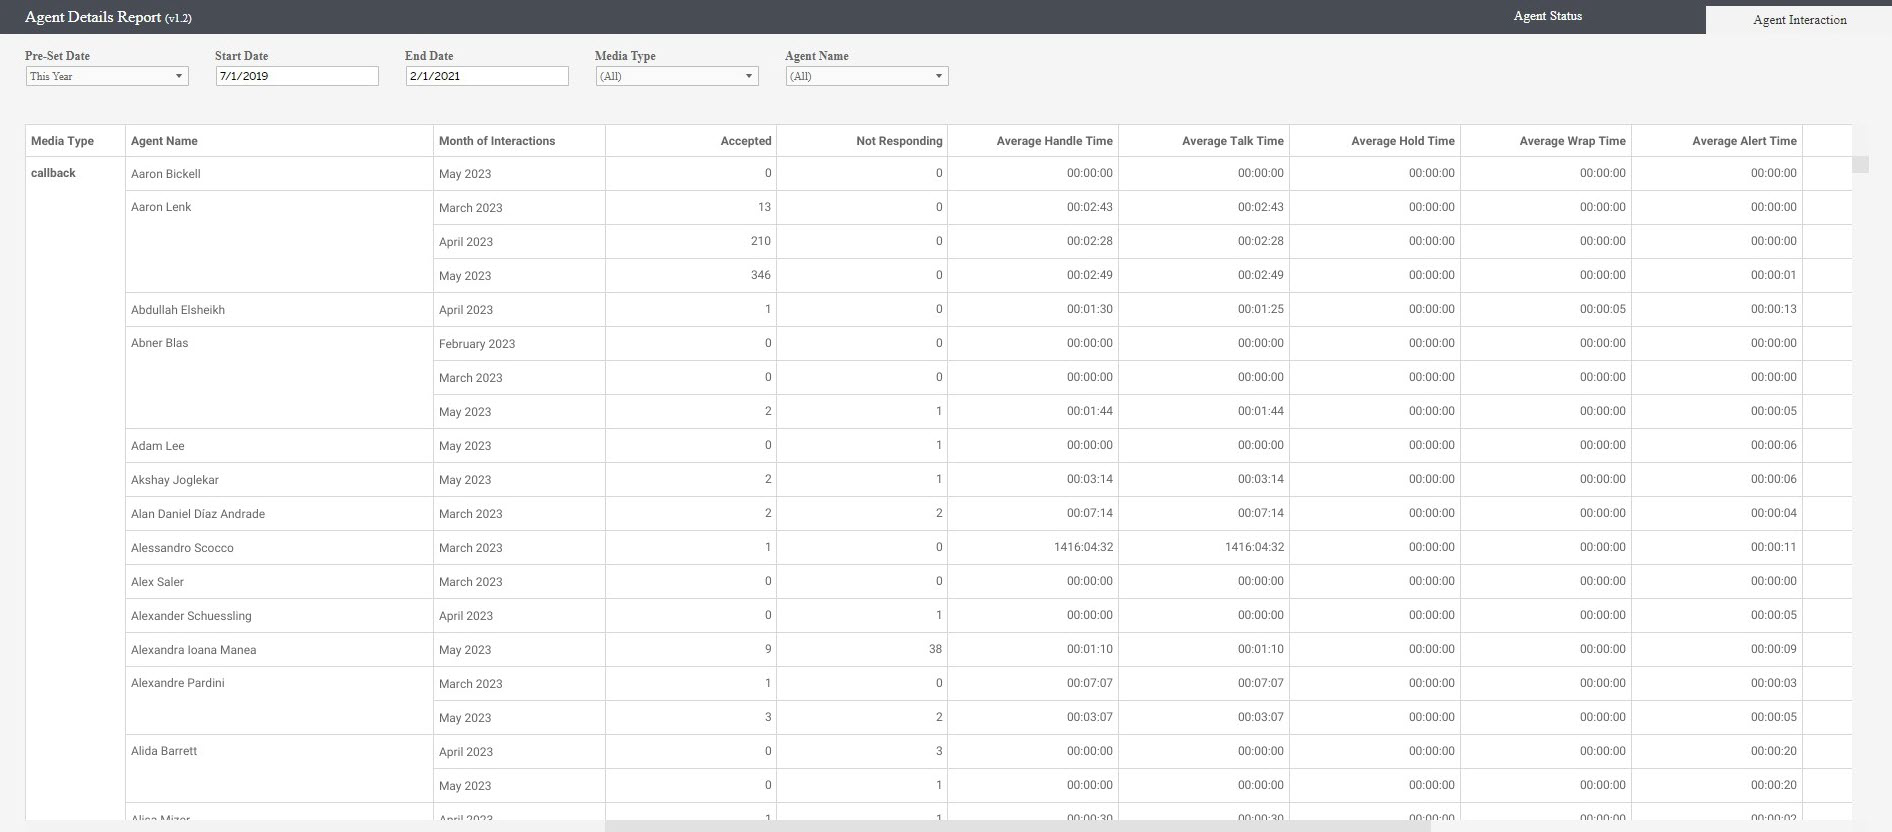
The agent interaction details report provides details about the list of interactions handled by the contact center agents based on the media type. You can drill down to view the list of interactions handled by the agent in a year in 15-minute intervals using the + or – button.
This report provides a list of KPIs including Accepted, Not Responding, Average Handle Time, Average Talk Time, Average Hold Time, Average Wrap Time, Average Alert Time, Hold, Consult, Transferred Blind, and Transferred Consult.
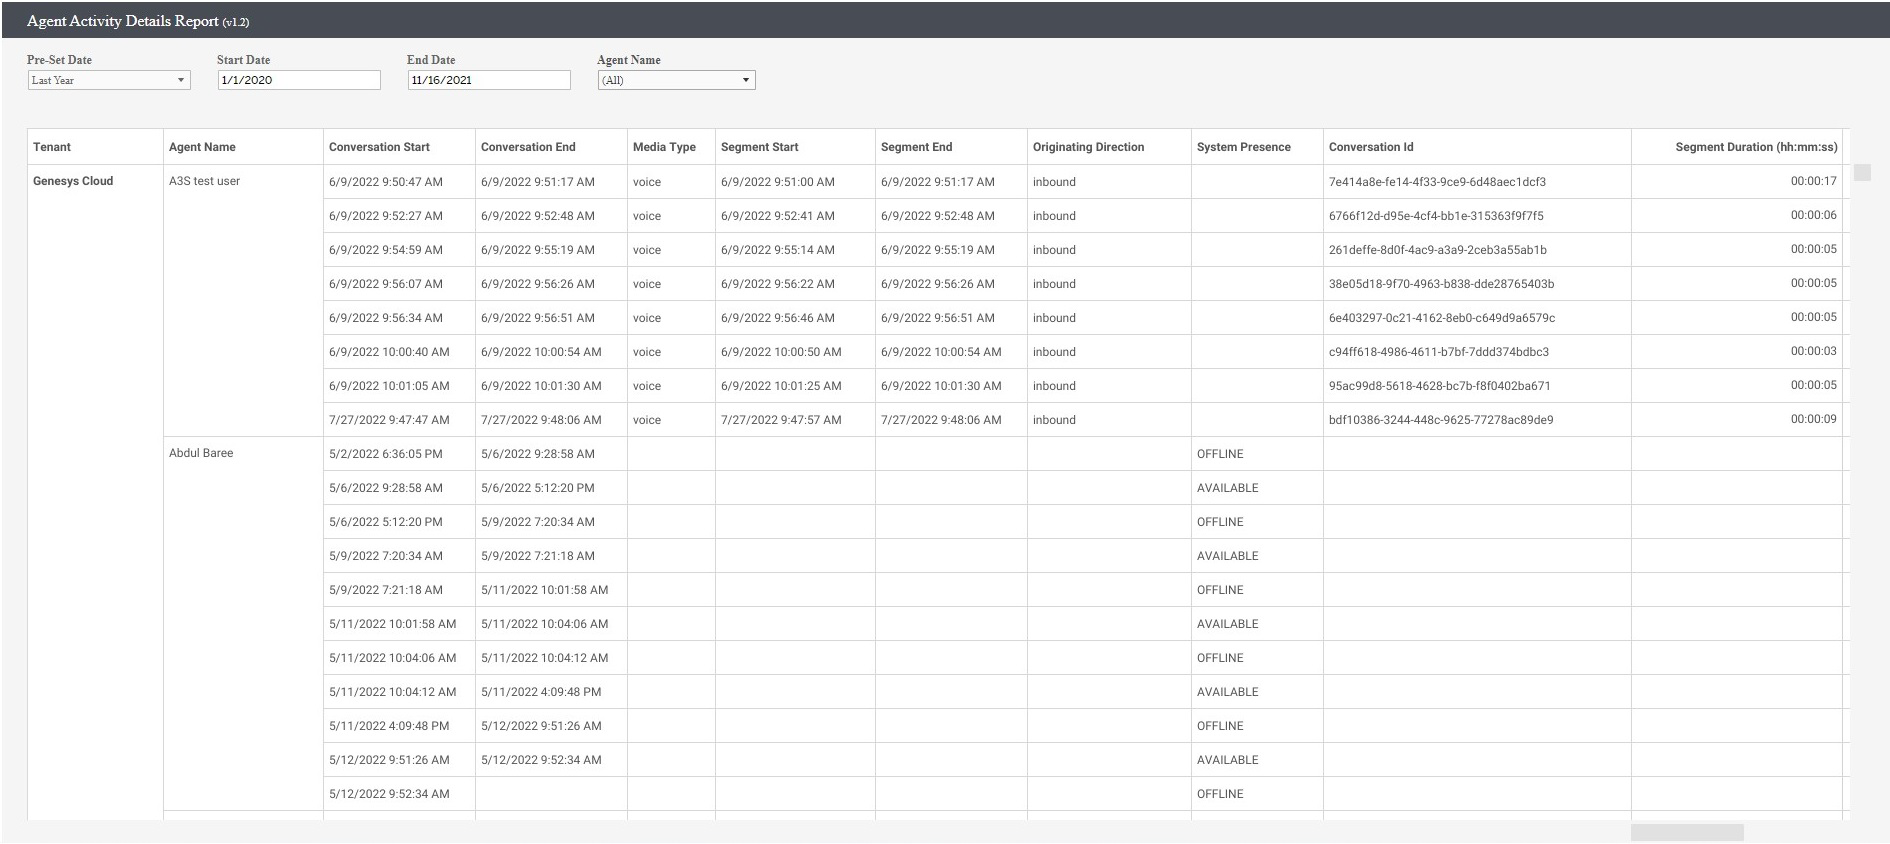
The agent activity details report provides a chronological breakdown of the activities of an agent over a time. This report provides a single view of presence data with the interactions handled. This report provides a list of KPIs including Conversation Start, Conversation End, Media Type, Segment Start, Segment End, Originating Direction, System Presence, Conversation ID, Segment Duration, and Total Duration.
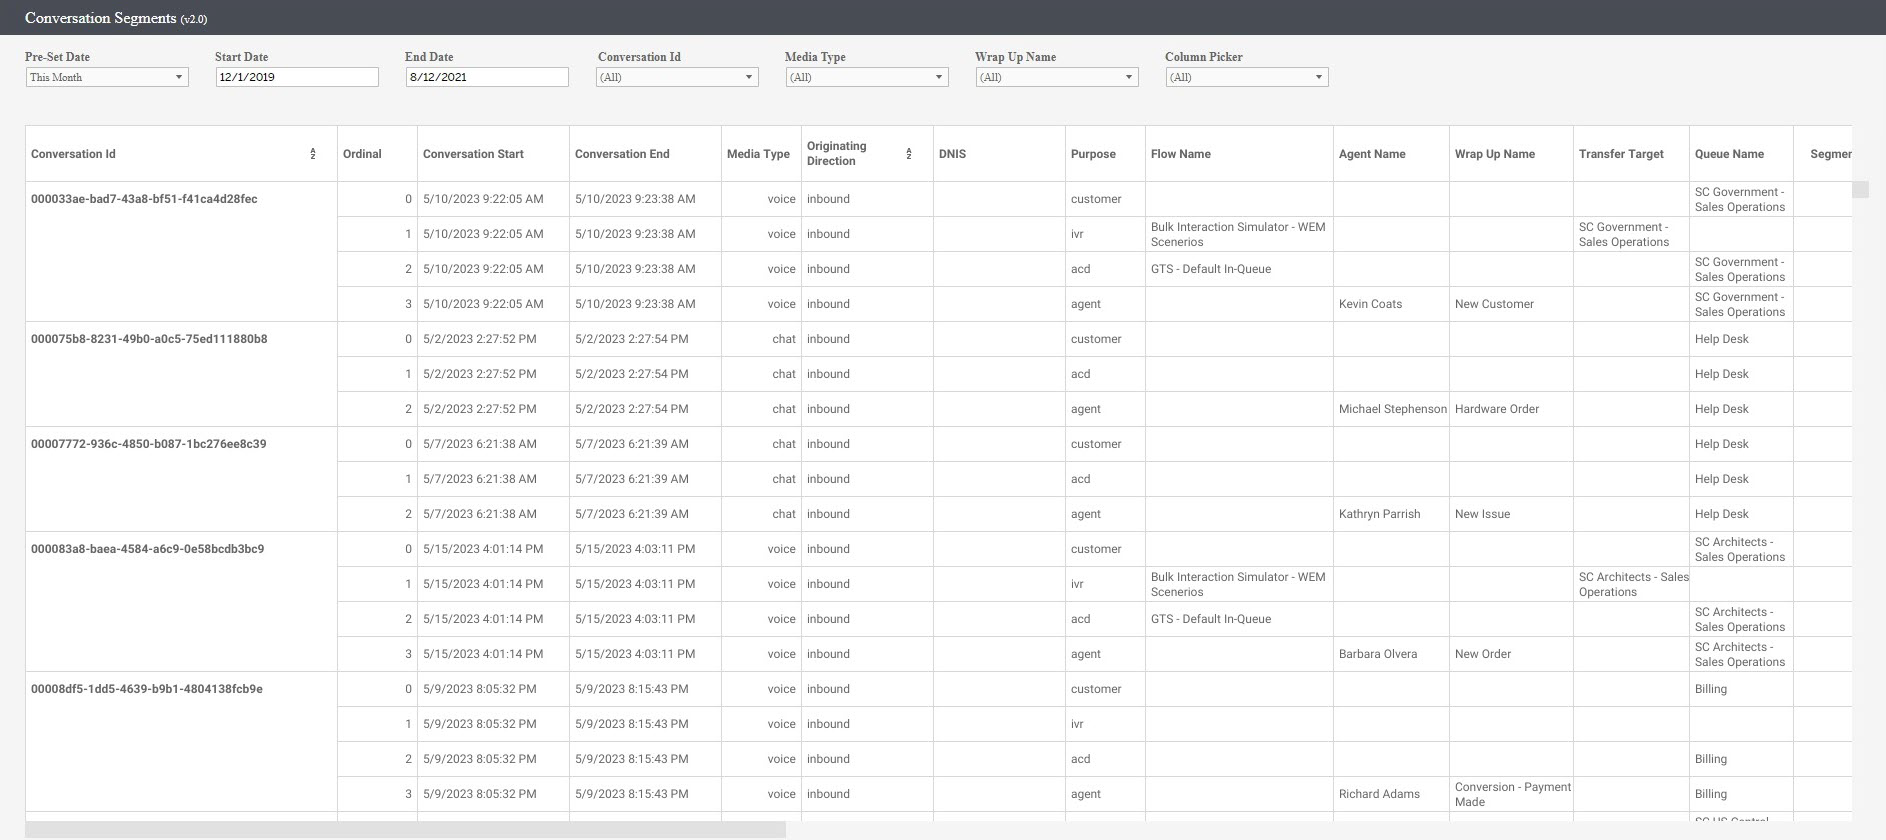
The conversation segments report provides details about the participant attributes associated with the conversation. This report is similar to the timeline view in Genesys Cloud.
Click an individual Conversation ID and drill down to view the segment data including Segment Ordinal, Session ID, Segment Type, Interact, Alert, Hold, Segment Start, Segment End, Queue Name, Wrap Up Name, and Disconnect Type.
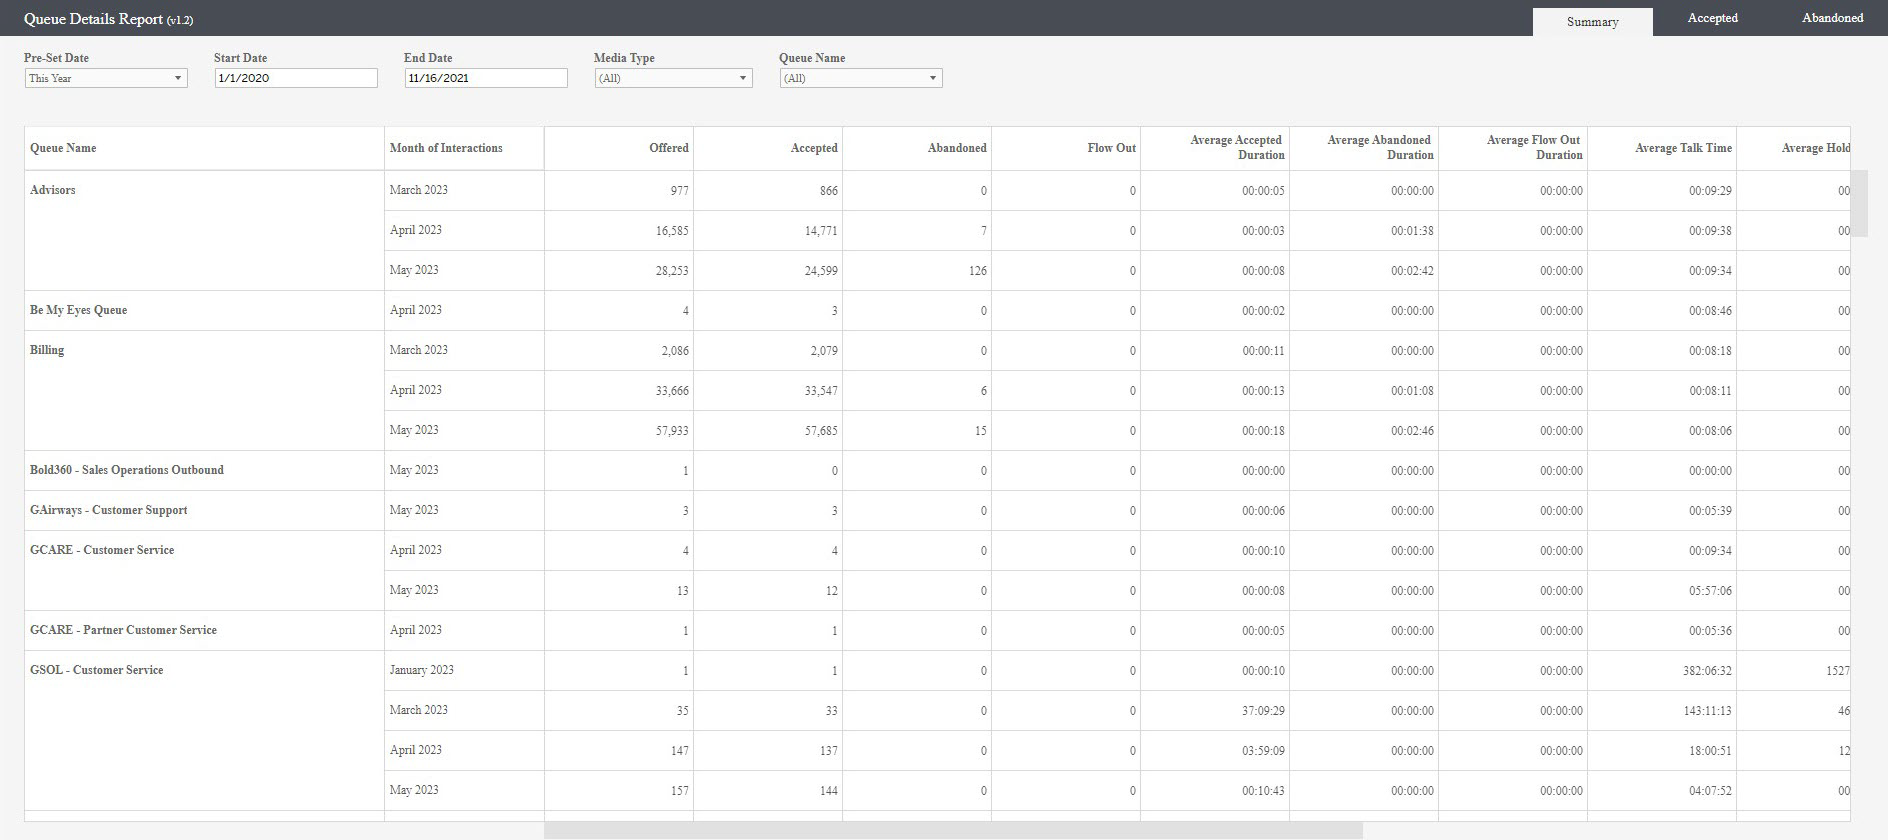
The queue details summary report provides a detailed view of each queue in the contact center. You can drill down to view the list of interactions in a year in 15-minute intervals using the + or – button. This report provides interaction details including Offered, Accepted, Abandoned, Flow Out, Average Accepted Duration, Average Abandoned Duration, Average Flow Out Duration, Average Talk Time, Average Hold Time, Average Wrap Time, Average Handle Time, Transferred, Transferred Consult, and Transferred Blind.
Use this report to evaluate the performance of configured queues, understand the percentage of accepted interactions in each queue within the defined service level, and compare how each queue handles the interactions.