
Content Exploration view
Prerequisites
Any of the following licenses:
- Genesys Cloud CX 3 Digital or Genesys Cloud EX license
- Genesys Cloud CX 1 WEM Add-on II, Genesys Cloud CX 2 WEM Add-on I, Genesys Cloud CX 3, or Genesys Cloud CX 4 license
- Speech and Text Analytics Upgrade Add-on
The following permissions are required to access Content Search:
- Routing > Transcription Settings > View
- Speech and Text Analytics > Data > View
At least one of the following permissions:
- Analytics > Conversation Detail > View
- Recording > Recording > View
- Recording > RecordingSegment > View
To search for topics:
- Speech and Text Analytics > Topic > View permission
To reconnect to a closed email:
- Conversation > Communication > reconnect permission
To enable transcript Content Search for an org:
- Transcript content search enabled
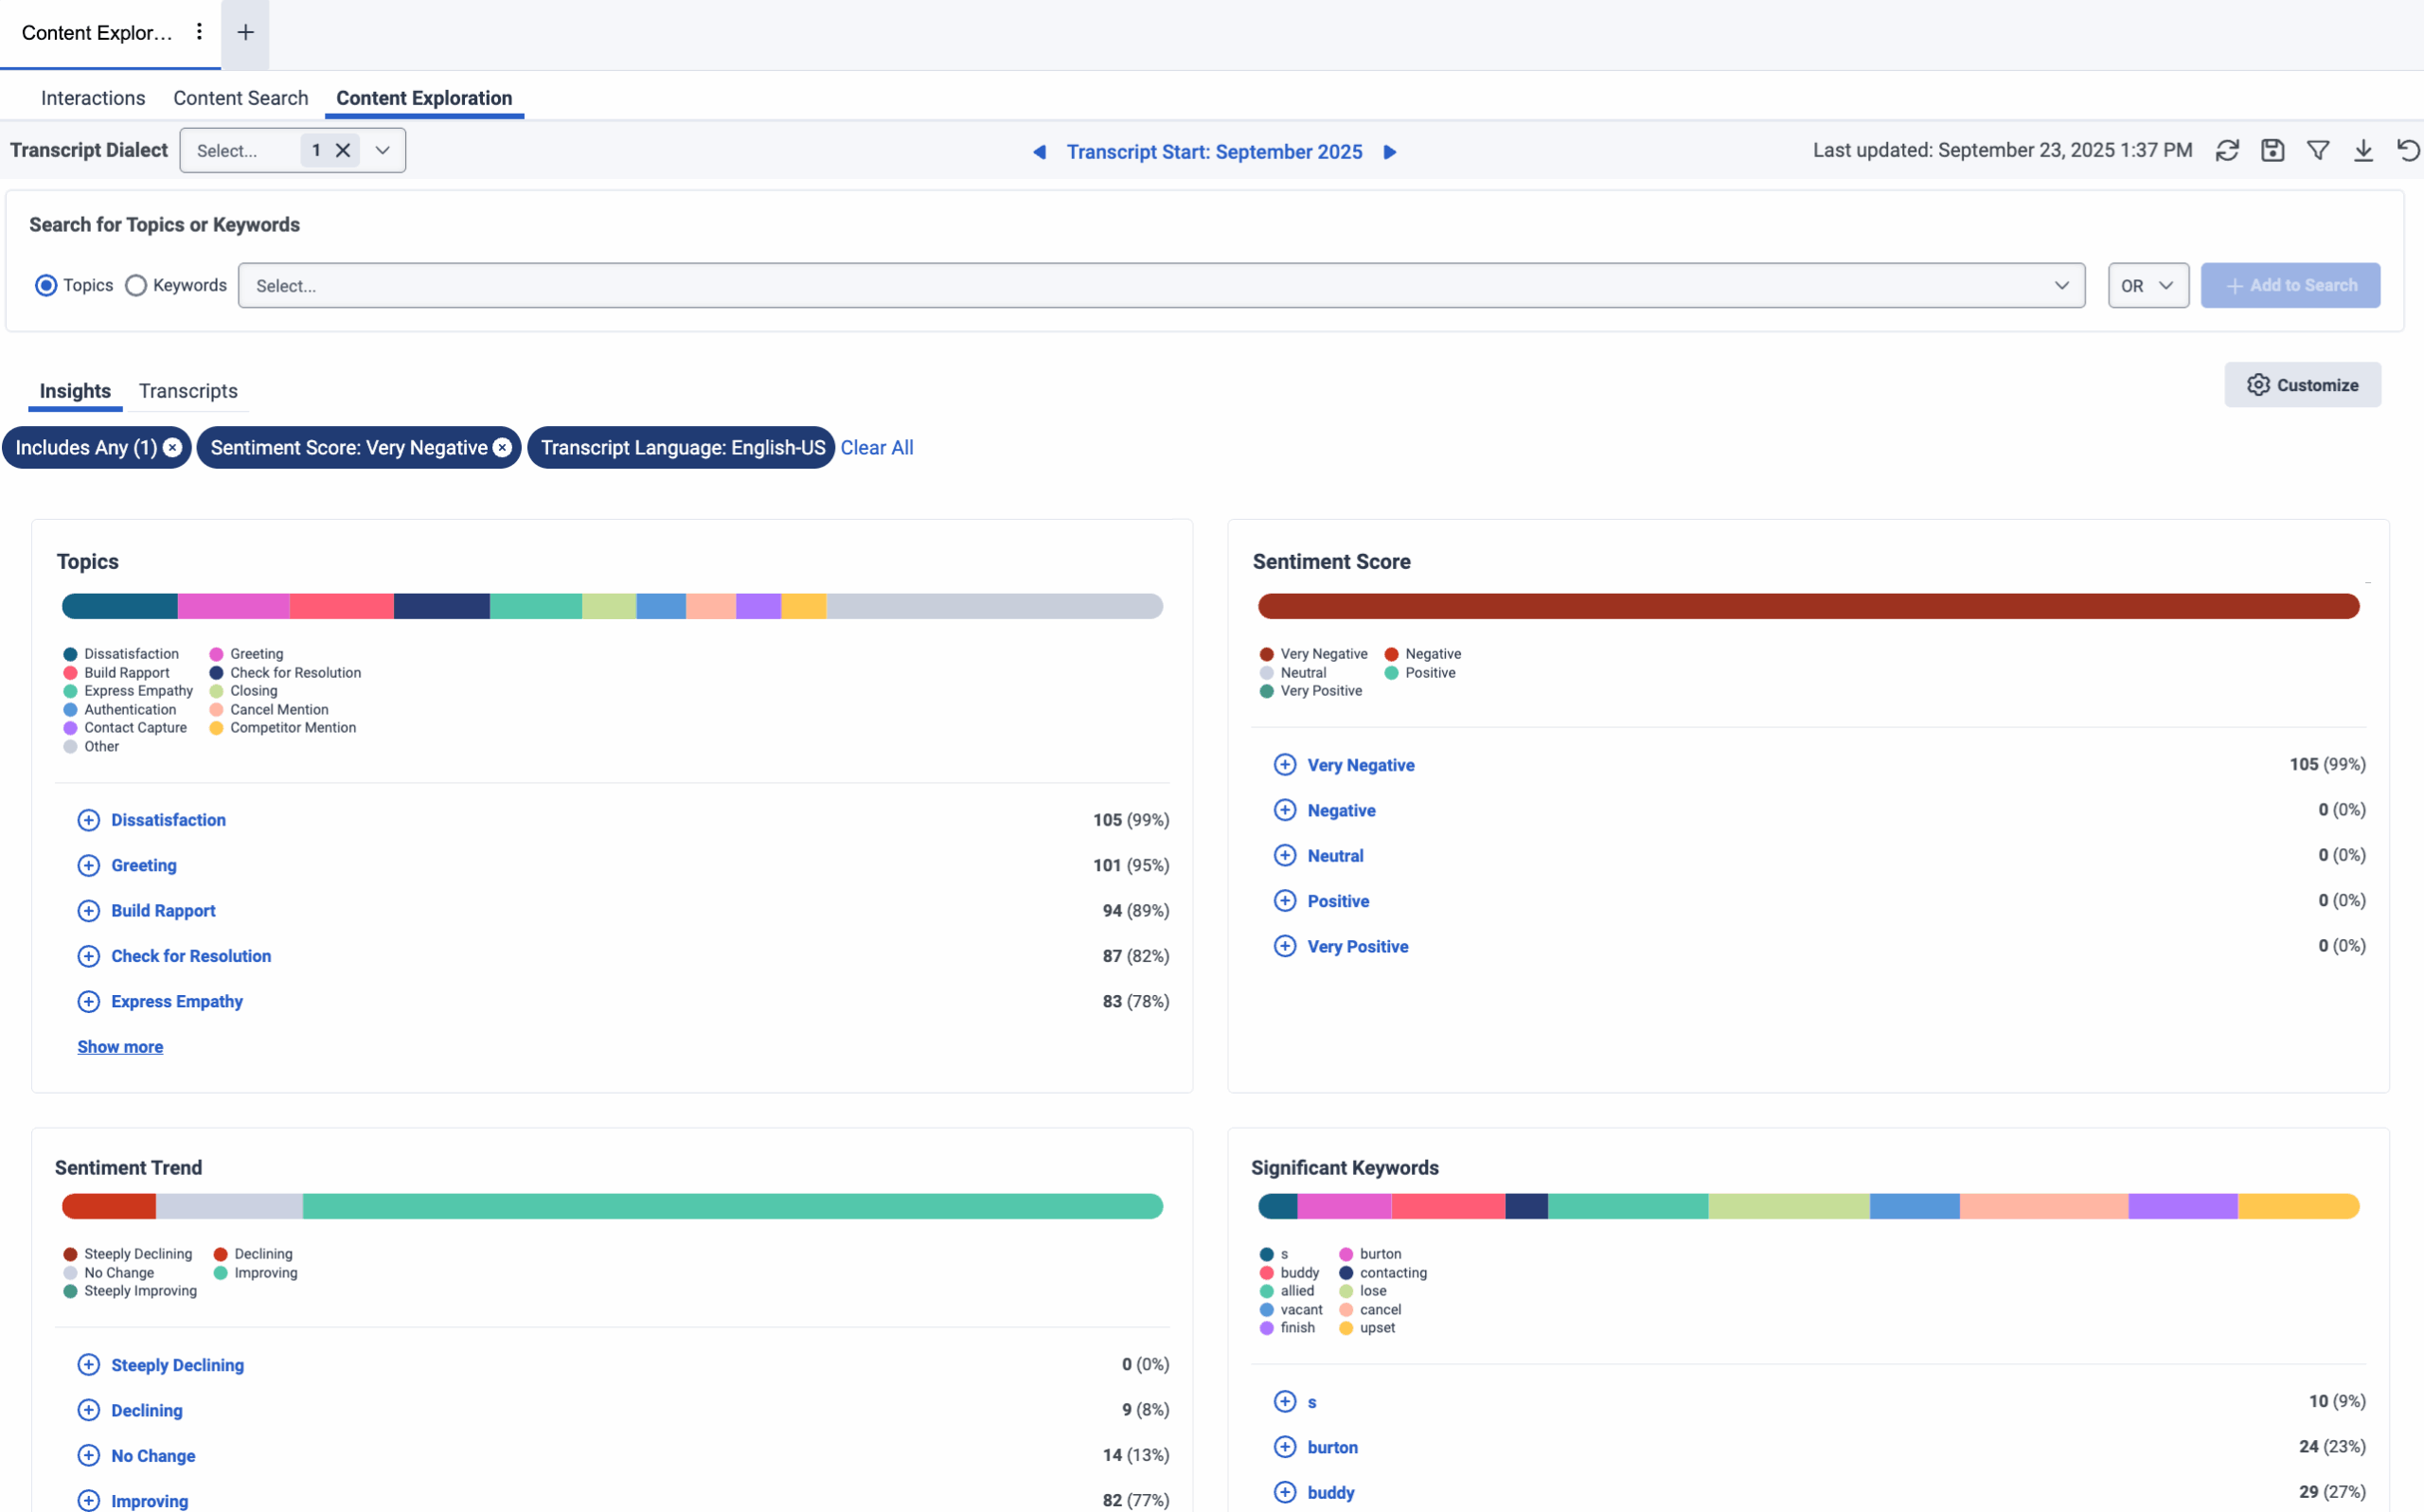
The Content Exploration view enables business analysts to visualize and explore transcript data and gain valuable insights from customer interactions. This view offers a comprehensive overview of conversation topics, empathy analysis, sentiment analysis, and trends to help understand customer engagement.
This view enables business analysts to understand what customers and agents are discussing, identify trends, and perform root cause analysis to improve customer experience, agent performance, business performance, business processes, and customer satisfaction.
To explore the content, click Performance > Workspace > Speech and Text Analytics > Content Exploration.
To explore the content, perform the following:
- Click Menu > Analytics > Analytics Workspace.
- In the Default section, search for Content Exploration and then click the view name to open it.
To see the most current data, click Refresh . To save the view with your filter and column settings, click Save .
To export the data in the view, click Toggle export panel .
Click Reset view to default to perform the following:
- Reset the customization of the cards and filters on the Insights tab.
- Reset the filters and columns on the Transcripts tab.
- Display the Insights tab if you have the Transcripts tab open.
Available columns
- To view the available columns, see the Content Exploration view section in the View available columns in performance views by category article.
- To view the consolidated list of available columns in the performance views, see Consolidated view of available columns in performance views.
- To view the list of available columns in the performance views by category, see View available columns in performance views by category.
Filter content in the Content Exploration view
- To customize analytics views, use the date filter.
- To filter metrics by date or configure a custom date range, use presets.
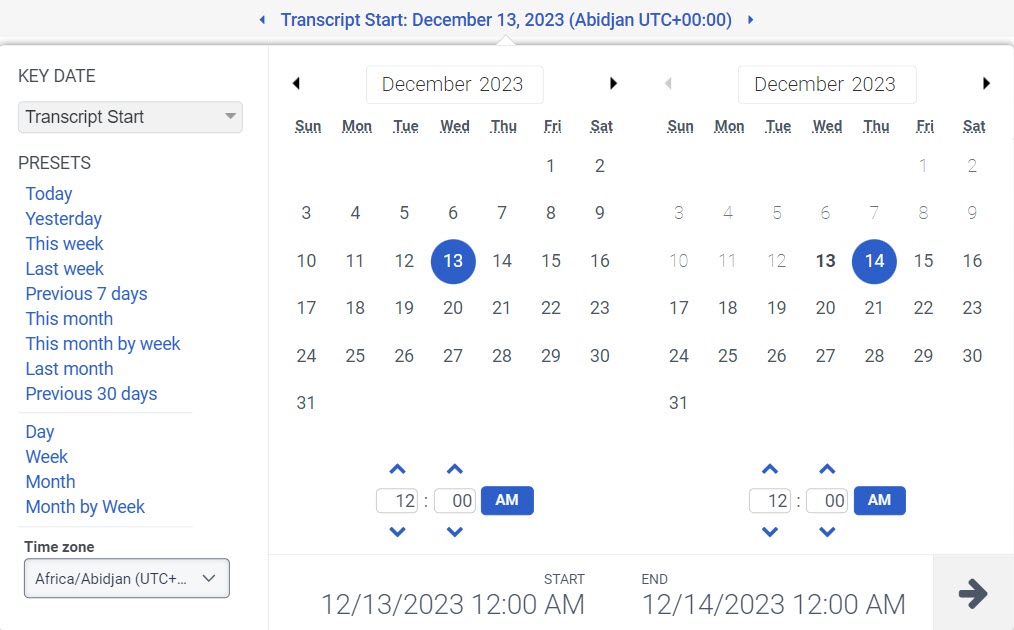
- To use a preset to filter metrics, complete the following steps:
-
- Click the date to display the date filter.
- Under KEY DATE select Transcript Start or Conversation Start.
- In the Presets list, select a preset date option.
Date presets
| Presets | Description |
|---|---|
|
Transcript Start |
Sorts the search results according to when the transcript begins. |
|
Conversation Start |
Sorts the search results according to when the conversation begins. |
| Today | Shows data for the time period that includes the current interval. |
| Yesterday | Shows data for the previous day. |
| This week | Shows data for a Sunday through Saturday time period. |
| Last week | Shows data for the previous week, Sunday through Saturday. |
| Previous 7 days | Shows data for the previous seven days. |
| This month | Shows data for the current month, with no extra days. |
| This month by week | Shows data for the current calendar month starting on Sunday and ending on Saturday, including extra days if the month does not start on Sunday or end on Saturday. |
| Last month | Shows data for the previous calendar month with no extra days. |
| Previous 30 days | Shows data for the previous 30 days. |
| Day | Shows data for a single 24-hour day. |
| Week | Shows data for a Sunday through Saturday time period. |
| Month | Shows data for the exact month with no extra days. If the current month is selected, you will see the data up to the current date. |
| Month by Week | Shows data for a calendar month starting on Sunday and ending on Saturday, including extra days if the month does not start on Sunday or end on Saturday. |
- To use a custom date range to filter metrics, complete the following steps:
-
- Click the date to display the date filter.
- Select a start date and an end date on the calendar, and click the filter arrow .
- To view data for a different time period using the same date presets, click the arrows on either side of the date display. For example, to view data for the previous day, click the Day preset, and then click the arrow on the left side of the date.
- To view data for a different time zone using the same date presets, from the Time zone drop-down menu, select the required time zone. You can create and save reports with the same selected time zone.
To filter interactions for transcripts in the selected language, click the Transcript Dialect drop-down and choose the required transcript dialect.
Use the search bar to find specific topics or keywords within your transcripts. Then add a topic or keyword and apply Add to Search to update the data and show correlated insights to uncover trends. The trends can include topics that appear together, the keywords trending when customer sentiment is negative, and the top keywords spoken in a queue.
To filter interactions that contain specific topics in a transcript, perform the following:
- In the Search for Topics or Keywords section, select Topics.
- In the search bar, select the required topic.
- Choose one of the following operators: OR, AND, or NOT.
- Click Add to Search.
- By default, the OR operator is enabled.
- The AND, OR, and NOT operators are applied to the topics or keywords of the same group. For example, Topic A AND Topic B.
- Different groups are always ANDed. For example, (Topic A OR Topic B) AND (Keyword 1 AND Keyword 2) AND (NOT Topic C AND NOT Topic D).
- If a group is created using the NOT operator, the group members are negated and ANDed. For example, consider a topic filter with NOT group G that includes three topics: topic A, topic B, and topic C. The view shows data that does not relate to topic A, topic B, and topic C. That is, NOT A AND NOT B AND NOT C.
To filter interactions that contain specific keywords in a transcript, perform the following:
- In the Search for Topics or Keywords section, select Keywords.
- In the search bar, enter the required word or words.
- Choose one of the following keyword match types:
- Exact Match: Filter the interactions with the exact word or phrase.
- Similar To: Filter the interactions with the word or phrase similar to the searched keyword.
Note: By default, the Exact match option is enabled.
- Choose one of the following operators: OR, AND, or NOT.
- Click Add to Search.
- By default, the OR operator is enabled.
- The AND, OR, and NOT operators are applied at the same level.
- If a group is created using the NOT operator, the group members are negated and ANDed. For example, consider a keyword filter with NOT group G that includes three keywords: keyword A, keyword B, and keyword C. The view shows data that does not relate to keyword A, keyword B, and keyword C. That is, NOT A AND NOT B AND NOT C.
- You can search up to 1000 interaction records.
- You can search for words or phrases in transcripts for up to 90 days from the date of the interaction or search for topics and sentiment scores for up to 1.5 years from the date of the interaction. As the date range selector in the UI is still limited to 30 days, you must review your search results 30 days at a time.
To apply the filters to the interactions of interest:
- Click Toggle filters panel .
- Select the required filter that you want to use.
Content exploration filters
| Filter | Description |
|
Topics |
Filters interactions associated with the selected topic. |
|
Significant Keywords |
Filters interactions associated with the selected keyword. |
|
Queues |
Displays the top 10 queues. Filters interactions associated with the selected queue. |
| Divisions | Displays the top 10 divisions. Filters interactions associated with the selected division. |
|
Media Types |
Filters interactions associated with the selected media types, including Email, Voice, and Message. |
|
Flows |
Displays the top 10 flows. Filters interactions associated with the selected IVR flows. |
|
Sentiment Trend |
Filter interactions based on the customer’s overall sentiment, ranging from -100 to +100. The sentiment trend categories are:
|
|
Empathy Score |
Filter interactions based on the agent’s overall empathy score, ranging from -100 to +100. The empathy score categories are:
|
|
Sentiment Score |
Filter interactions based on the customer’s overall sentiment, ranging from -100 to +100. The sentiment score categories are:
|
Tabs in the Content Exploration view
The Insights tab is open by default and provides a high-level overview of your contact center interactions through the following widgets:
- Topics
- Sentiment Score
- Sentiment Trend
- Significant Keywords
- Empathy Score
Topics
The topics widget displays the percentage distribution of the top five most common topics detected in your interactions.
Sentiment Score
The sentiment score widget analyzes the emotional tone of conversations and displays interactions based on the customer’s overall sentiment score, ranging from -100 to +100. This score weighs all positive and negative markers throughout the interaction. To highlight the customer parting experience with the contact center, more weight is awarded to events that takes place toward the end of the interaction. The analyst can use the sentiment score to drill down into interactions of interest.
The sentiment score categories are:
- Very Negative (-20 to -100)
- Negative (-1 to -19)
- Neutral (-0.9 to +0.9)
- Positive (+1 to +19)
- Very Positive (+20 to +100)
Click any sentiment category to filter conversations by that sentiment level.
Sentiment Trend
The sentiment trend widget displays trends of interactions based on the customer’s overall sentiment score, ranging from -100 to +100. This score weighs all positive and negative markers throughout the interaction. To highlight the customer parting experience with the contact center, more weight is awarded to events that took place toward the end of the interaction. This widget is used to identify if customer satisfaction is improving or deteriorating during interactions.
The sentiment trend categories are:
- Steeply Declining (-21 to -54)
- Declining (-55 to -100)
- No Change (-20 to +20)
- Improving (+55 to +100)
- Steeply Improving (+21 to +54)
Significant Keywords
The significant keyword widget displays statistically significant terms that appear in your transcripts and the trend of the top five keywords found in the interactions. This widget helps identify common terms that indicate trends or issues.
Empathy Score
The empathy score widget measures agent empathy levels during interactions and displays interactions based on the agent’s overall empathy score, ranging from -100 to +100. This score gauges an agent’s level of empathy and emotional intelligence during customer interactions. This score reflects the agent’s ability to understand and relate to the customer’s emotions and concerns. For more information about agent empathy analysis, see About agent empathy analysis.
The empathy score categories are:
- Unhelpful (-1 to -100)
- Neutral (-0.9 to +0.9)
- Empathetic (+1 to +100)
This widget helps assess how well agents are responding to customer needs.
Customize insights
Customize the insights tab by adding or removing widgets.
To customize the Insights tab, perform the following:
- On the right side of the Insights tab, click Customize.
- Select or unselect the required widgets, including Topics, Sentiment Score, Sentiment Trend, Significant Keywords, and Empathy Score.
The Content Exploration transcript tab displays a list of transcripts that match your applied filters.
Click the required user to view the transcript details in the interactions detail view page. For more information about transcripts, see Work with a voice transcript.
To show or hide columns:
- At the top right corner of the columns, click the Pick columns icon. The Add/Remove Column pane appears.
- Click the Manage columns tab.
- (Optional) To sort the columns in ascending or alphabetical order, click Sort by > Column Name A-Z.
- (Optional) To sort the columns in descending or reverse alphabetical order, click Sort by > Column Name Z-A.
- (Optional) To categorize or uncategorize the columns, click Sort by and enable or disable the Group by Categories toggle.
- Search or scroll to select the columns you want to view. Note: You can also use keyboard navigation to choose the columns.
- Click Save. The selected columns appear on the screen. Note: The column selections appear only after saving the changes and do not apply to the table immediately.
To reorder the columns within the column picker:
- At the top right corner of the columns, click the Pick columns icon. The Add/Remove Column pane (column picker) appears.
- Click the Reorder columns tab.
- Click the grid icon
 of a column, and then drag and drop to reorder it within the column picker.
- Click to select the grid icon of the column to be reordered, and on the keyboard, press the Spacebar.
- To position the column, use the Up or Down arrow keys.
- Press the Spacebar. The chosen column is reordered.
To rearrange the columns outside the column picker, click a column header and drag it.
To reset a view to default column settings, click Reset view to defaults .
You can select up to 20 columns.