
Optimize customer journeys proactively
Genesys Cloud offers an extended set of capabilities that you can use to gain insights into your customer journeys. These tools help you with the following:
- Allows you to gain a comprehensive, multichannel view of your customer journeys.
- Enables you to track, analyze, and optimize every step of the customer experience.
- Provides dynamic visualizations and heat maps that reveal customer engagement levels across Architect flow components.
- Allows for immediate insights into high-traffic areas and interactions.
With both granular and high-level views, you can use Flow Insights, Journey Flows and Replay Mode to dive into specific Architect flow components and perform the following:
- Measure flow performance.
- Monitor key flow milestone frequencies.
- Understand how customers progress toward desired flow outcomes.
- Visualize pathways customers take, capturing both successful and challenging routes.
Use Journey Management to extend your view beyond single-channel Architect flows with 365 days of cross-channel data and do the following:
- Perform trend and funnel analysis.
- Track journey performance over time.
- Quickly identify shifts in your journey metrics.
- Identify friction points in multichannel transitions.
- Refine customer experiences.
- Improve customer satisfaction across touchpoints.
Gain powerful insights into your customer journeys with Flow Insights:
Key benefits at a glance
Key use cases in detail
Actionable insight
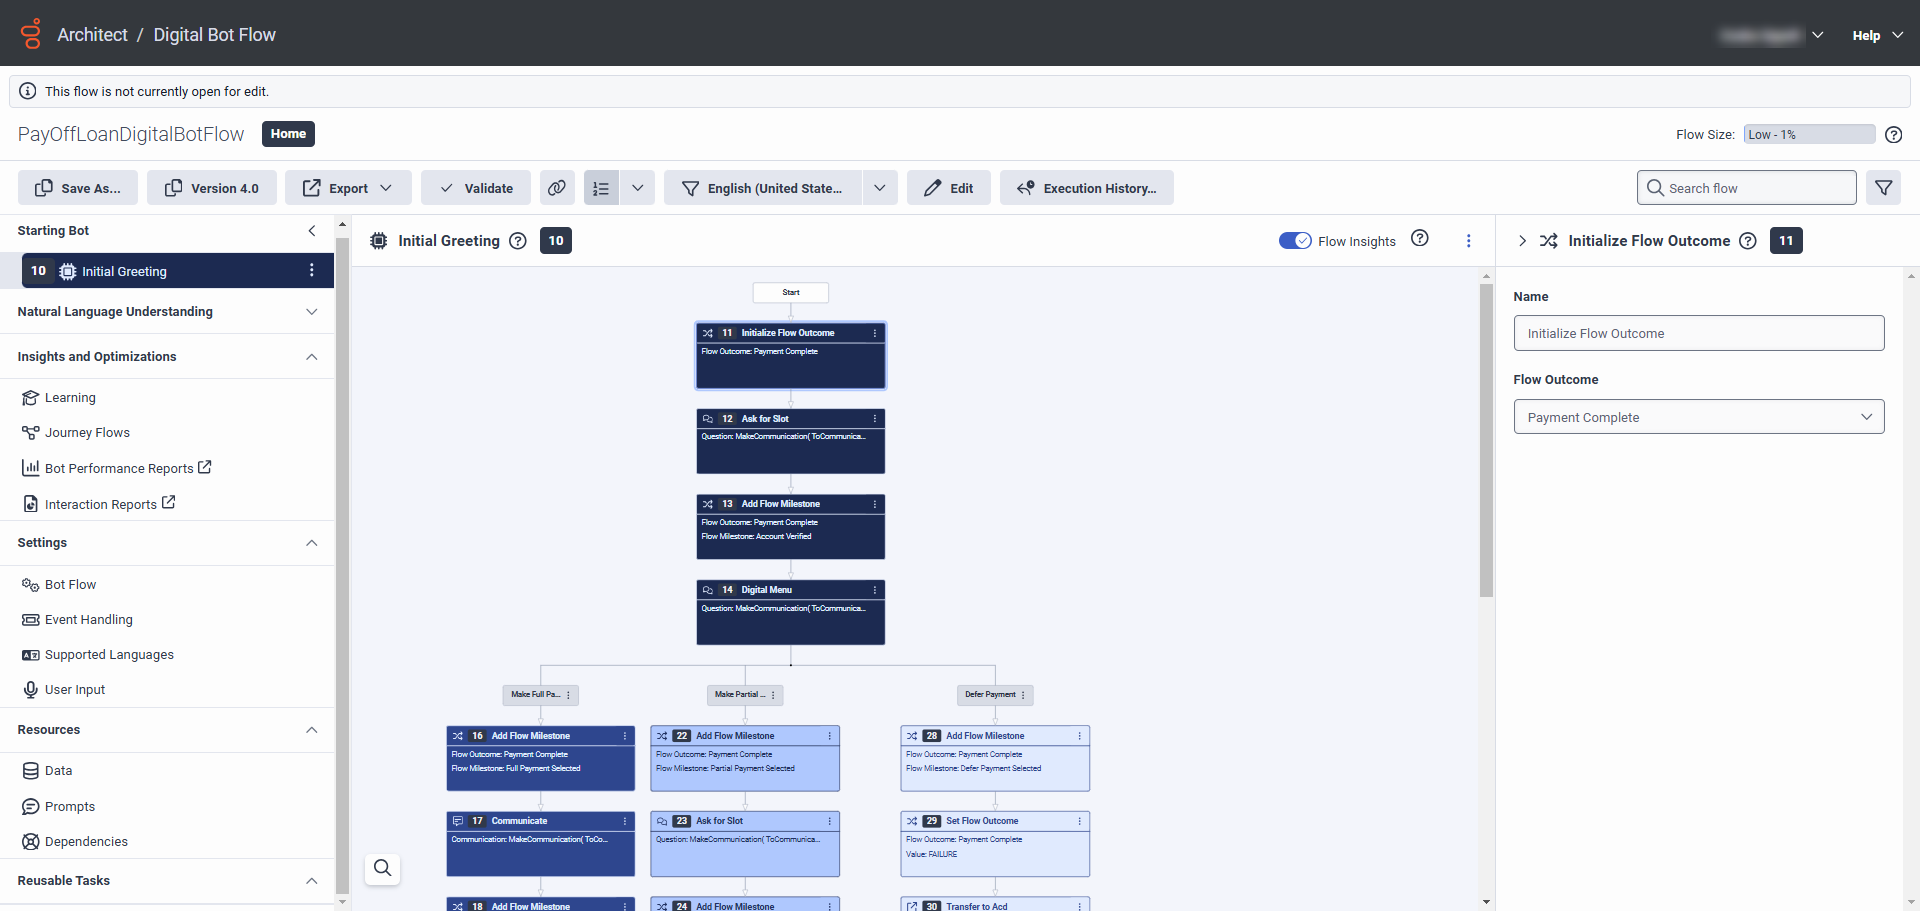
- From the Architect home page, click or hover over the Flows menu and select the desired flow type.
- Click the flow that you want to analyze.
- Use the Flow Insights toggle to display the interaction heat map for the flow. Note: There must be interaction data from the past seven days for the heat map to appear.
- Look for flow components with high frequency (interaction count) levels and check if customers are dropping off in subsequent steps. In the following example, customers make it to the Digital Menu action in a digital bot flow, but fail to progress further:
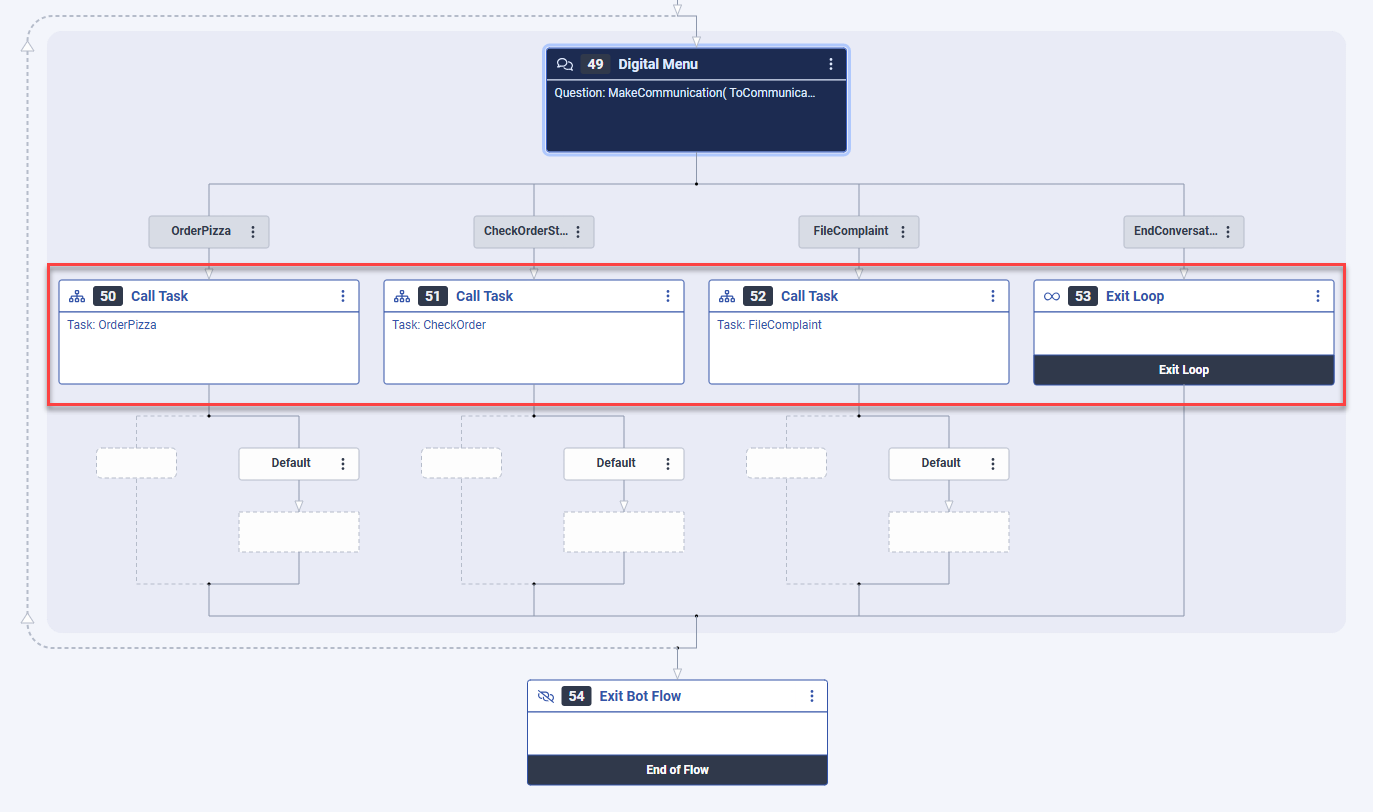
- Now, examine the Digital Menu action to review and determine why progress is stalling and identify any necessary actions to remove the fricton points.
Gain powerful insights into your customer journeys with Journey Flows:
Key benefits at a glance
Key use cases in detail
Actionable insight
Assume that you are a contact center admin or analyst who wants to assess the effectiveness of a bot. Your goal is to compare the number of customers who achieve resolution through the bot versus a human agent (ACD). To accomplish this task, use Journey Flows functionalities.
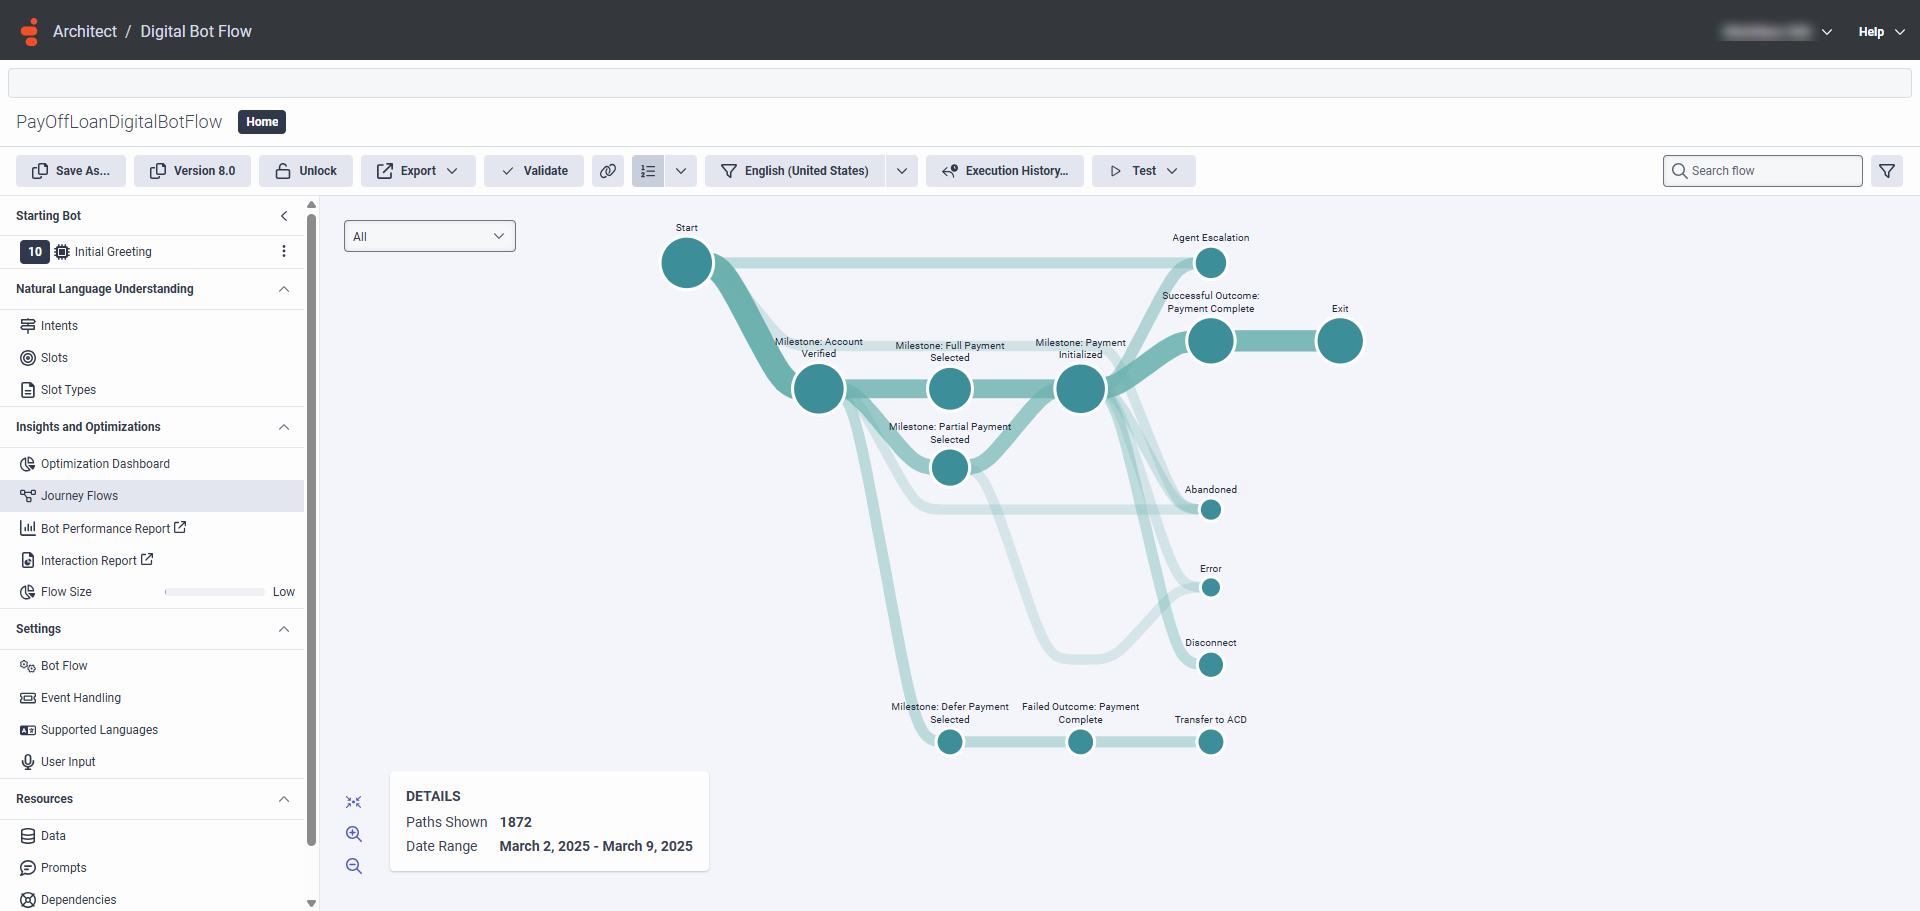
- From the Architect home page, click or hover over the Flows menu and select the desired flow type.
- Click the flow that you want to analyze.
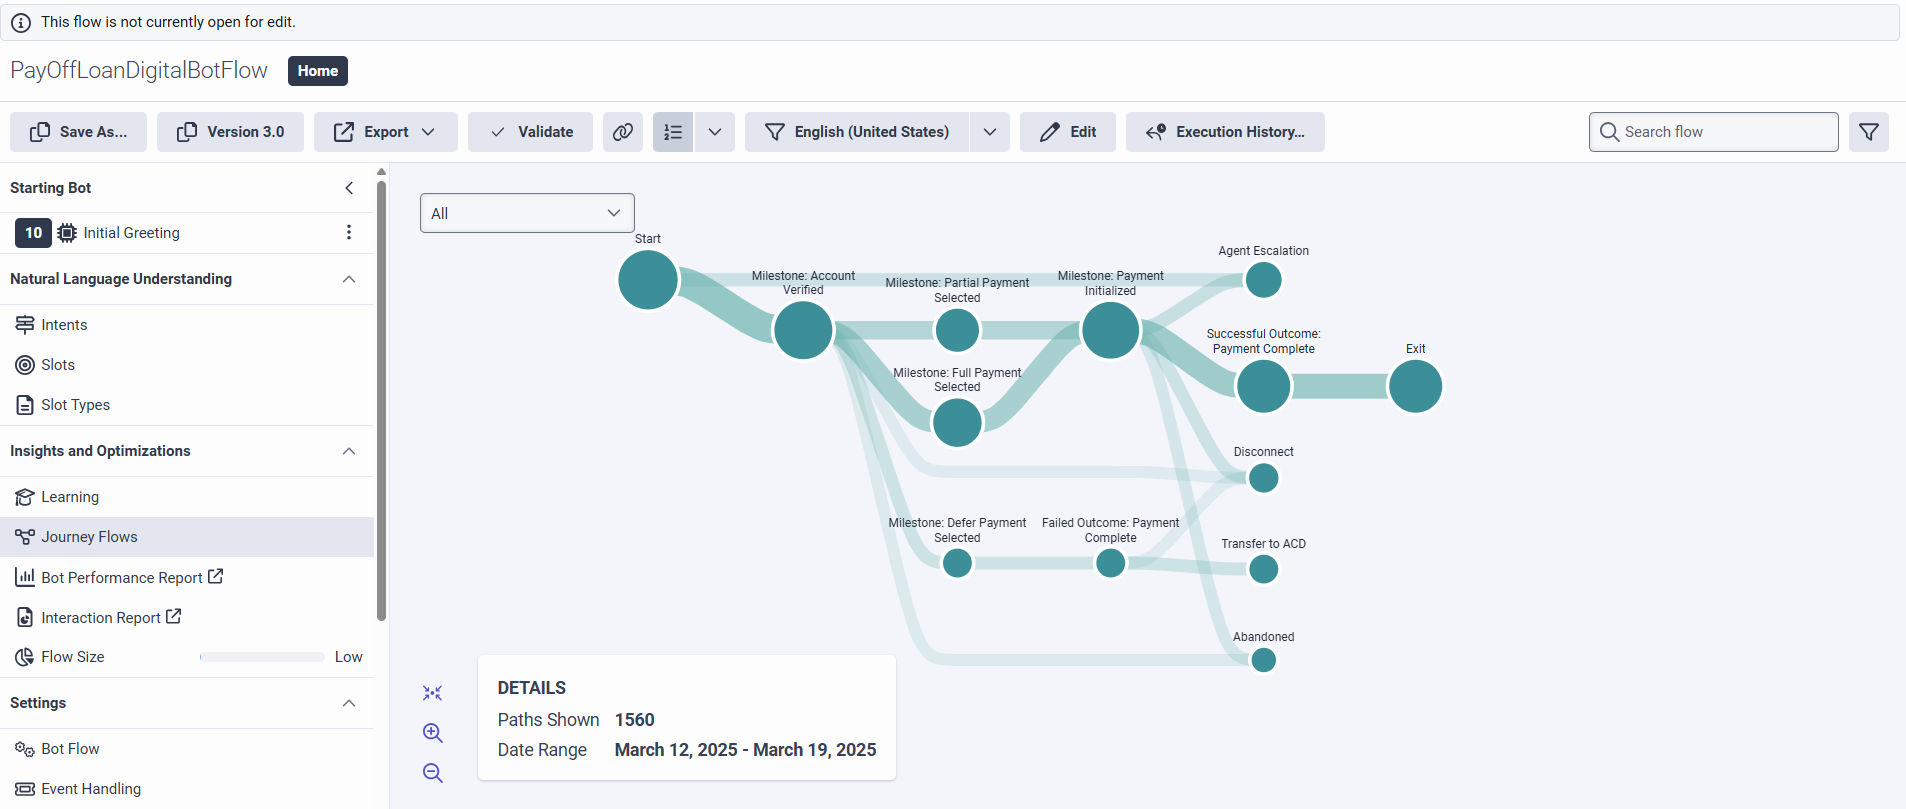
- Click Journey Flows in the Insights and Optimizations menu. The Journey Flows visualization opens. The visualization shows the distribution of customers along the various flow milestones and outcomes as well as the various flow exit reasons. The visualization also demonstrates how the customer journey progressed at each flow stage:
- Next, because you want to know how many customers went to the Payment Initialized milestone, hover over the milestone to display the frequency count:
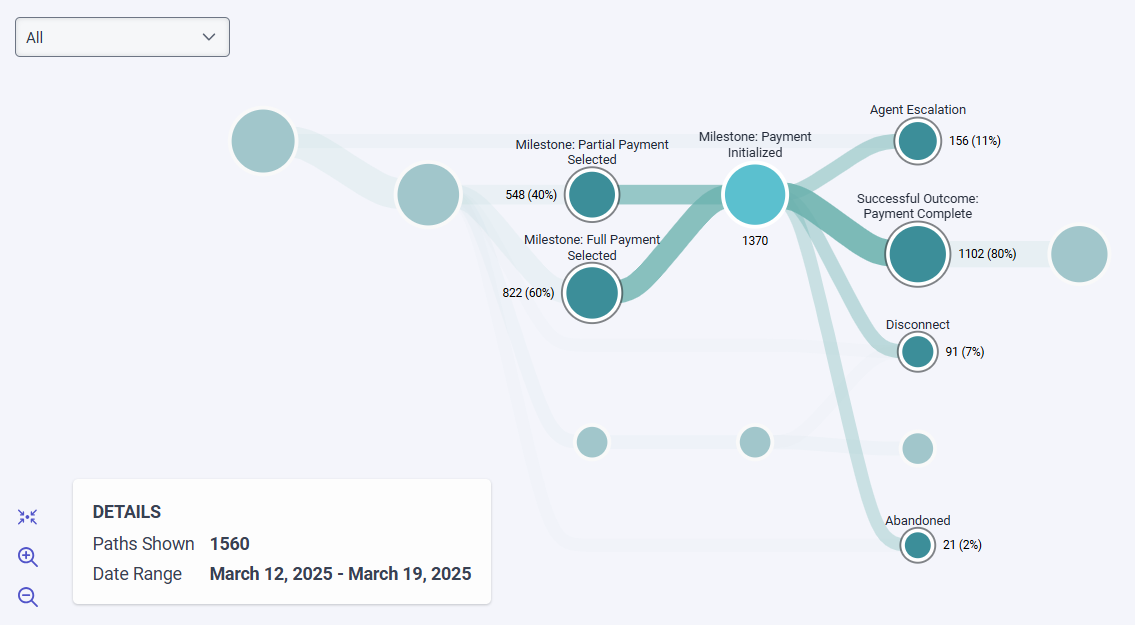
- Now, to examine why 11 per cent of customers who completed the Payment Initialized milestone asked to speak to a human agent and seven per cent of customers disconnected the call, use Flow Insights to generate a heatmap of the Digital Menu options in your Initial Settings menu or use Replay Mode to check execution instances of your flow.
- Next, examine sessions that were Abandoned.
Gain powerful insights into your customer journeys with Replay Mode:
Key benefits at a glance
Key use cases in detail
Actionable insight
- From the Architect home page, click or hover over the Flows menu and select a flow type for which historical execution data is available.
- Open the flow that you previously executed to debug and troubleshoot.
- Click Execution History. The Flow Execution History dialog box opens.
- Under Results, Architect lists previous execution instances of the flow that you opened and provides the name, version, flow type as well as the start and end date time of the flow instances.
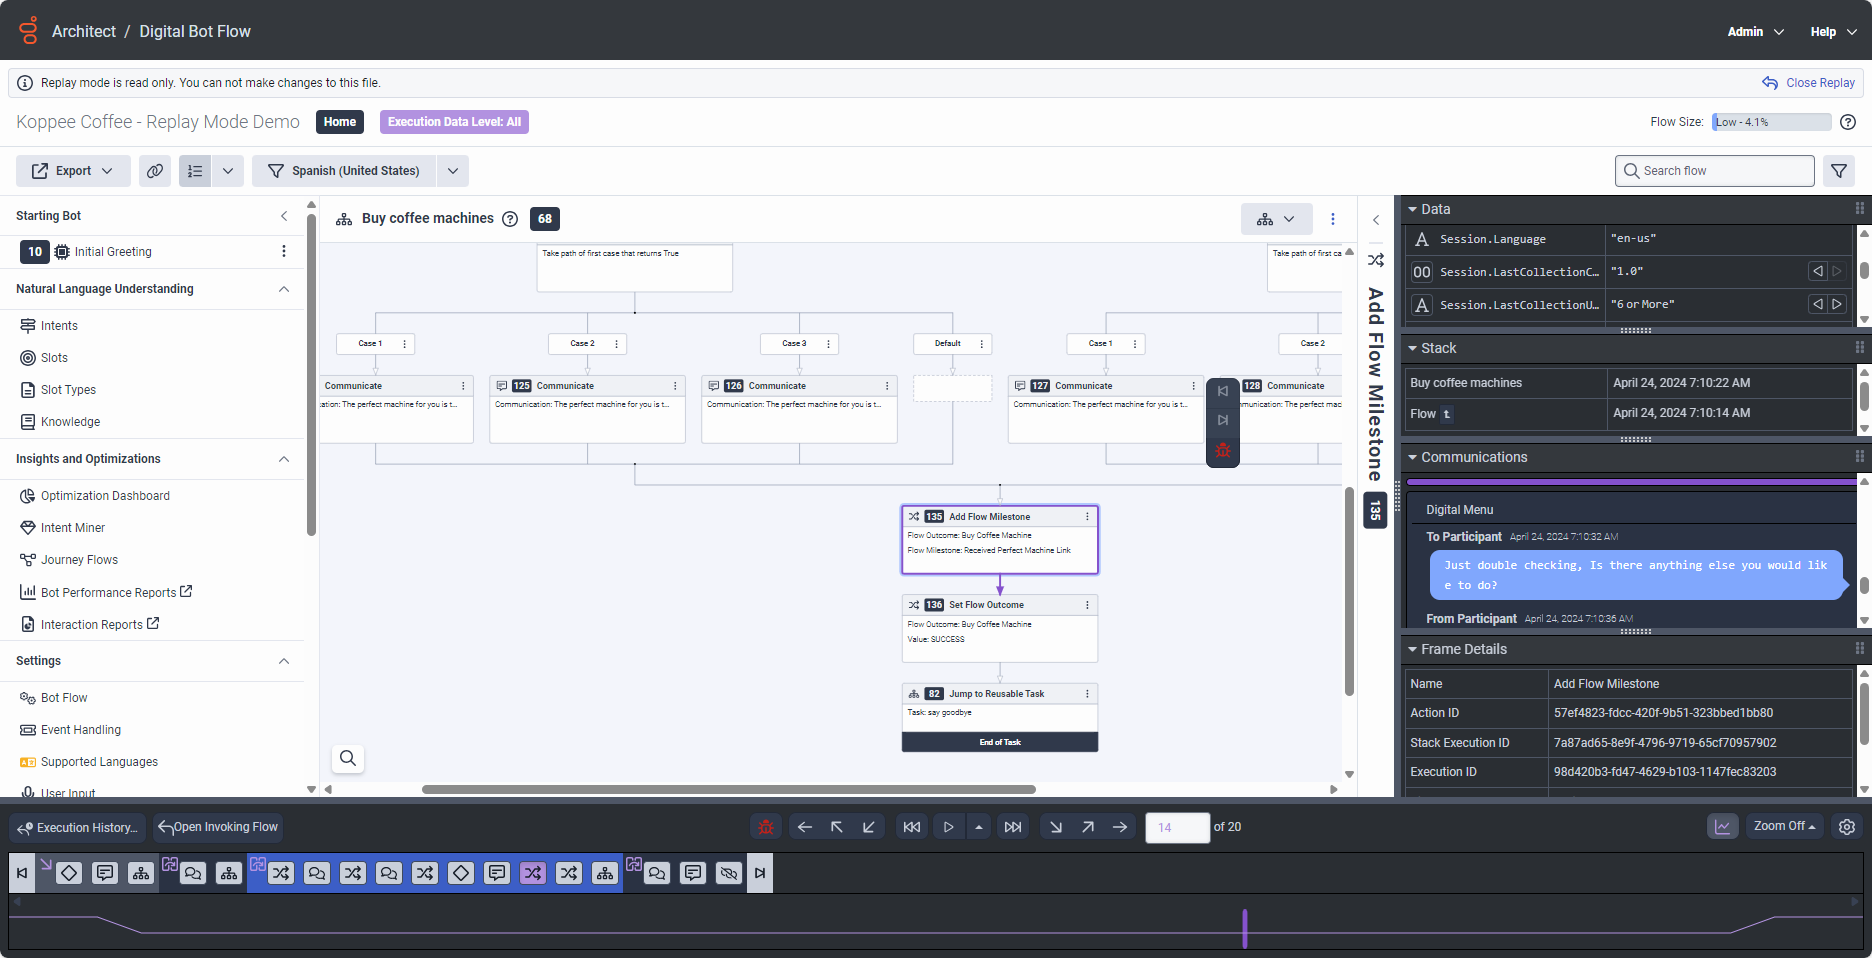
- Click a flow instance to open the instance in Replay Mode. For more information, see Use replay mode to troubleshoot an Architect flow.
- Use the replay controls to step through the flow to replay the sequence of actions that lead to the specific flow component that you want to analyze.
- If the required level of execution data is available, review communication exchanges and inspect variable values as well to pinpoint the issue with the flow component.
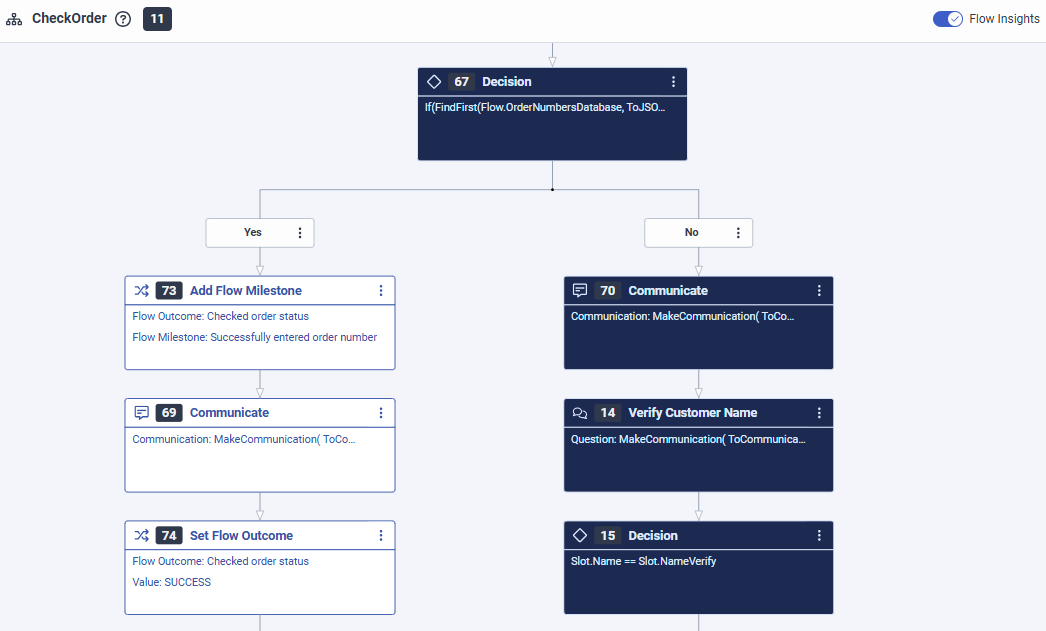
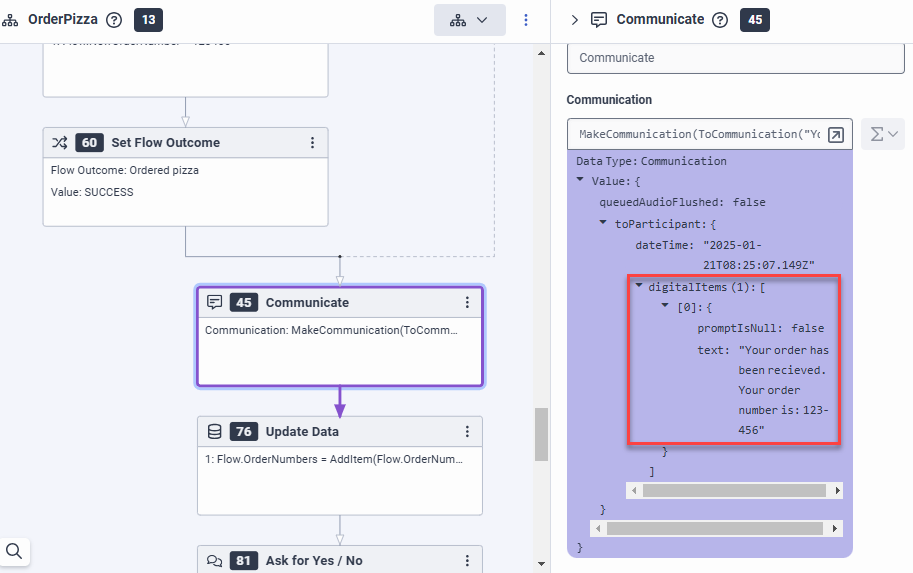
In the following digital bot flow example, customers enter their order number to check the status of their order, but the bot fails to recognize the number.
- The flow designer used an Ask for Slot action to verify the order number and used a slot of the type
builtin:anyto store the customer’s input. - After the bot receives the input, the flow moves on to a Decision action that uses the expression
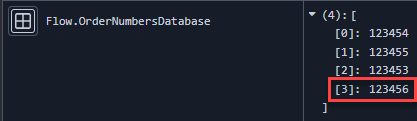
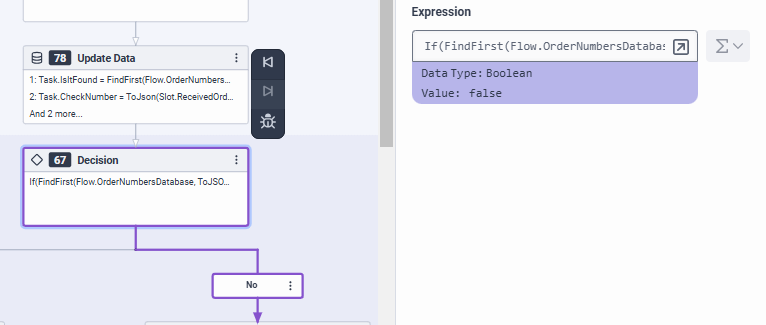
If(FindFirst(Flow.OrderNumbersDatabase, ToJSON(Task.CheckNumber))==-1, false, true)to determine whether the array of existing order numbers stored in theFlow.OrderNumbersDatabasevariable contains the order number the customer entered (Task.CheckThisNumber).
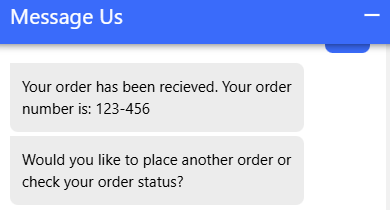
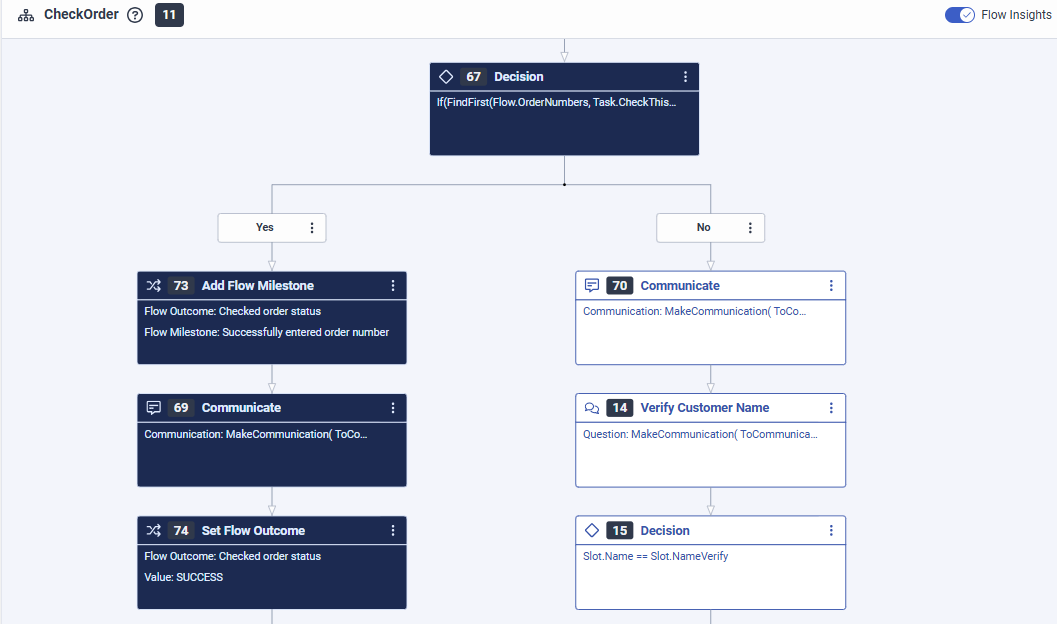
Flow Insight’s heat map analysis shows that the Decision action always takes the unhappy path:
Architect’s Replay mode provides the key to understanding why this happens. The bot uses a pattern in the format ###-### to display the order number for customers, where each # represents a digit (0–9) and - is a dash separator. The grouped format is a familiar pattern for customers that reduces the likelihood of errors compared to a long string of digits, and makes it easier to read and remember the number.
The recognition issue occurs because the bot provides the order number in the###-### format, but the bot expects a string of digits without dashes as user input (see the order numbers in the Flow.OrderNumbersDatabase variable). This mismatch in the flow design leads to recognition failure.
Replay mode revealed that the bot must handle dashes in customer input. To address the recognition issue, use a regex slot type with the pattern ^\d{6}$|^\d{3}-\d{3}$ to validate the input format and remove any dashes before you check the order number against the order database.
Gain powerful insights into your customer journeys with Journey Management:
Key benefits at a glance
Key use cases in detail
Actionable insight
Assume that you are a contact center analyst who assesses the effectiveness of bots that are designed for social media applications. Your goal is to compare the number of customers who achieve resolution through bots versus human agents (ACD). To accomplish this task, use Journey Analyzer functionalities.
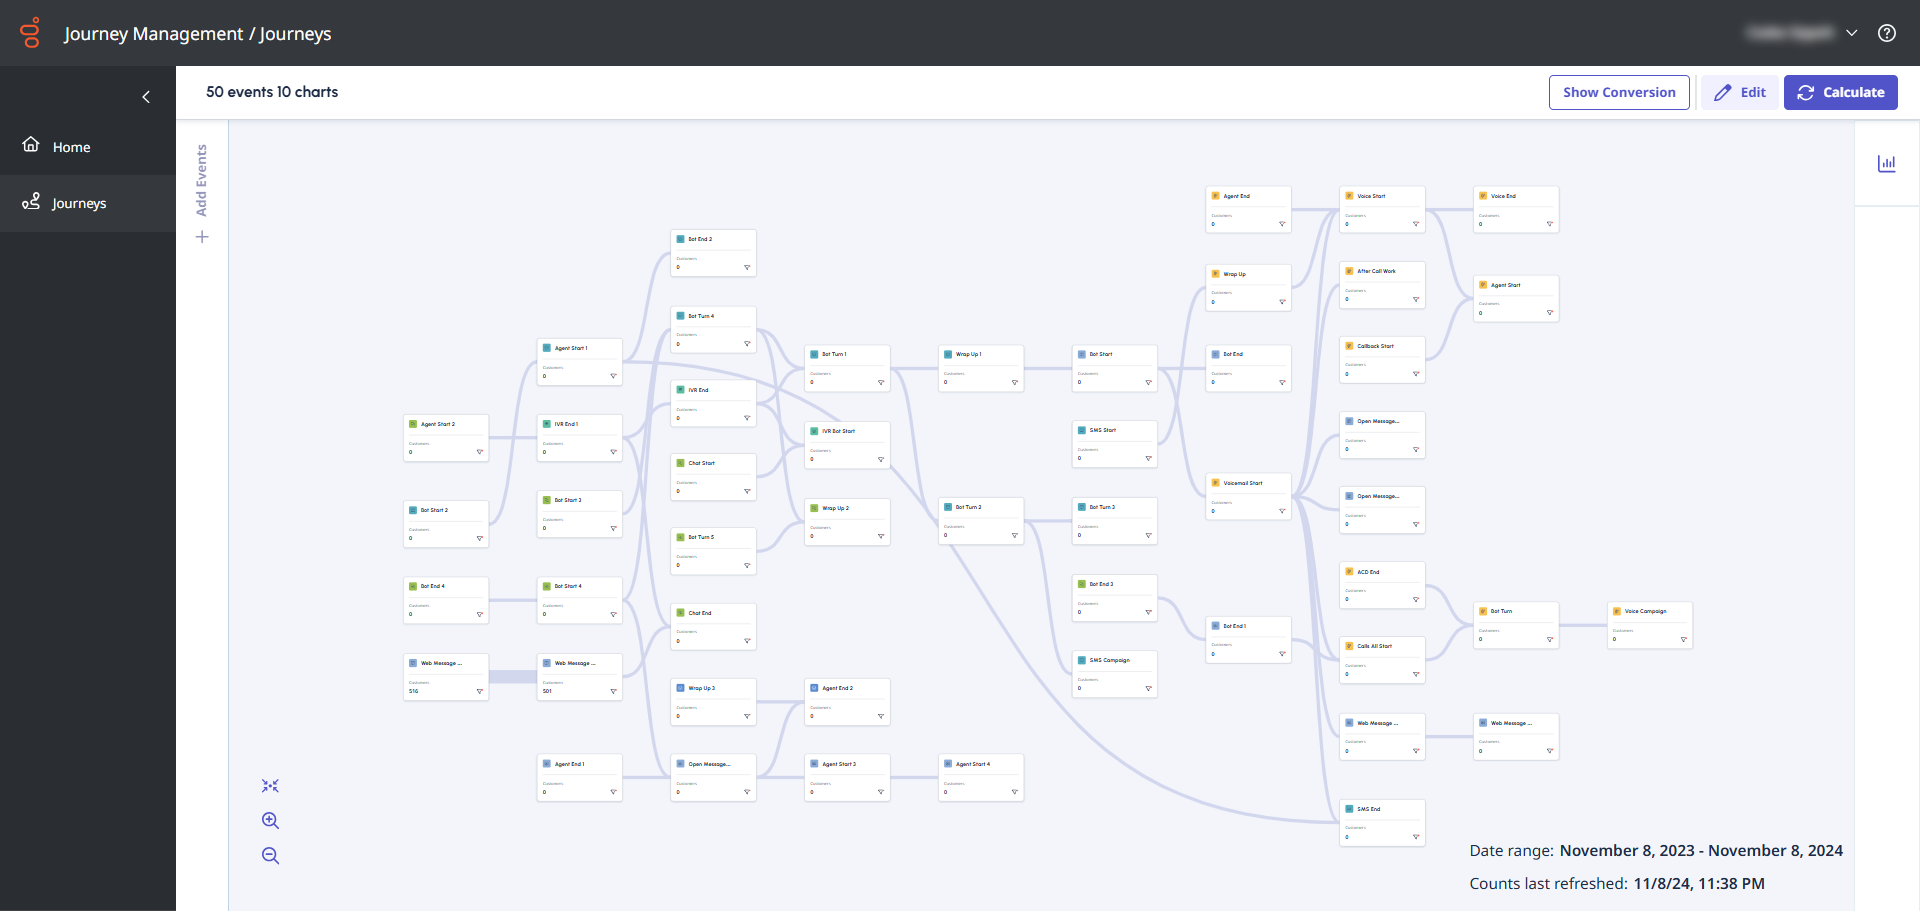
- Log in to your Genesys Cloud account and click the Journey Management menu. The Journey Management screen opens.
- Create a new journey.
- To enter Edit mode and modify a journey, click Edit.
- Journey events align to the types of actions that are triggered throughout an interaction. The Customer Start event is triggered when a customer engages with a channel. Drag a Customer Start event and filter it for the social channel you want to measure.
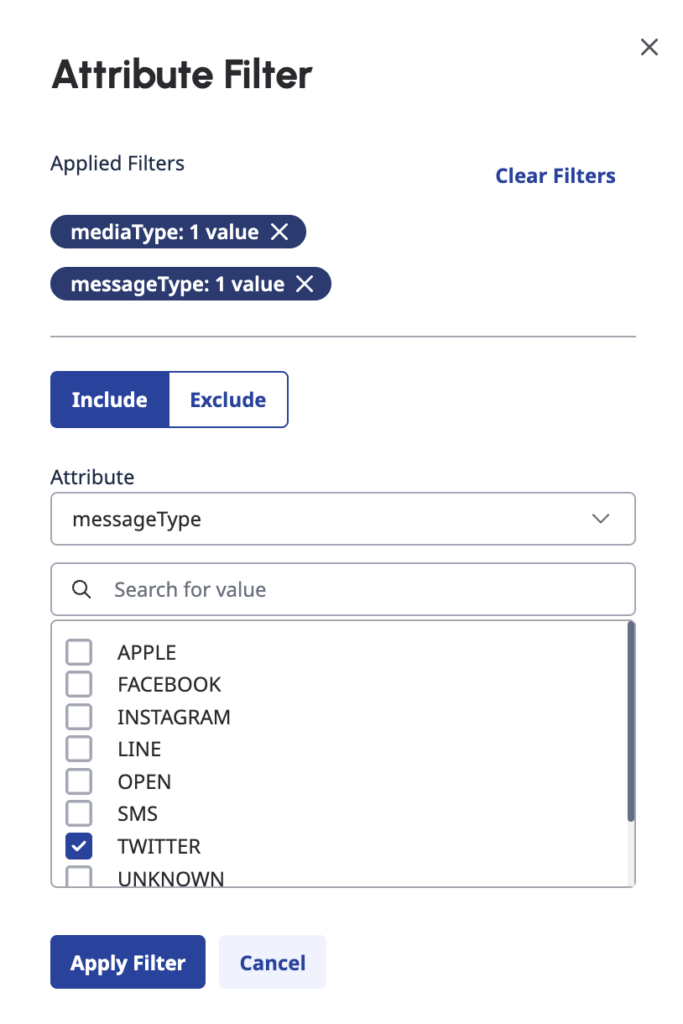
- Open the event, click the filter icon and select the following:
- MediaType - Message
- MessageType - The social channels you want to measure
- Add a descriptive name on the canvas to this event such as, Started a social engagement on Twitter.
- Next, because you want to know how many customers went to Bot Start after they started their social engagement, drag and drop Bot Start to the canvas and then let it connect to Customer Start.Tip: Use the Tab key on the keyboard to move navigate through the event list and use the menu.
- To narrow down the event to the bot name, include the bot name as an event attribute filter.
Tip: You can find the bot name in Architect. Journey Management supports native or third-party bot events, but native bots provide more detailed data for the journey.
- To narrow down the event to the bot name, include the bot name as an event attribute filter.
- Now, to examine completed bot sessions, drag Bot End to the canvas and then let it connect to Bot Start.
- Because you are interested in the same bot that you examined in Step 6, include the bot's identifier as an event attribute filter at this event.
Tip: If you use a native Genesys bot, then to narrow your analysis to an intent and other interaction attributes that may be relevant, add Bot Turn between start and end. - To see completed bot sessions, include the botsessionOutcome filter and then select the complete attribute.
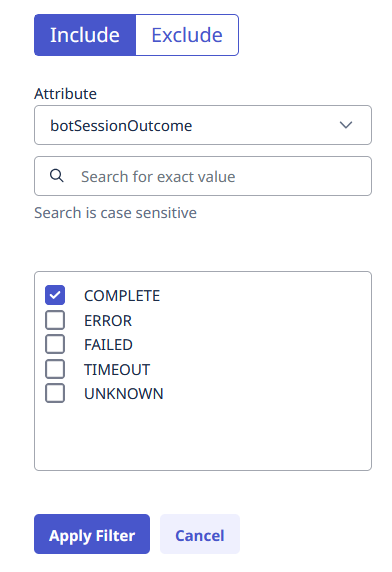
- Click Apply filter.
- As in this event, you examine completed bot sessions and not the sessions that went to ACD (automatic call distribution), add a BotResult filter in the Exclude section with TransfertoACD as the value.
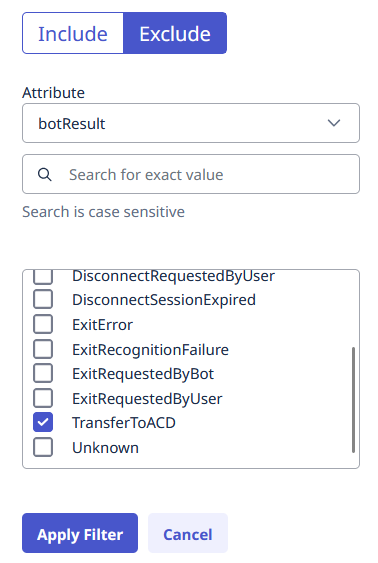
- Click Apply filter.
- Because you are interested in the same bot that you examined in Step 6, include the bot's identifier as an event attribute filter at this event.
- Next, examine sessions that went to ACD. Drag the ACD Start event to the canvas. Let it connect to Bot Start, so that it is parallel to Bot End.
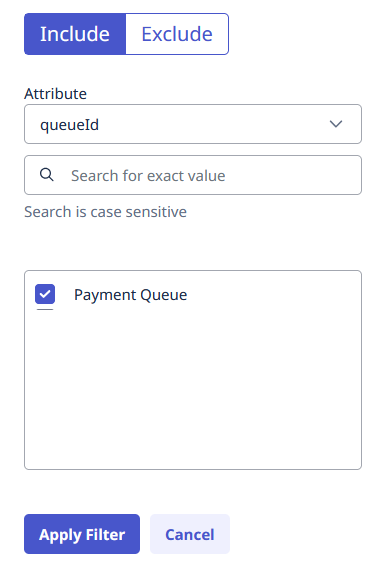
- In this event, select queueID as Attribute, and then add a filter for the Payment Queue.
- Click Save.
Calculate and edit the sample journey
- Click Calculate to generate journeys. A notification about the calculation count appears.
- To continue, click Proceed. The calculation takes a few minutes to run. The loading time depends on the volume of data to process, so larger datasets take more time to calculate. To see the results, refresh the page.
- After the calculation finishes, you want to know the number of resolved calls by agents. To edit the journey, click Edit.
- Drag the Agent Start event, and let it connect to the ACD Start event.
- Add a filter for the Payment Queue. The payment queue has two wrap-up codes: Success and Failure.
- Track agent resolution with a Success wrap-up code. From the Voice event group, drag a Wrap Up event to the canvas and let it connect with the Agent Start event. Select the wrapupCode attribute and include the identifier of the Success wrap-up code as a filter.
Note: You can get the list of wrap-up code IDs used in your environment with the Wrap-up API endpoint through the API Explorer, which is available on the Genesys Cloud Developer site. - To indicate that it stands for the Success wrap-up code, add a descriptive title to your After Call Event such as 'Successful Resolution'.
- Track agent resolution with a Success wrap-up code. From the Voice event group, drag a Wrap Up event to the canvas and let it connect with the Agent Start event. Select the wrapupCode attribute and include the identifier of the Success wrap-up code as a filter.
- Add a filter for the Payment Queue. The payment queue has two wrap-up codes: Success and Failure.
- Click Save.
- To update the journey, click Calculate. To see the updated counts refresh the page.
See funnel analysis in the sample journey
With the help of funnel analysis, you can understand how your customers move through the journey to achieve their goals and then determine the success rates of their individual journey paths.
A journey must have calculations for funnel analysis.
- Open the existing journey that you want to analyze.
- In Edit mode, click Show conversion. Journey Analyzer calculates the conversion metrics.
- To examine the attributed metrics, click the + icon again in the upper right corner of the event. To hide the conversion metrics of an event, click the - icon in the upper right corner.
- To determine the journey that your customers followed, examine the Customers, Conversion rate, Dropped out and Moved forward metrics at the respective events.
Example: The funnel analysis in the Bot Start event shows that 650 customers dropped out from the journey at this point, and 1052 customers Moved forward to Bot end, so Bot end has a conversion rate of 61.7%. This means that 61.7% of your customers proceeded to reach the Bot end session.
- Always rename the events so that the journey is readable for any new users and to match the scenario.
- Journey Management lets you test your own hypotheses about user journeys. For example:
- You can model a scenario to test that if customers move through Bot A, do they escalate at a higher rate than the customers who go through Bot B? You can drag several Bot Start events to your journey, and set attribute filters for Bot A and Bot B, respectively.
- You can examine the impact of language. For example, measure if customers who engage with an English-speaking bot complete interactions as successfully as customers who engage with a French-speaking bot. In this analysis, you can use the language filter in the Bot Start event.
- You can work with Journey Flows to view patterns within flows to see if there are issues you want to explore. For example, if you see escalations, use Journey Analyzer to understand the nature of the escalation, the frequency, and the outcome.
Note: Journey Management and Journey Flows are two powerful tools that can complement each other, but they have several differences. For more information, see Differences between Journey Management and Journey Flows. - Performance views can also help you support your analyses; like Flow outcomes in Architect, the Queues Performance view, or the Interactions view in Workspace.
- The AppFoundry offers several templates that you can use to get started.