
Journey flows overview
- Journey > Paths > View permission
Journey flows overview
Journey flows help you visualize the customer journey and better understand the flow milestones and flow outcomes in interactions that influence containment rates. Use journey flows from an Architect bot, digital bot, inbound call, outbound call, secure call, inbound message, or inbound email flow’s Insights & Optimizations menu. Journey flows are high-level visual representations of how well a flow serves customers.
This feature enables customer experience managers to gather data about self-service success and agent-assisted interactions. Flow authors can gain insights into the paths that customers take during interactions with Architect flows and then identify the moments within the customer journey that need improvement.
To improve the customer journey, you can use journey flows in these situations:
- Understand how to better service customers with your bot or IVR flows.
- Identify common pain points that lead to agent escalation.
- See where errors occur that prevent successful resolution.
- See where Genesys Cloud transfers interactions to an agent via a Transfer to ACD action.
Key points
Before you use journey flows, make sure that you understand these key points:
- Journey flows are a data visualization tool designed for flow milestone and flow outcome-related customer interactions, and behaviors through their journey in a single Architect flow.
- Journey flows cannot visualize customer journey data across multiple flows. For example, when flows orchestrate other flows.
- Journey flows aim to provide insights based on certain metrics such as frequency counts, however, Genesys does not intend that these metrics be exact, but rather enable you to focus on the qualitative aspect of the customer journey. Journey Flows help you uncover customer motivations, preferences, and pain points.
Journey flows show the customer journey graph based on up to seven days of available data.
- Journey Flows does not currently visualize or count journey paths that ended in a transfer-type Architect action other than the Transfer to ACD action. In a future release, Journey Flows will support more transfer types.
-
To ensure good performance and clear insights, Journey Flows may only display the most frequent journey paths for flows that have a very large number of flow milestones or outcomes.
- Journey flows calculate and update the journey paths overnight, based on your organization’s region and only show the journey paths that customers complete in the past seven days. So if you created a flow or added new flow outcomes and milestones, you can expect an update by the next day.
- Best practice recommends that you create milestones to capture journey events at higher levels of abstraction and not for every individual action that led to a specific journey event. For example, unless you want to specifically visualize the customer journey through an authentication process, do not create separate flow milestones for every step of the process (“user name entered,” “password entered,” “captcha verification completed,” and so on). Create a single flow milestone for the entire authentication process. If a group of customers do not reach that milestone, it can tell you that they might have difficulties with authentication.
Main graph components
The Journey Flows graph includes the following main components:
Nodes
Nodes represent the customer journey events in journey paths.
- Events in journey paths are flow milestones and flow outcomes. Think of flow outcomes as goals and flow milestones as the steps needed to reach these goals. With Journey Flows, you can visually identify the various paths that customers took along the different milestones toward a successful or failed outcome.
For example, if the business goal of an Architect flow is to help the customer make a successful payment, a successful flow outcome happens when the payment is complete. To track the steps that customers take to achieve this outcome, you can add flow milestones to the payment process.
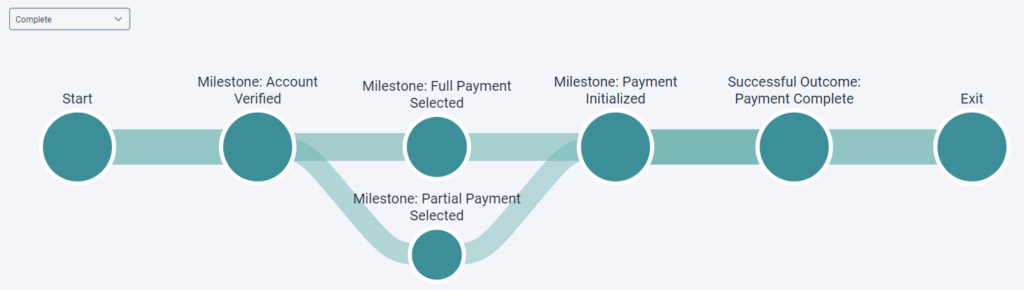
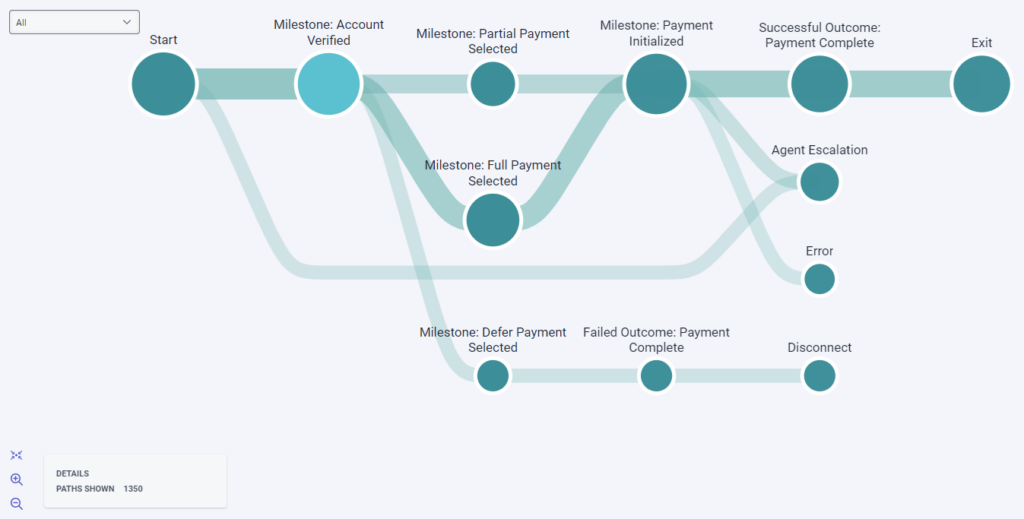
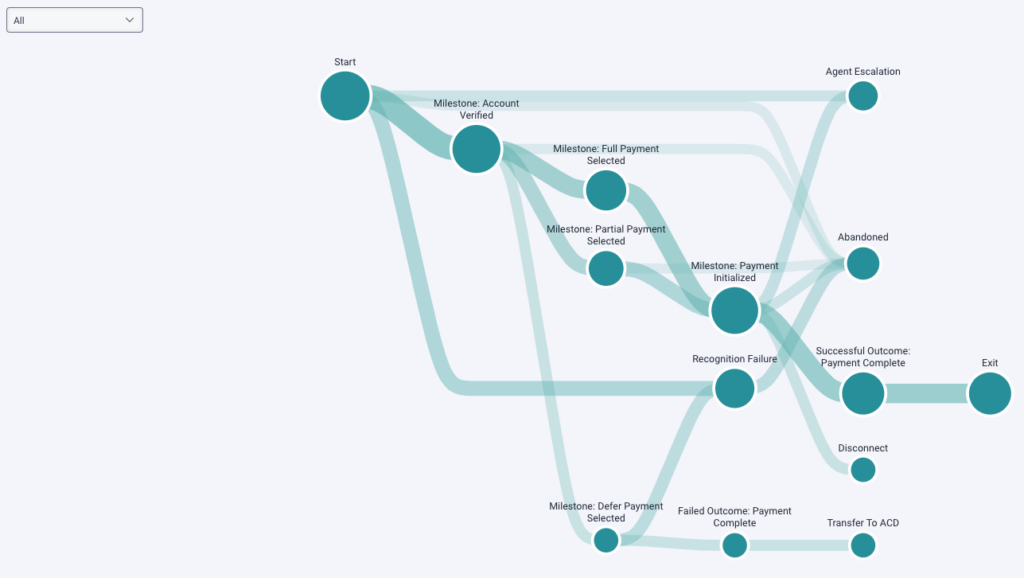
You can see the following flow milestones in the example: (1) verify the customer’s account, specify whether the customer prefers full (2), partial (3), or deferred (4) payment, and (5) initialize the payment according to the customer’s payment preference. The example shows the distribution of customers along the different payment preferences and exit reasons, and demonstrates how the customer journey progressed at each flow stage:
Click the image to enlarge.
- The number of nodes corresponds to the number of customer journey events:
- The start of the customer interaction that the start node represents
- The completed flow milestones and outcomes
- The different ways that the customers’ journey flow ended that the terminal nodes represent, for example, an agent escalation, a disconnect, or a complete resolution
- Journey flows visualize the flow of journey events in a chronological way, so the node sequence represents the order in which journey events occurred.
Consider the following journey path that shows the path of customers that successfully completed the customer journey along the following journey events:- The customer verified the account (the first milestone)
- the customer either selected to make a full payment (the second, more frequent milestone), or selected to make a partial payment (the third, less frequent milestone)
- The customer started the payment (the fourth milestone)
- The customer completed the payment (successful outcome), and successfully exited the flow:
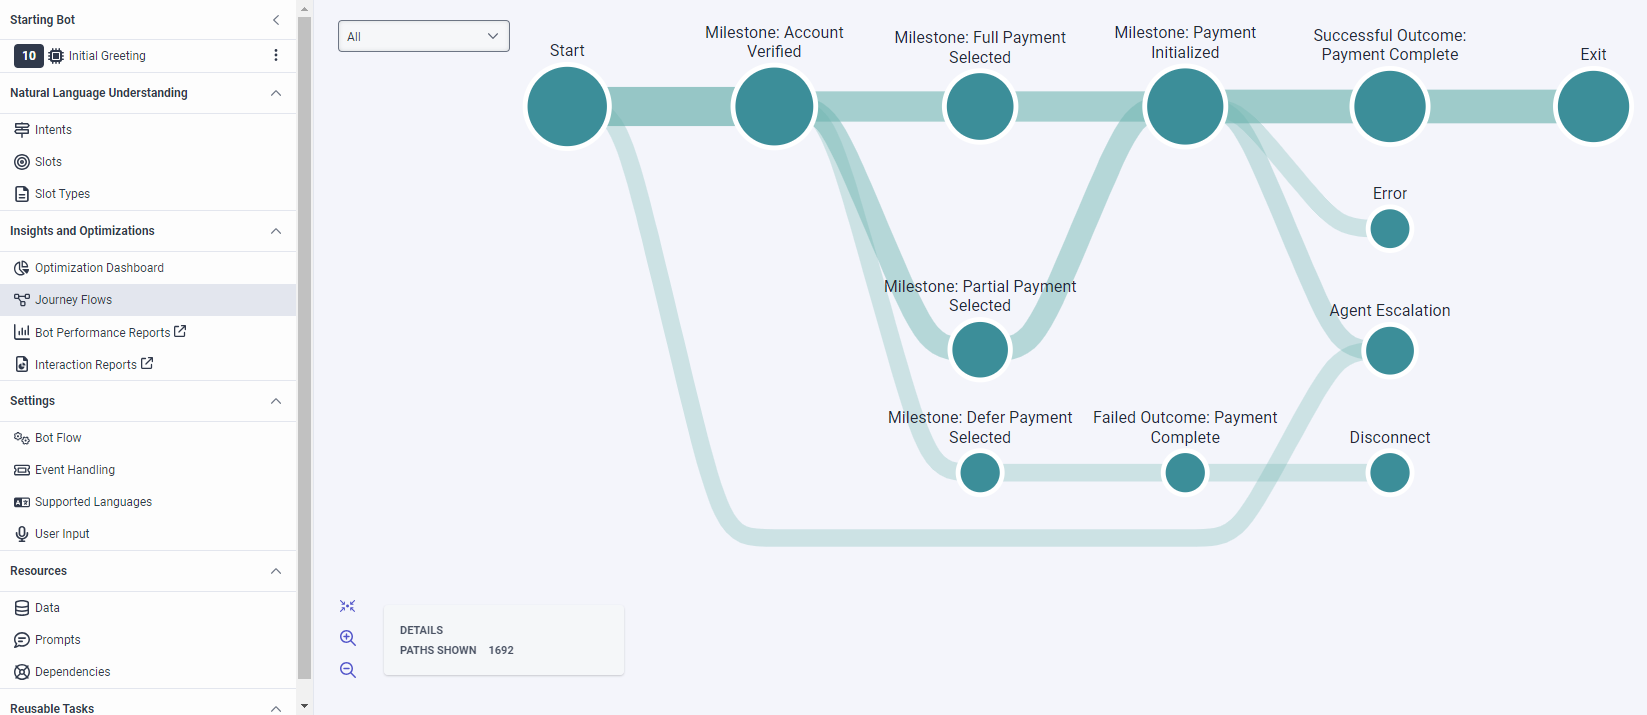
- A node’s size is proportional to the number of customers whose journey path led through that node. Therefore, the node’s size can reflect the number of customers who completed the specific milestone, reached the specific flow outcome, or exited the journey flow for the specific exit reason the node represents. Therefore, the Journey Flows graph allows you to identify flow milestones and flow outcomes of high frequency on the various journey paths customers take from the start node to terminal or exit nodes.
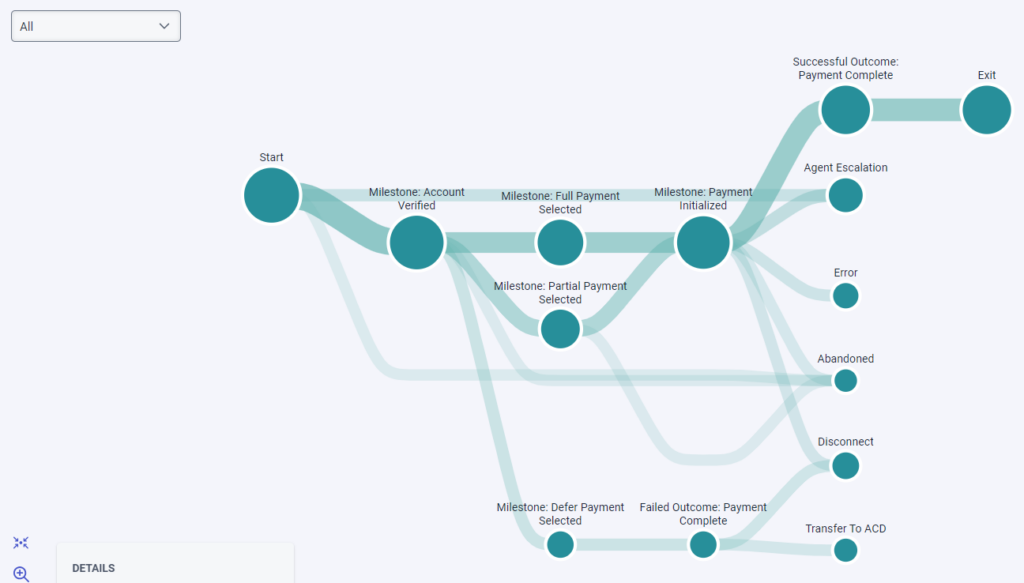
In the following example, the customer experience manager clicked the Payment Initialized flow milestone to see what percent of customers who reached that milestone came from the two previous milestones. 39 percent of customers who reached the Payment Initialized milestone selected partial payment at the previous milestone and 61 percent selected full payment. The graph also shows that only 71 percent of customers who passed through the Payment Initialized milestone went on to make a successful payment. 13 percent of them requested to speak to an agent. Eight percent of customers either disconnected from or abandoned the payment process.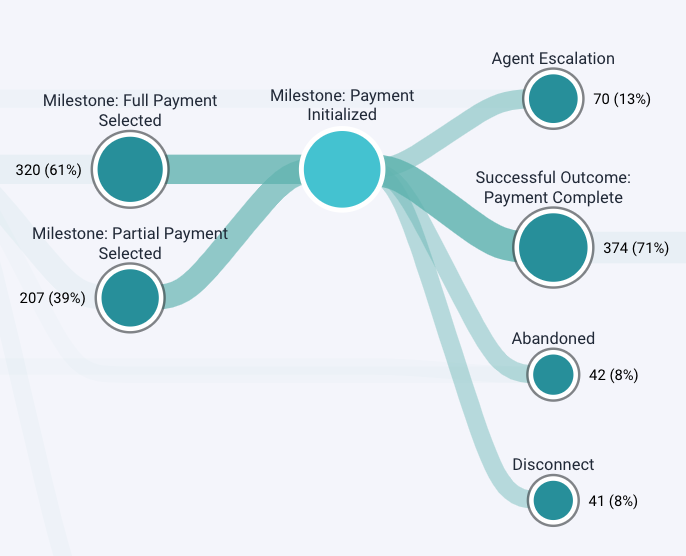
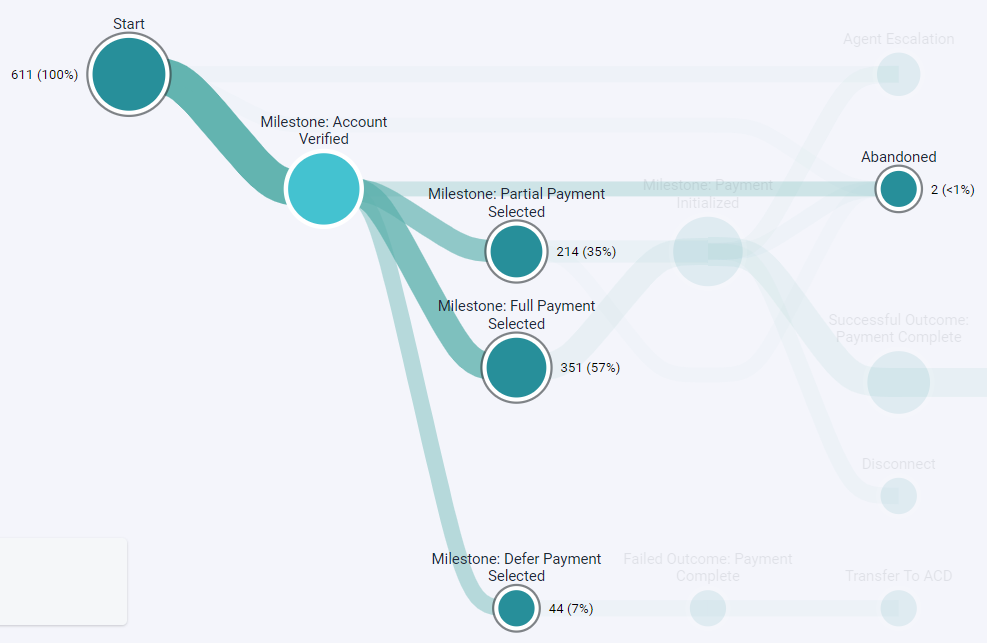
- The frequency count of other journey events (nodes) is always relative to the journey event (node) that you selected.In the following example, the Partial Payment Selected milestone has a frequency count of 35 percent as 35 percent of all customers who completed the Account Verified milestone went on to make a partial payment. 57 percent selected to make a full payment, and seven percent chose a deferred payment. Less than one percent of customers abandoned the payment process:
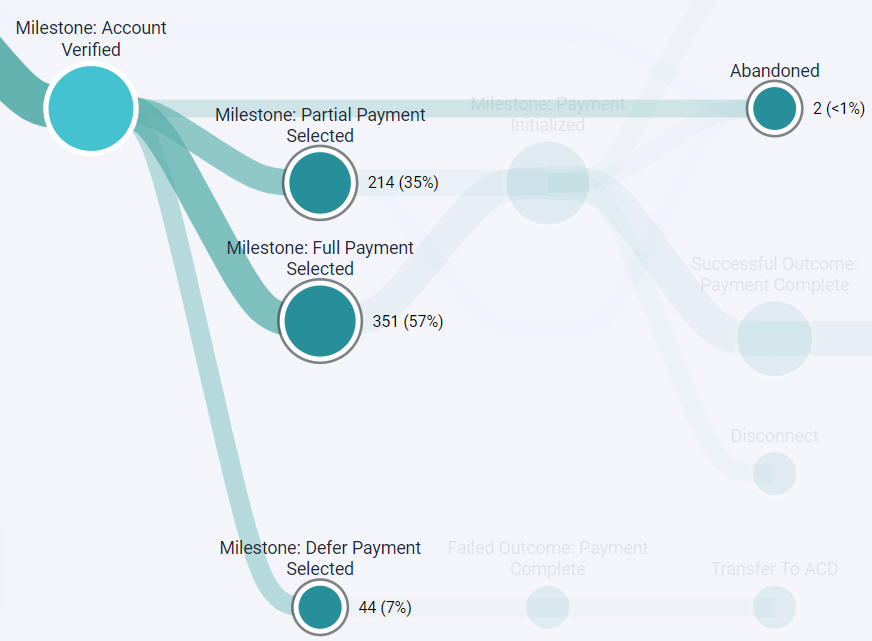 The frequency count for the same Partial Payment Selected milestone changes when you select another milestone, the Payment Initialized milestone. As no customer that selected a deferred payment went on to start the payment, the frequency count of the Partial Payment Selected milestone increases from 35 to 38 percent:
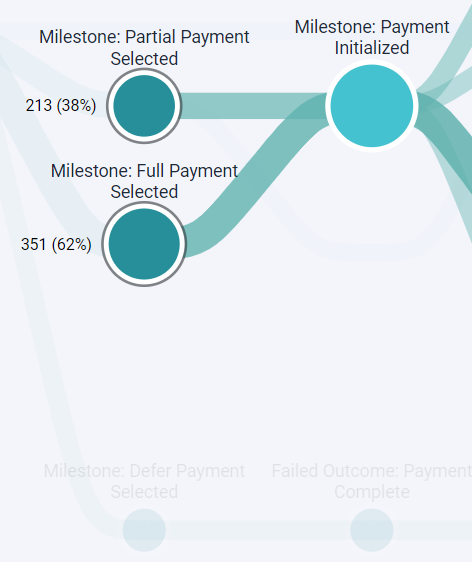
Connectors
Connectors link the nodes. Each connector has a source and a target node. The width of the connectors between nodes reflects the proportion of the customers among all customers who took a specific journey path and moved from a specific node or journey event to another. In other words, connectors are proportional to the amount of journey flow they carry.
The width of the connectors reflects the amount of journey flows that they carry.
Navigate journey flows
- To drill down in the customer journey and only show the customer journey events (nodes) and journey paths (connectors) that led to the journey event you clicked, click a journey event (node).
- To display the frequency counts for the journey events that preceded and followed the journey event you hovered over, h\Hover over a journey event (node).
- Click Show All Paths to zoom out of a drilled down view and see all journey paths.
- Click the canvas and drag the graph to any location on the canvas so that you can focus on a specific part of the customer journey.
- Zoom in and out . All views in journey flows offer zoom options that allow you to either zoom in and view the graph in more detail, or zoom out to view the graph at a higher level. If your mouse has a scroll wheel, then you can use it to zoom in and out.
- Align the graph to the center of the canvas. All views in journey flows offer the option to drag the graph to any location on the canvas. To align the graph to the center again, click .
- Check the DETAILS box next to the zoom controls to see the number of journey paths that the journey flow currently shows. The box is especially useful when you click a specific journey event (node) as it also shows you the percentage of all users that went to that journey event.
Filter the journey paths
You can filter the journey paths that Journey Flows show for a specific Architect flow based on various exit reasons:
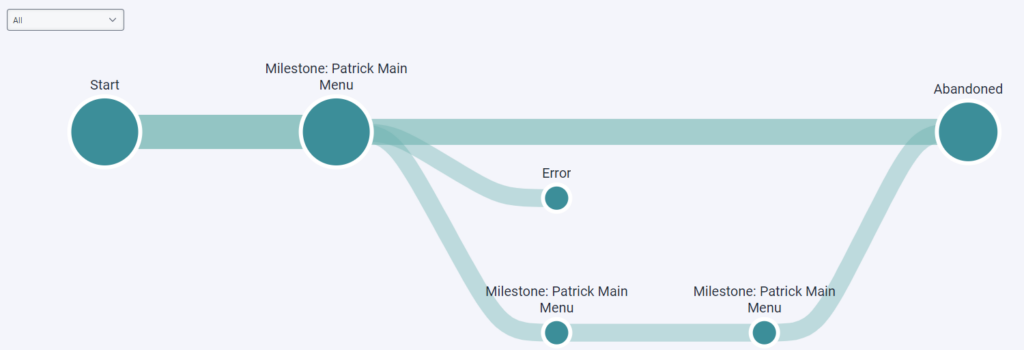
- All: Architect shows all the journey paths that customers have taken in the default date range. Journey Flows shows this view by default.
- Abandoned: Architect shows journey paths that customers abandoned. This scenario can occur, for example, in voice bots when the caller ends the call before a successful resolution or in digital bots when the conversation expires due to participant inactivity.
 To see only the paths that customers abandoned, select Abandoned from the drop-down:
 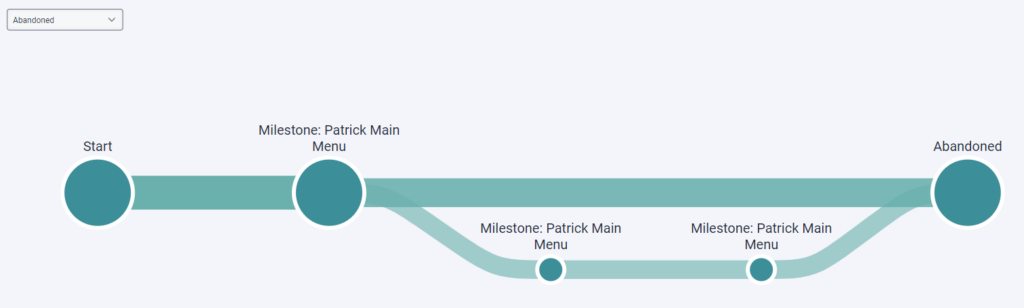 To see the number of abandoned journey paths, check the DETAILS box next to the zoom controls in the lower left. You can also click the terminal node Abandoned that represents abandoned interactions. Architect highlights all nodes that immediately preceded the selected terminal node and displays their relative frequency count.
- Agent Escalation: Architect shows the journey paths that ended in agent escalation. This scenario can occur, for example, in flows where the customer requests to speak to an agent.
 To see only the paths that ended in agent escalation, select Agent Escalation from the drop-down:
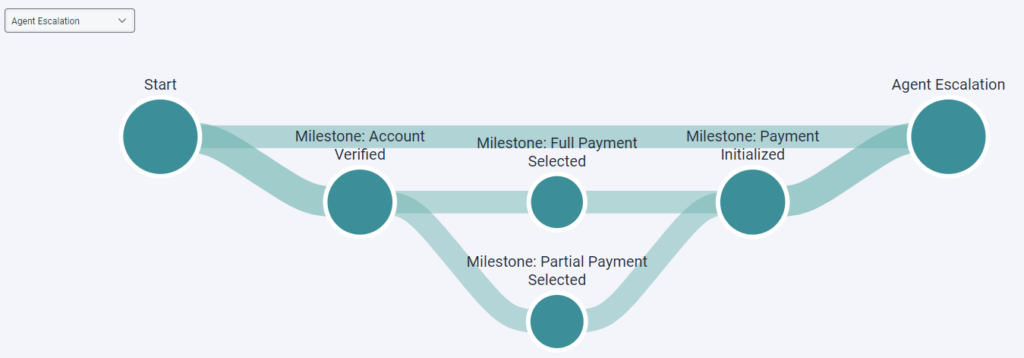
To see the number of journey paths that ended in agent escalation, check the DETAILS box next to the zoom controls in the lower left. You can also click the terminal node Agent Escalation that represents interactions that ended in agent escalation. Architect highlights all nodes that immediately preceded the selected terminal node and displays their relative frequency count. - Complete: Architect shows the journey paths that successfully completed.To see only the paths that successfully completed, select Complete from the drop-down:
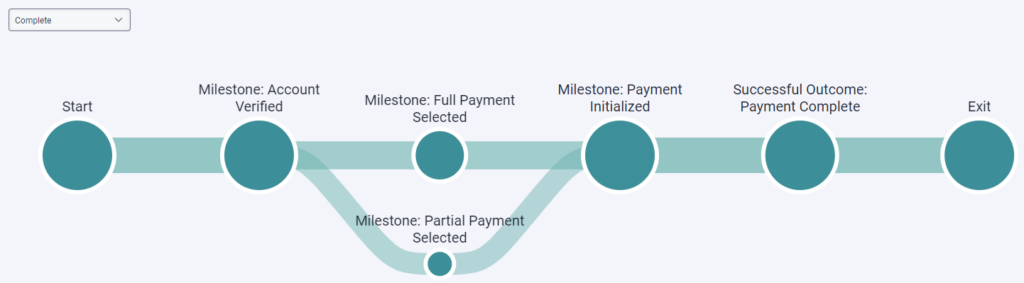 To see the number of successfully completed journey paths, check the DETAILS box next to the zoom controls in the lower left. You can also click the terminal node Exit that represents interactions that successfully completed. Architect highlights all nodes that immediately preceded the selected terminal node and displays their relative frequency count.
 - Disconnect: Architect shows the journey paths that ended in a disconnect.To see only the paths that ended in disconnect, select Disconnect from the drop-down:
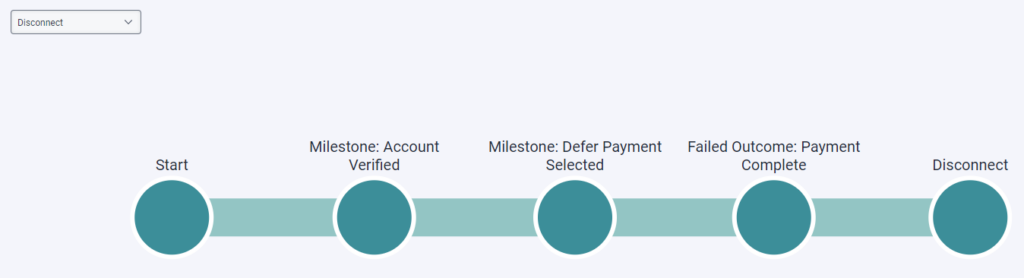 To see the number of journey paths that ended in disconnect, check the DETAILS box next to the zoom controls in the lower left. You can also click the terminal node Disconnect that represents interactions that ended in a disconnect. Architect highlights all nodes that immediately preceded the selected terminal node and displays their relative frequency count.
 - Error: Architect shows the journey paths that ended in error. This scenario can occur, for example, when a bot encounters issues such as a problem with an expression.To see only the paths that ended in error, select Error from the drop-down:
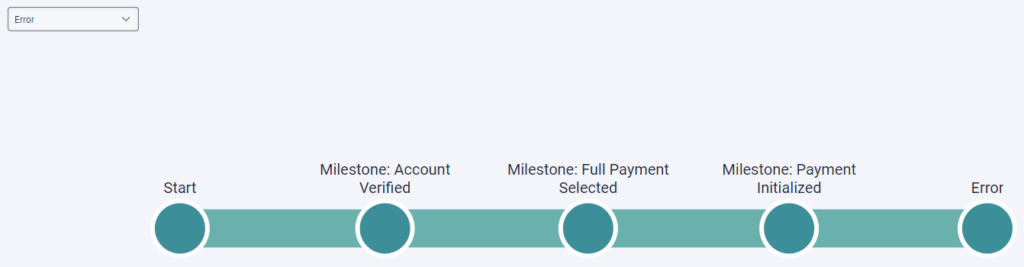 To see the number of journey paths that ended in error, check the DETAILS box next to the zoom controls in the lower left. You can also click the terminal node Error that represents interactions that ended in an error. Architect highlights all nodes that immediately preceded the selected terminal node and displays their relative frequency count.
 - Recognition Failure: Architect shows the journey paths that ended in recognition failure. This scenario can occur, for example, when a bot fails to understand the customer a specific number of times and therefore ends the conversation.
 To see only the paths that ended in recognition failure, select Recognition Failure from the drop-down:
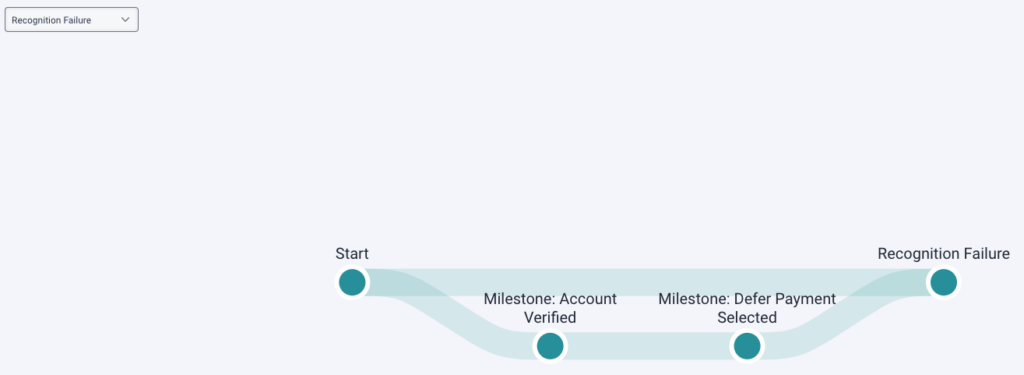
To see the number of journey paths that ended in recognition failure, check the DETAILS box next to the zoom controls in the lower left. You can also click the terminal node Recognition Failure. Architect highlights all nodes that immediately preceded the selected terminal node and displays their relative frequency count. - Transfer: Architect shows the journey paths that ended in a Transfer to ACD action.
 To see only the paths that ended in a Transfer to ACD action, select Transfer from the drop-down:
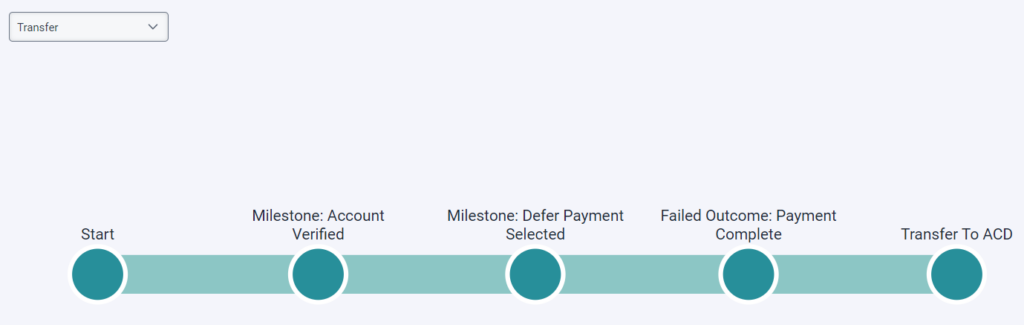
To see the number of journey paths that ended in a Transfer to ACD action, check the DETAILS box next to the zoom controls in the lower left. You can also click the terminal node Transfer to ACD that represents interactions that ended in a transfer to Genesys Cloud ACD. Architect highlights all nodes that immediately preceded the selected terminal node and displays their relative frequency count.