Use Flow Insights to view the frequency of executed flow components
- Analytics > Flow Execution Aggregate > View permission
- Architect > Flow Instance > View permission
Use the Flow Insights toggle in Architect to view the frequency of previously executed flow components such as starting or reusable menus and tasks and flow actions. Architect displays the frequency metrics as a flow insights overlay in Architect flows. The overlay gives you a quick overview of flow component frequency and helps you decide on which components to focus to improve or optimize your Architect flow.
- Inbound Call
- Outbound Call
- Secure Call
- Voicemail
- Bot Flow
- Digital Bot Flow
- Inbound Message
- Inbound Email
- Voice Surveys
- In-queue Call
- In-queue Email
- In-queue Message
- Workflow
- Workitem
- Survey Invite
Flow Insights as a visualization tool
The Flow Insights overlay allows you to assess quickly which flow actions, menu items, states, and tasks that run most frequently in the Architect flow. The visualization enables you to identify trends in customer behavior and areas of the flow that require improvement or optimization. The frequency counts and color coding also provide insights into flow performance metrics such containment rate, task completion, and drop-off rate.
- You can only enable the Flow Insights toggle in read-only mode.
- The feature relies on up to seven days of data. Data becomes available for Flow Insights only after a flow ends. You do not see insights for interactions that are in progress.
Architect uses the analytics data available for the version of the flow that you are viewing and shows the frequency overlay based on up to seven days of data if available. Architect queries the analytics data for old versions for the seven days before the date that they were unpublished and not from the current time.
How does Architect calculate the frequency?
The frequency overlay updates in real time, but you must refresh the Architect home page to see the updates. There are four frequency levels: zero, low (0–24%), medium (25–49%), high (50–74%) and very high (75–100%). A flow component’s frequency level also depends on the flow’s complexity, the component’s depth in the flow, and flow traffic levels.
Architect calculates frequency based on the number of unique sessions, which is the number of times users interacted with your flow. For bot and digital bot flows, a unique bot interaction counts as a unique session. For other Architect flow types, a flow execution instance counts as a unique session.
Architect calculates frequency in the following ways:
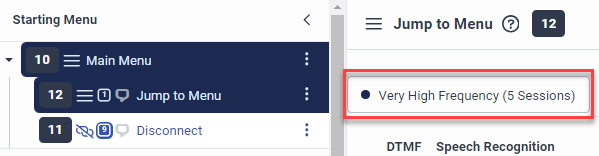
- For the Starting Bot, Menu, and State tasks, frequency means the number of unique bot flow sessions in which the starting task, menu, or state was executed. In other words, the execution frequency of a starting menu or a starting bot or state task is based on the overall flow execution count. The frequency count and the corresponding color coding indicate the ratio of its execution count to the total number of flow executions.In the following example, customers interacted with the Main Menu and its Jump to Menu submenu as part of an inbound call flow’s Starting Menu five times out of five flow executions. No customer chose to disconnect the call:
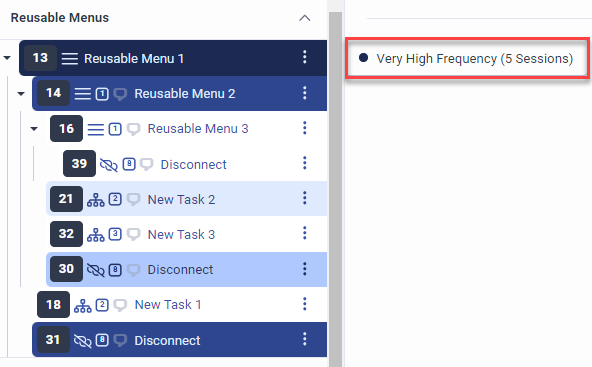
- For Reusable Menus, frequency means the number of unique bot flow sessions in which the reusable menu was executed. In other words, the execution frequency of a reusable menu is based on the overall flow execution count. The frequency count and the corresponding color coding indicate the ratio of the reusable menu’s execution count to the total number of flow executions.In the following example, customers interacted with the Jump to Menu submenu as part of an inbound call flow’s Starting Menu five times out of five flow executions.
- The Jump to Menu submenu transferred the customers to the designated Reusable Menu 1 five out of five times. Architect counts a specific reusable menu item only once per session. So, although a customer interacted with Reusable Menu 1 twice during the third call, Architect only counted these two interactions as one.
- Customers navigated to Reusable Menu 2 three times.
- Customers disconnected the call three times in the number 31 Disconnect submenu and twice in the number 30 Disconnect submenu.
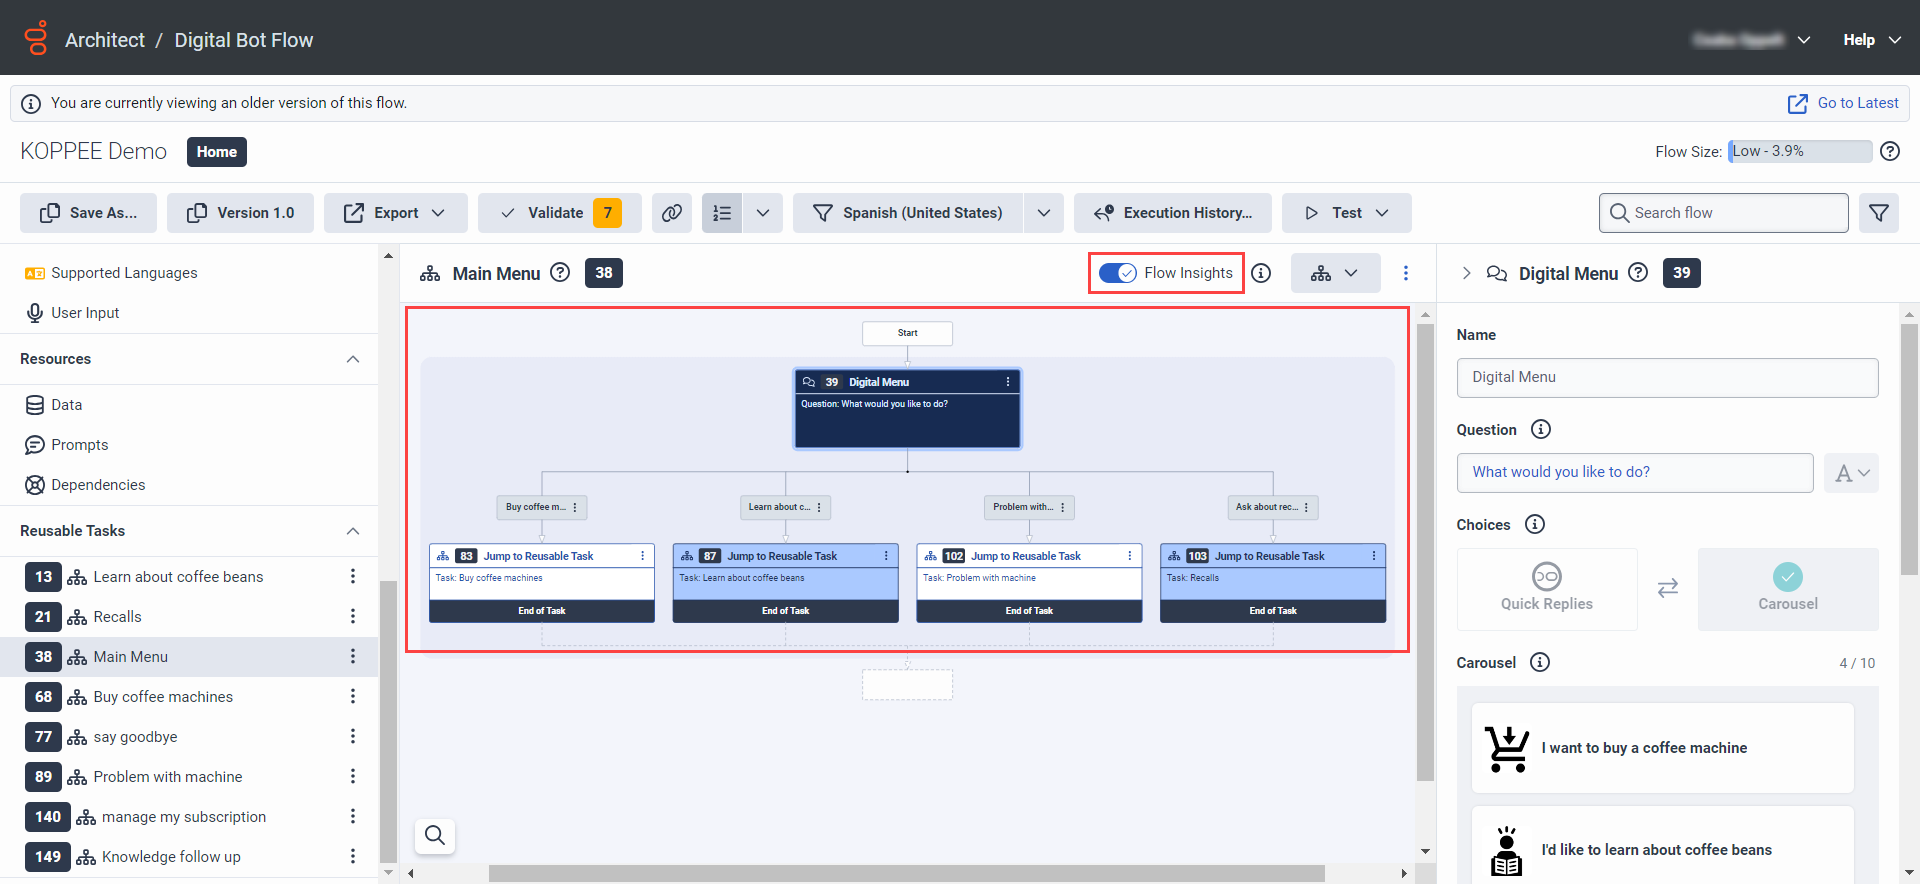
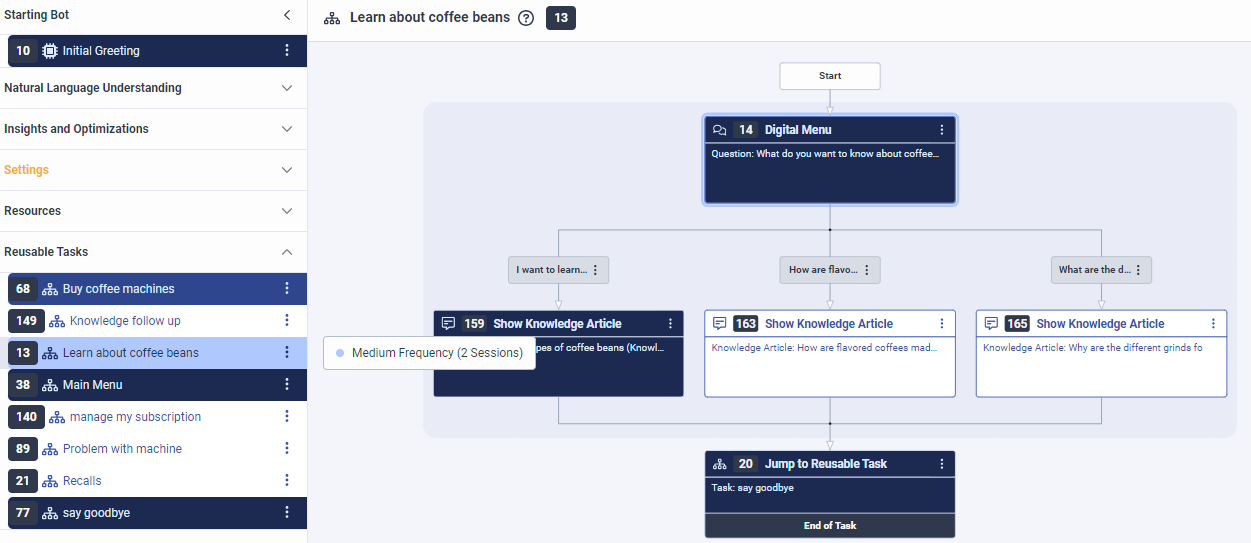
- For Reusable Tasks, frequency means the number of unique bot flow sessions in which the reusable task was executed. In other words, the execution frequency of a reusable task is based on the overall flow execution count. The frequency count and the corresponding color coding indicate the ratio of the reusable task’s execution count to the total number of flow executions.In the following example, customers interacted with the Starting Bot task of a digital bot flow five times (sessions). The Starting Bot task transferred the customers to the Main Menu reusable task at a very high frequency (five out of five times). Then, customers chose the Learn about coffee beans reusable task twice and the Buy coffee machines reusable task three times out of the five bot flow sessions.
Click the image to enlarge.
- For actions within the starting bot task, reusable menus, and tasks, frequency means the number of unique bot flow sessions where the action was executed for all possible entry points. In other words, Architect measures the action’s execution count against the total number of times the parent menu or task was executed.In the following example, customers interacted with the Starting Bot task of a digital bot flow five times (sessions). The Starting Bot task transferred the customers to the Main Menu reusable task at a very high frequency (five out of five times). Then, customers chose the Learn about coffee beans reusable task twice out of the five bot flow sessions. Architect indicates that customers very frequently interacted with the Digital Menu action within the Learn about coffee beans task. The frequency count and the corresponding color coding of the Digital Menu action reflects the ratio of the action’s execution count (two) to the total number of times the Learn about coffee beans task was executed (two).
Click the image to enlarge.
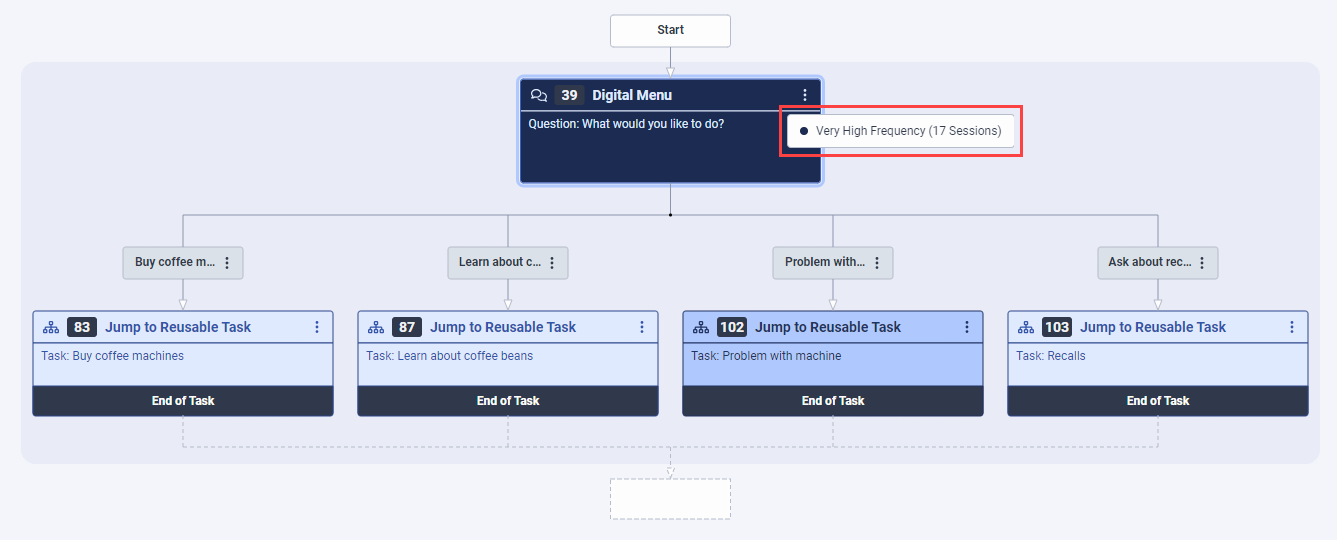
Imagine that the total session, or bot interaction, count for your bot flow is 17.Note: Use the Optimization dashboard in Architect to view the total bot interaction count of your bot flow. For more information, see View bot and digital bot metrics in the Optimization dashboard. Keep in mind that unlike Flow Insights data, the data about total bot interaction count in the Optimization Dashboard is not version-specific. Therefore, the data in the Optimization Dashboard might not match for bots that have multiple versions.Imagine that each session went through a Digital Menu action in a reusable task. The frequency level of this action is very high as Architect executed the action 17 times in 17 sessions.
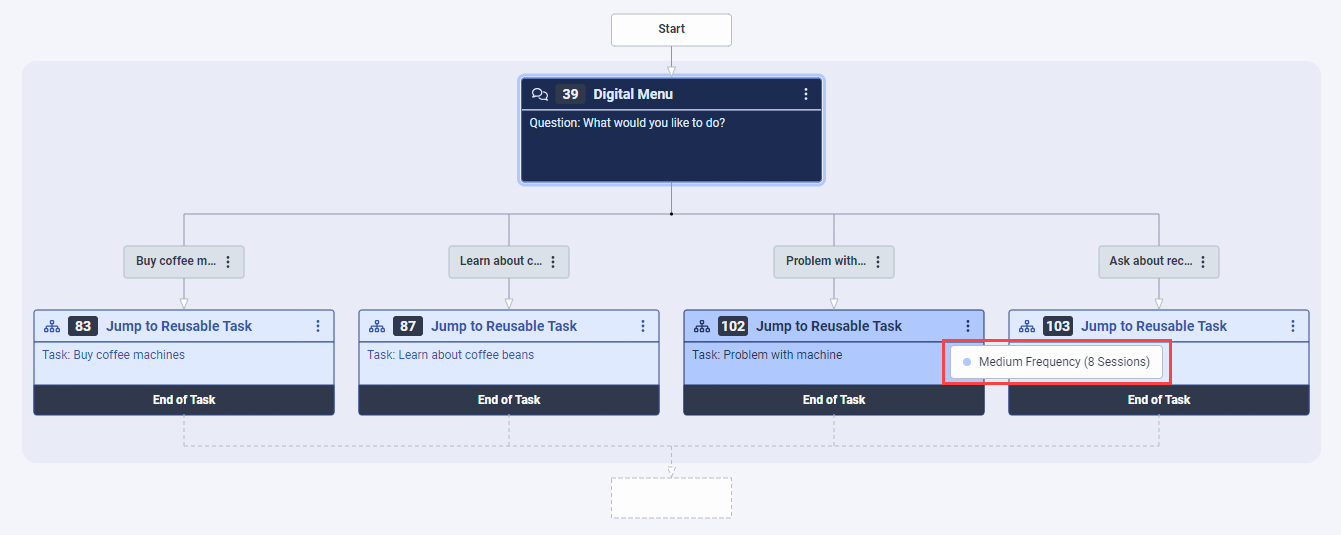
Click the image to enlarge. Only eight sessions went through a Jump to Reusable Task action in the same reusable task. As the frequency percentage is between 25% and 50%, the frequency level is only medium.
Click the image to enlarge.
- You have an Ask for Yes/No action and two Communicate actions in the main or Starting Bot sequence of a flow.
- You also have the same actions in a Reusable Task.
- The Starting Bot sequence has 10 sessions and six of them execute the first Communicate action. Architect calculates a high (60%) frequency score for the first Communicate action.
- The Reusable Task sequence has five sessions and three of them execute the first Communicate action. Architect calculates a high frequency score (60%) for this action too because the same percentage of sessions that went through the Reusable Task executed this Communicate action.
To display the frequency of a flow component and the number of sessions that the flow component was executed in, hover over the respective component.
Click the image to enlarge.
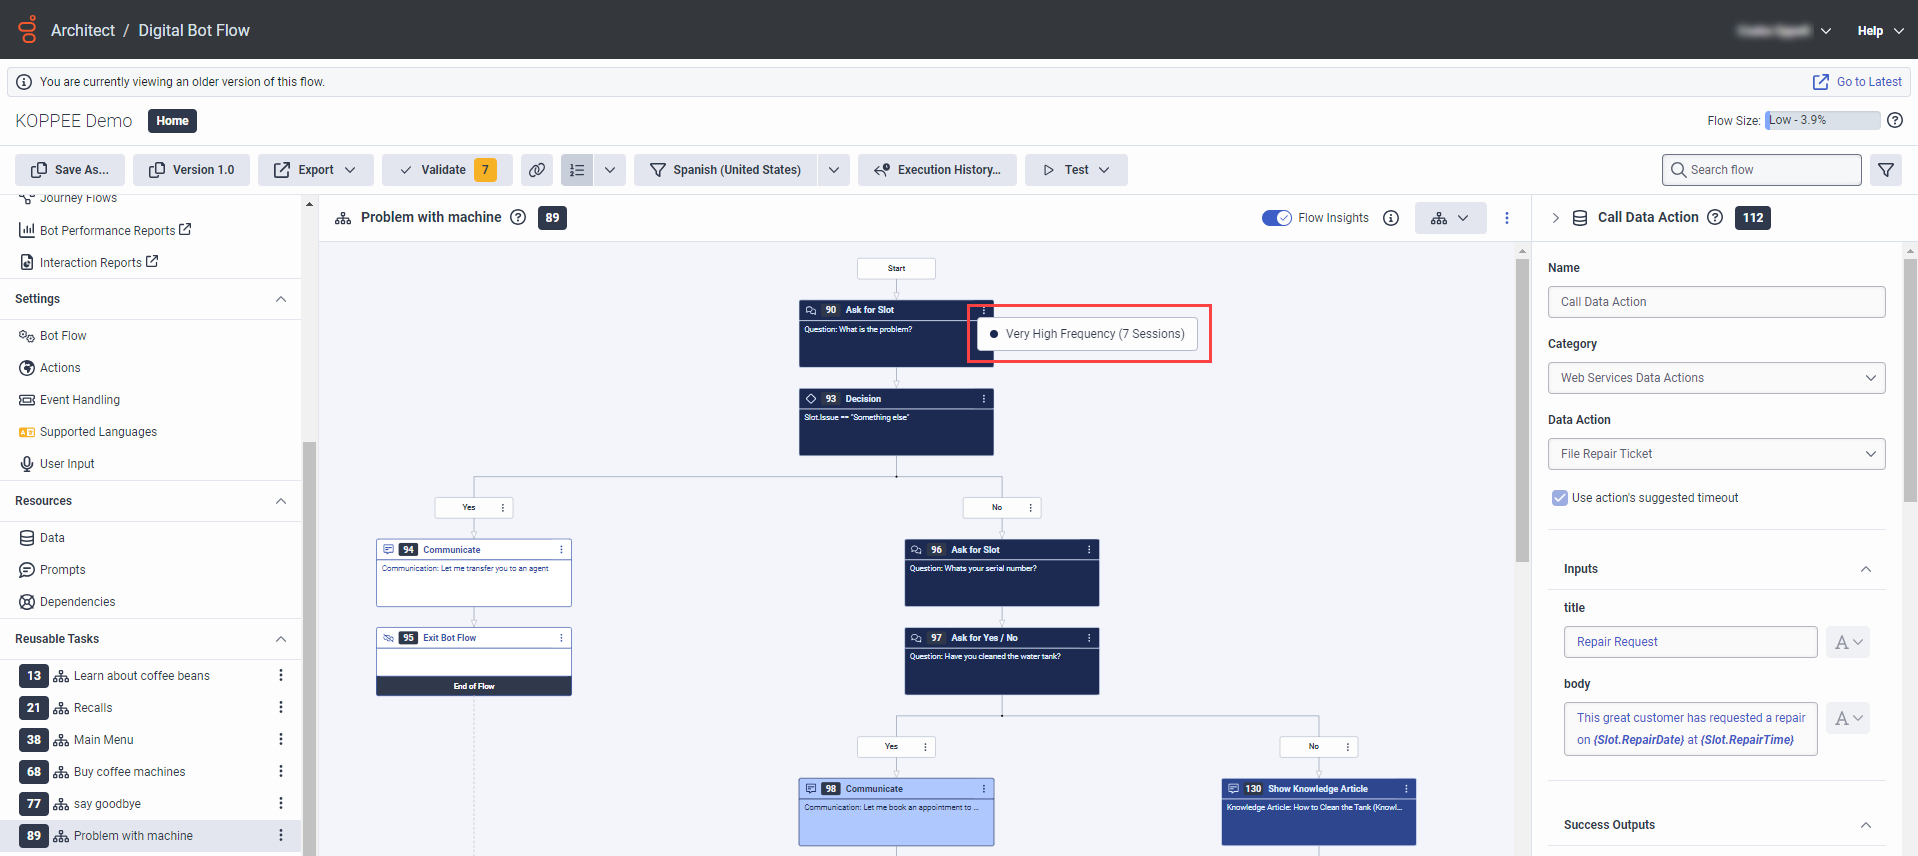
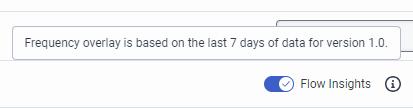
To see whether Flow Insights is enabled, or how many days of data the frequency overlay is based on, hover over the help icon next to the Flow Insights toggle. You can also see whether there is an error or not enough data.