
Use replay mode to troubleshoot an Architect flow
- Architect > Flow Instance > View permission
- Architect > Flow Instance > Search permission
In replay mode, you can see what happened when a flow ran and then troubleshoot and debug it.
- When a flow is in replay mode, you cannot edit it.
- For more information about the flow types that replay mode supports, see Historical execution data overview.
Click the image to enlarge.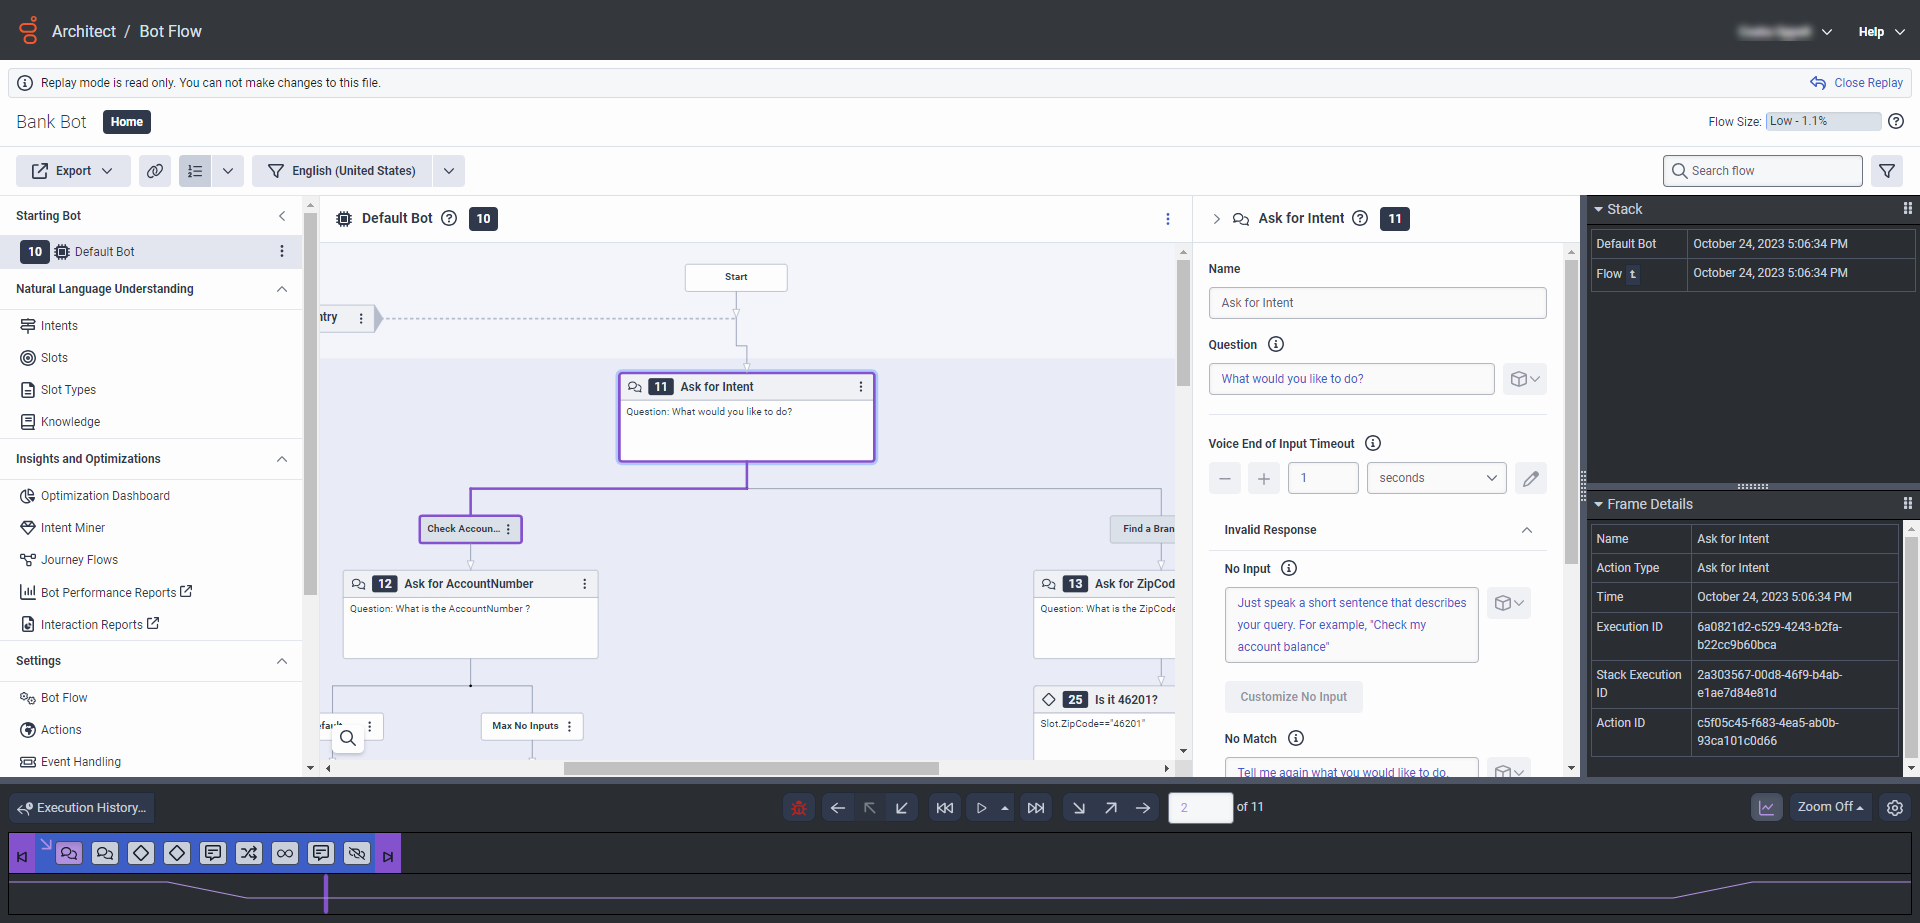
- From the Architect Home page, click or hover over the Flows menu and select the preferred flow type.
- Open the flow that you previously ran and want to debug and troubleshoot. The flow’s configuration page opens.
- If the flow opens in read-only mode, click Execution History.
- If the flow opens in edit mode, click the down arrow next to Save and perform one of the following steps:
- To view the execution history of previous versions of the flow, select Execution History from the list.
- To enter read-only mode, choose one of the following options:
- To save your work in progress as a new version of the flow, click Check In and then click Execution History.
- To revert to the previous version of the flow, click Revert and then click Execution History.
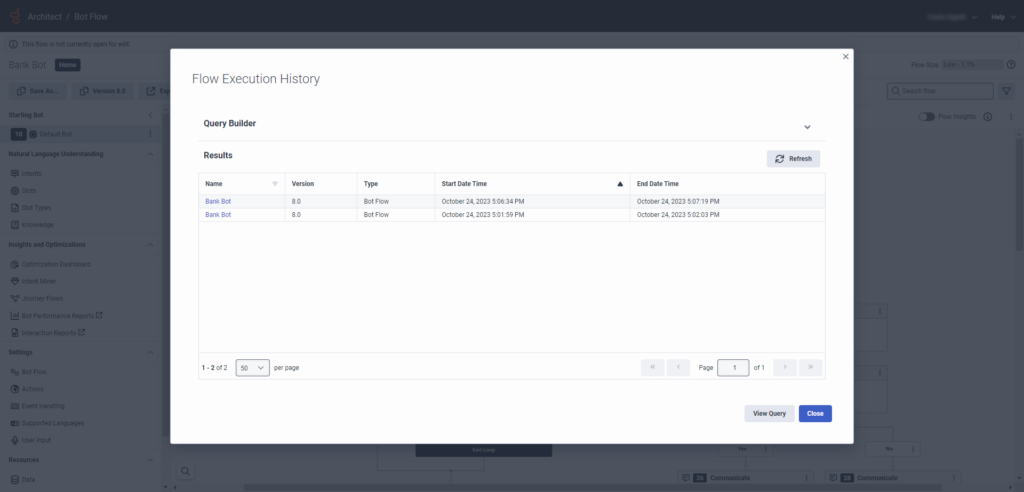
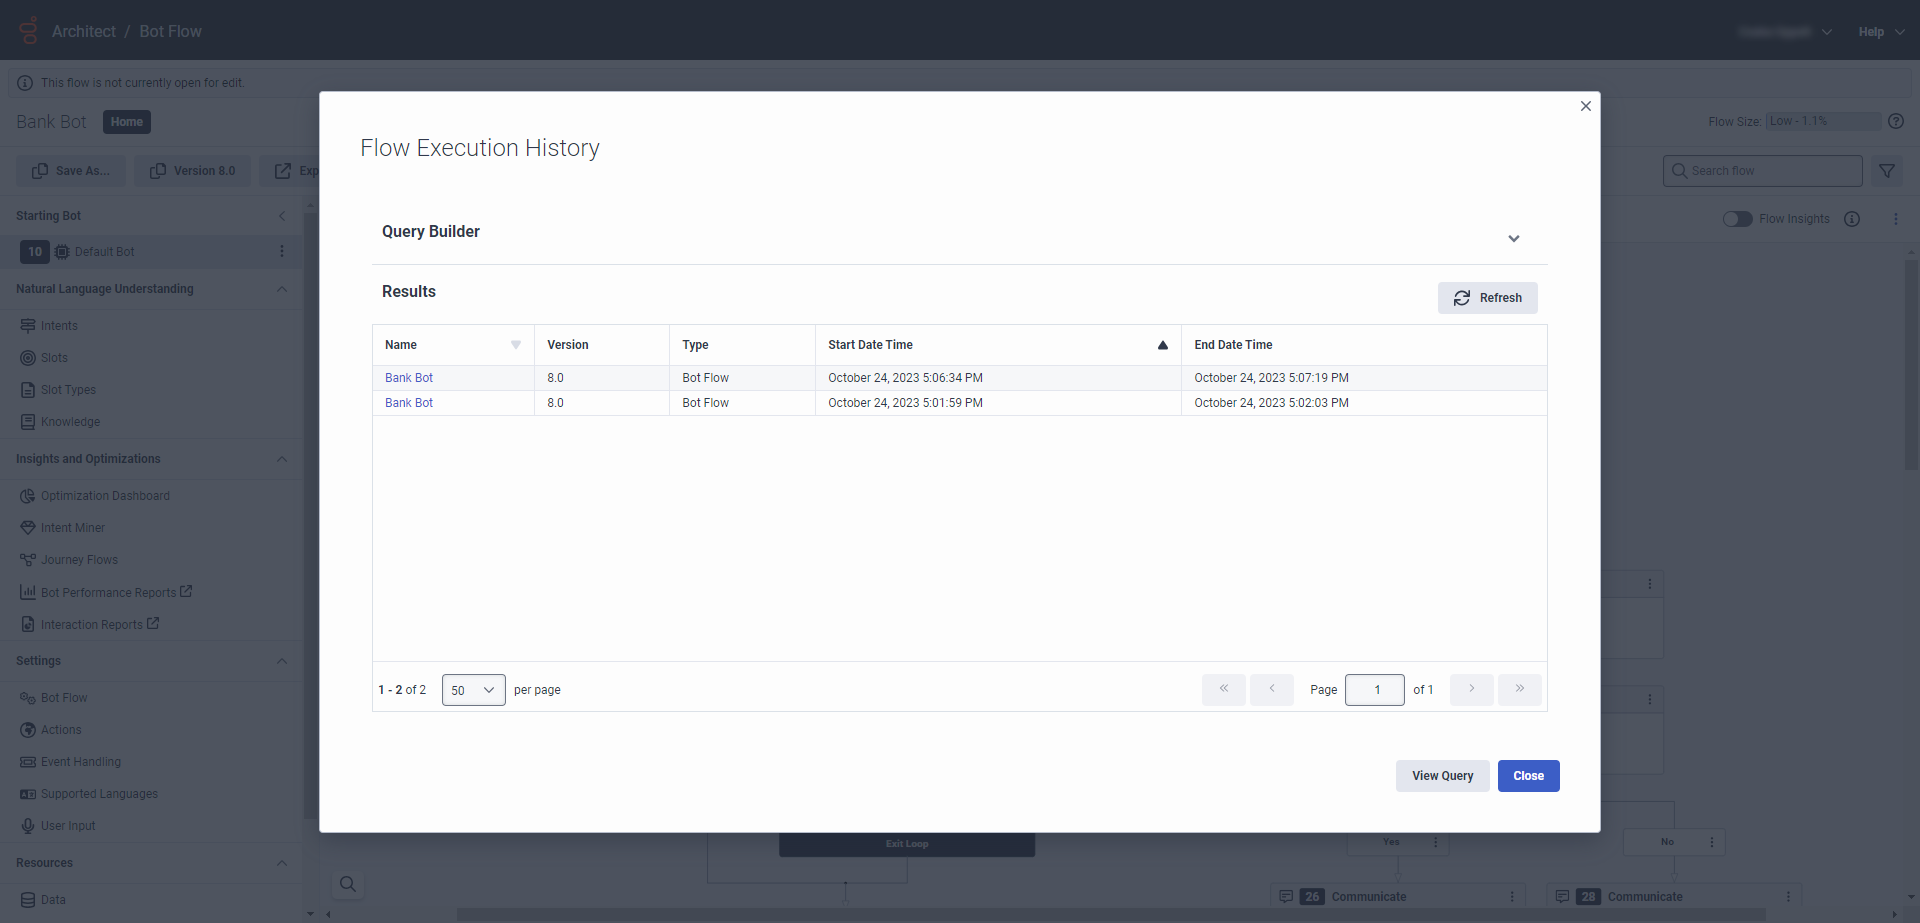
- From the Flow Execution History Results list, click the flow instance to replay. The flow instance opens in replay mode.Click the image to enlarge.
For a visual tour, see the following video:
To learn about features in replay mode, review the following sections.
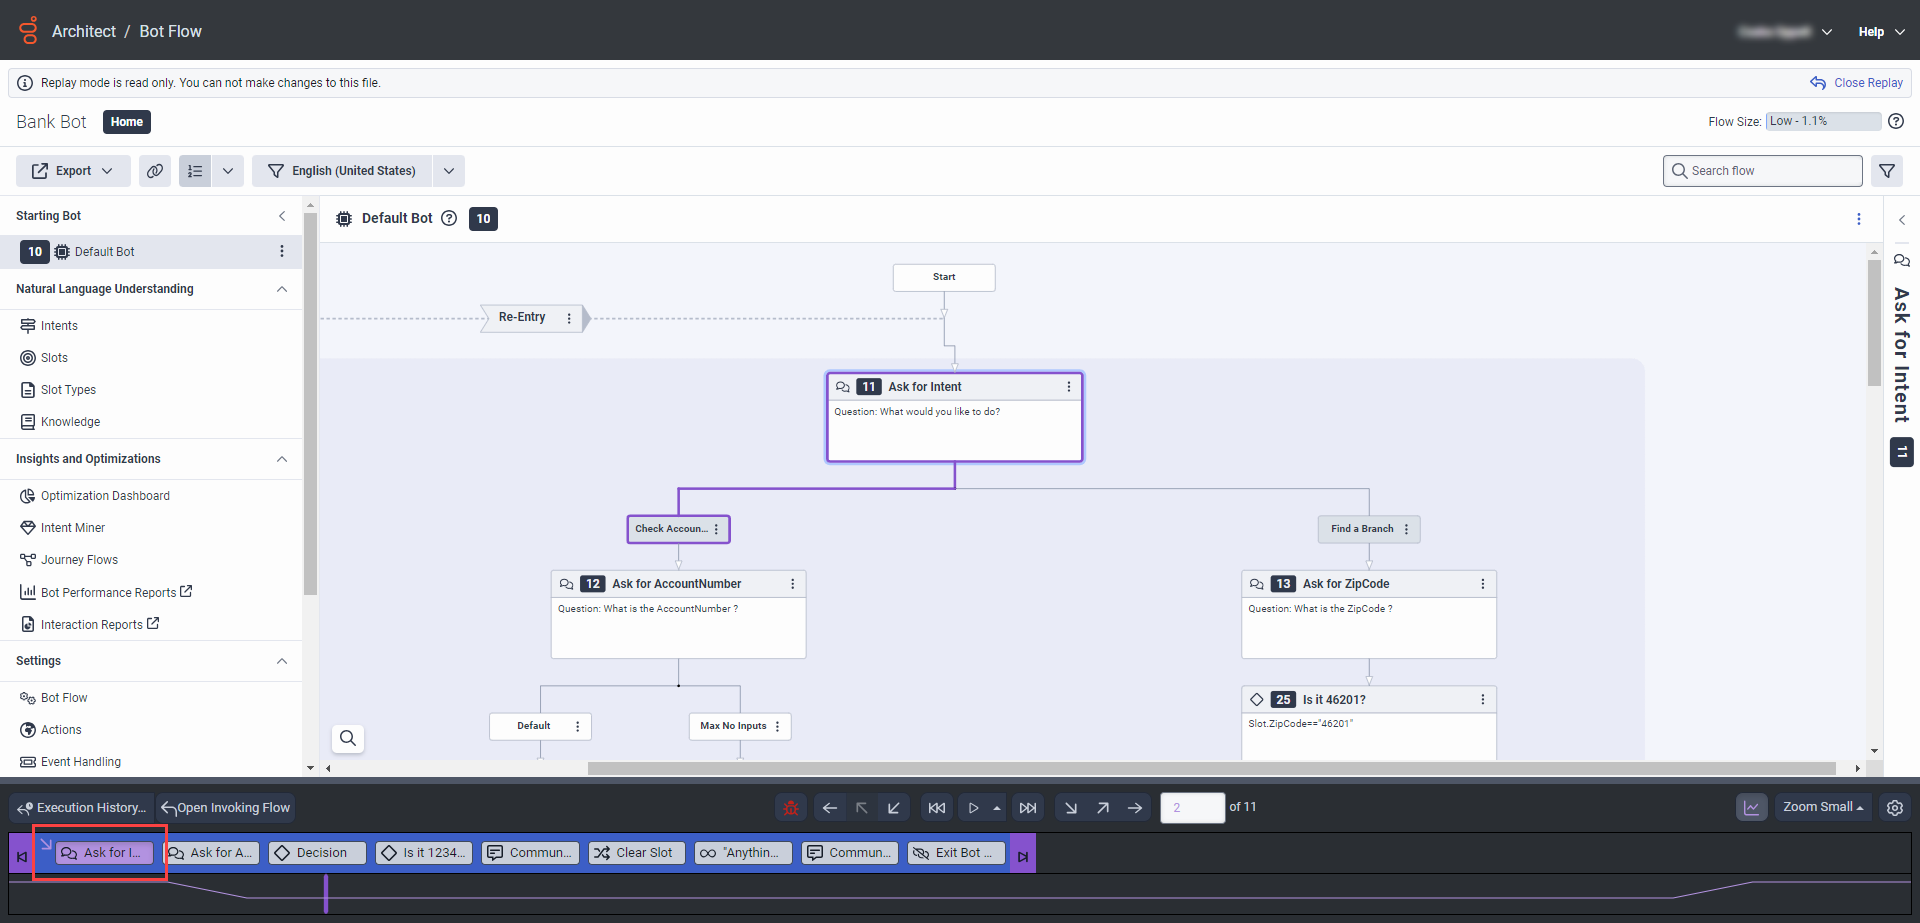
To debug a flow instance, use the replay controls to navigate across flow execution items (actions, tasks, or menus) in the replay timeline at the bottom of the page. The controls allow you to move back and forth to any point in the flow execution history. Replay actions are available from the toolbar and via customizable keyboard shortcuts. To change the default keyboard shortcuts, click Preferences.
![]()
| Replay command | Description | Keyboard shortcut |
|---|---|---|
| Play or pause |
Replay the flow instance from start to end, or to pause the replay. To select the playback speed, click and select the appropriate speed. You can choose between Fast, Default, and Slow. Note: If you already stepped through several items, the play command plays forward from the flow execution item you are currently on until the end or the next breakpoint if a breakpoint exists. |
Control + F7 |
| Step In | Step forward to the next flow execution item and enter into it to follow its execution step by step. | F11 |
| Step Over | Step forward to the next flow execution item and follow its execution without showing any component steps. | F10 |
| Step Out | When inside a flow execution item, complete any remaining component steps as a single step to step forward to the next flow execution item. | F9 |
| Step Back In | Step backward to the previous flow execution item and enter into it to follow its execution step by step. | Control + F11 |
| Step Back Over | Step backward to the previous flow execution item and follow its execution without showing any component steps. Execution replay stops when it encounters a breakpoint. | Control + F10 |
| Step Back Out | Step backward to the previous flow execution item from inside a flow execution item. | Control + F9 |
| Play to End | Resume flow execution replay up to the next breakpoint or until the end. | Control + F6 |
|
Play backwards to Start |
Play backwards to the start of the flow or a previous breakpoint if a breakpoint exists. | Control + F4 |
| Set or clear a breakpoint | Insert a breakpoint where you want the flow execution replay to stop. Remove a breakpoint you previously set. | |
| |
Use the up and down arrows to navigate between execution items. |
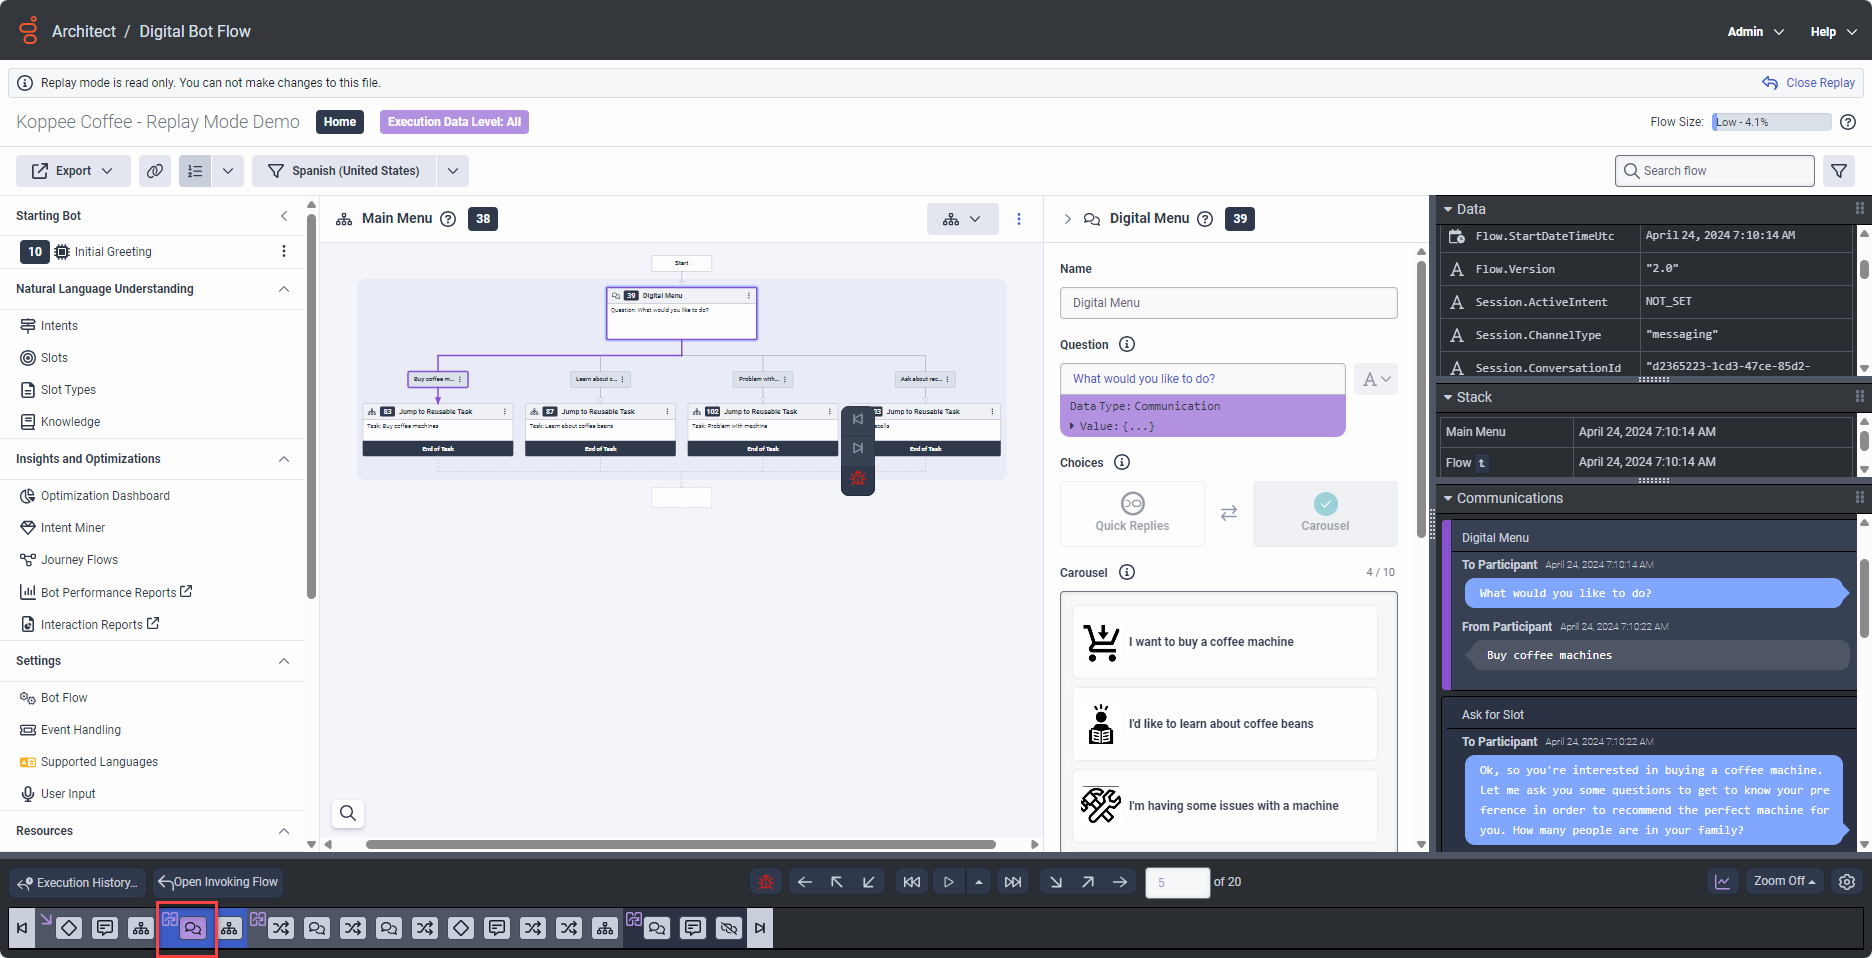
In the replay mode’s timeline tab at the bottom of the page, you can inspect and debug all flow execution items, and navigate across them. The following replay actions are available:
- Click the flow execution item (flow start, action, task, menu, or flow end) that you want to inspect. Architect displays the flow execution item in replay mode and highlights it in purple in the editor or design area. You can also use the replay controls to navigate between the items. For more information, see Use the replay controls.
Click the image to enlarge.
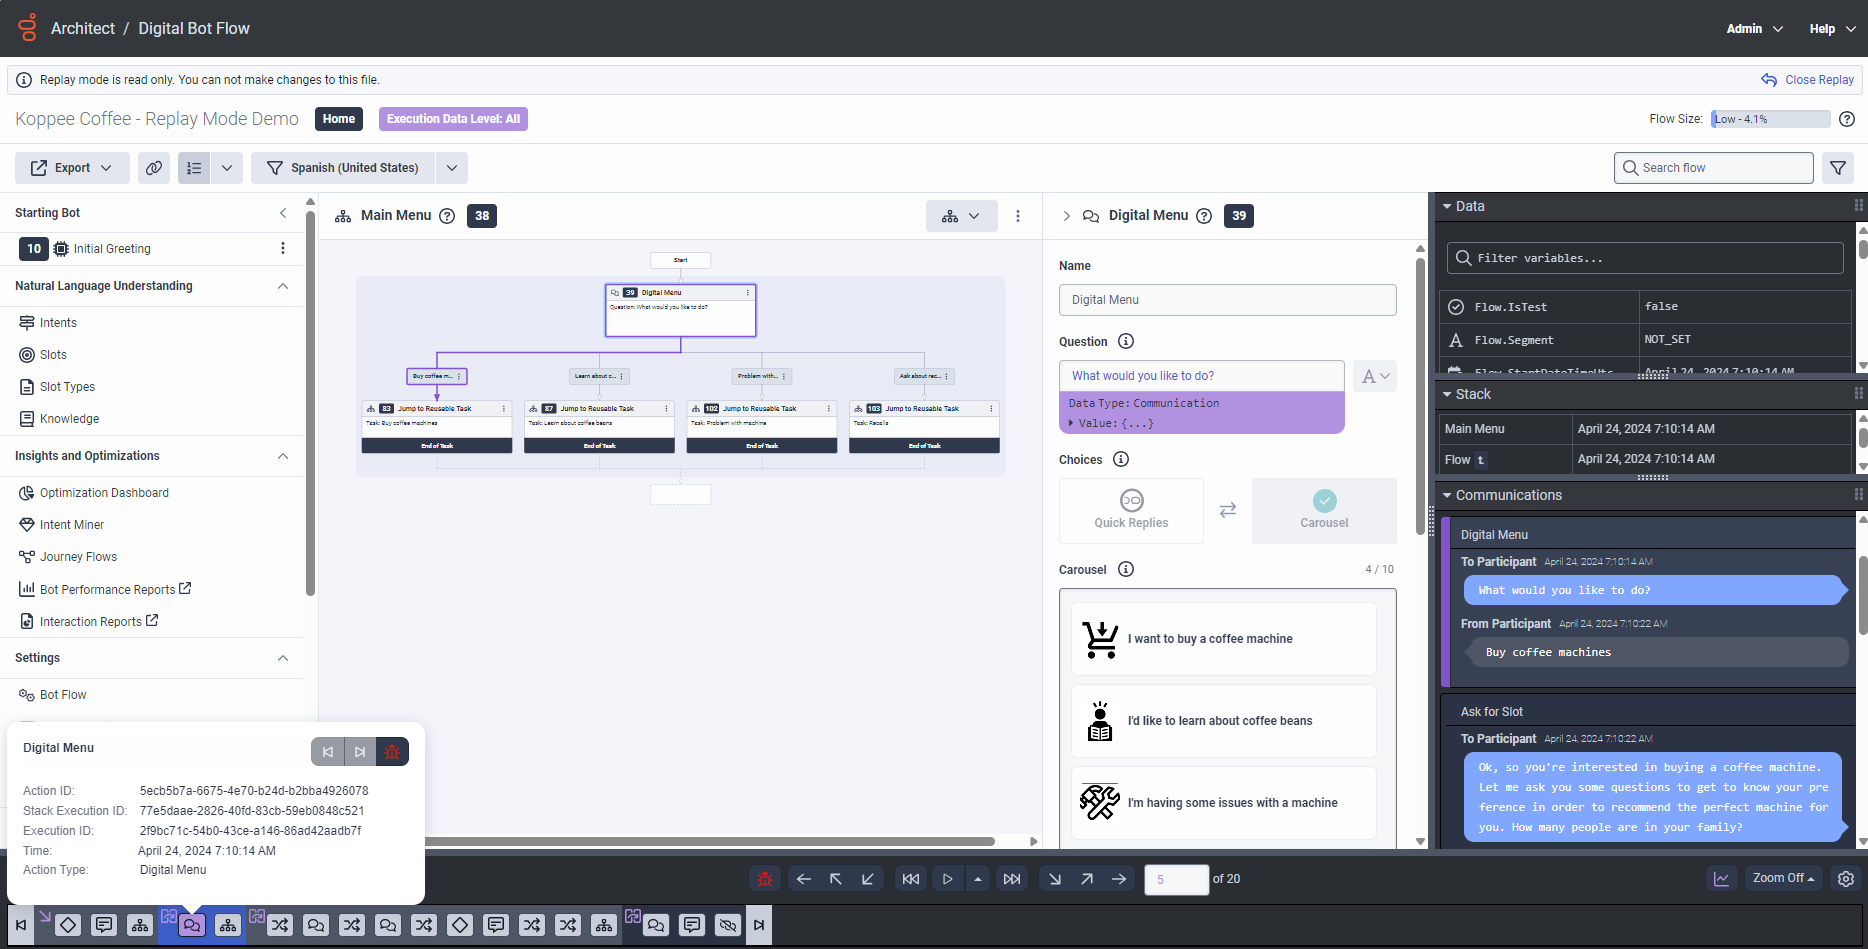
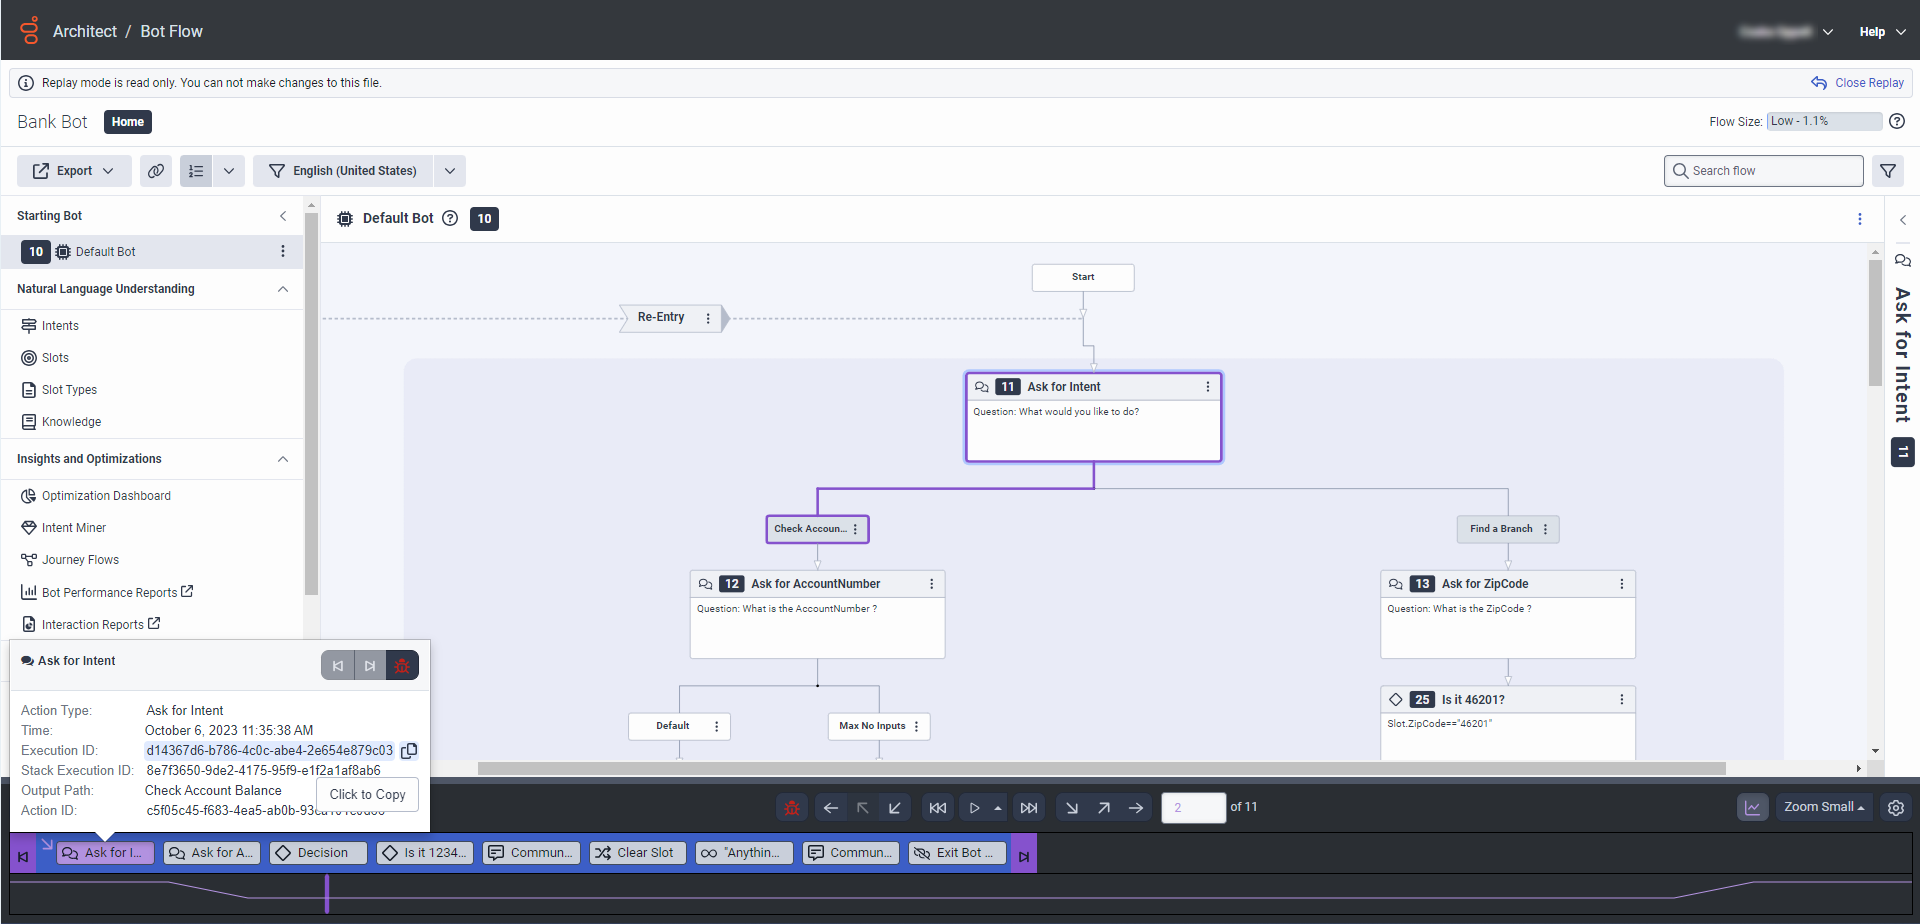
- Hover over the flow execution item that you want to inspect. Architect displays various information depending on the execution item that you want to inspect:
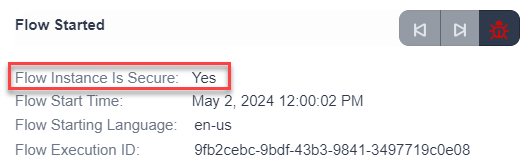
- Flow Started: Architect displays the flow execution ID, the flow’s starting language, and the flow’s start time. Flow Execution ID is the unique identifier that Architect uses to identify an instance of a flow that ran. Architect also displays whether the flow ran in a secure session or whether the flow was truncated because it contained more than 4,500 actions.
- Flow Ended: Architect displays the flow’s end time and the exit reason.
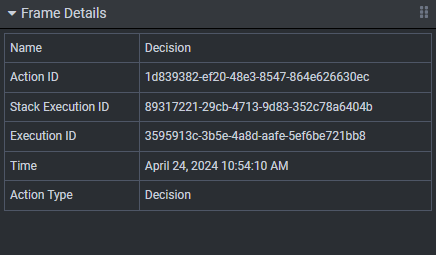
- For any other execution item, Architect displays the name and type of the action that the flow ran, the time of execution and the execution ID, the stack execution ID, the output path the flow followed, and the action ID. The stack execution ID is a unique identifier for where the execution item is in the flow’s execution stack. You can copy most of this information to the clipboard. Click to copy.
- Flow Started: Architect displays the flow execution ID, the flow’s starting language, and the flow’s start time. Flow Execution ID is the unique identifier that Architect uses to identify an instance of a flow that ran. Architect also displays whether the flow ran in a secure session or whether the flow was truncated because it contained more than 4,500 actions.
- To open the Flow Execution History dialog box, click Execution History. The dialog box gives you access to the Query Builder and, by default, to the list of flow instances whose Flow Id matches the Flow Id of the flow instance you are currently viewing. You can run a query based on other flow criteria such as Flow Error Code, Flow Warning Code, Invoking Flow Object Execution Id, or Flow Invoked Error. You can also query the historical data by Conversation Id, which is useful when there are many instances of the same conversation-based flow. For more information about building a flow execution query, see Build a flow execution history query.
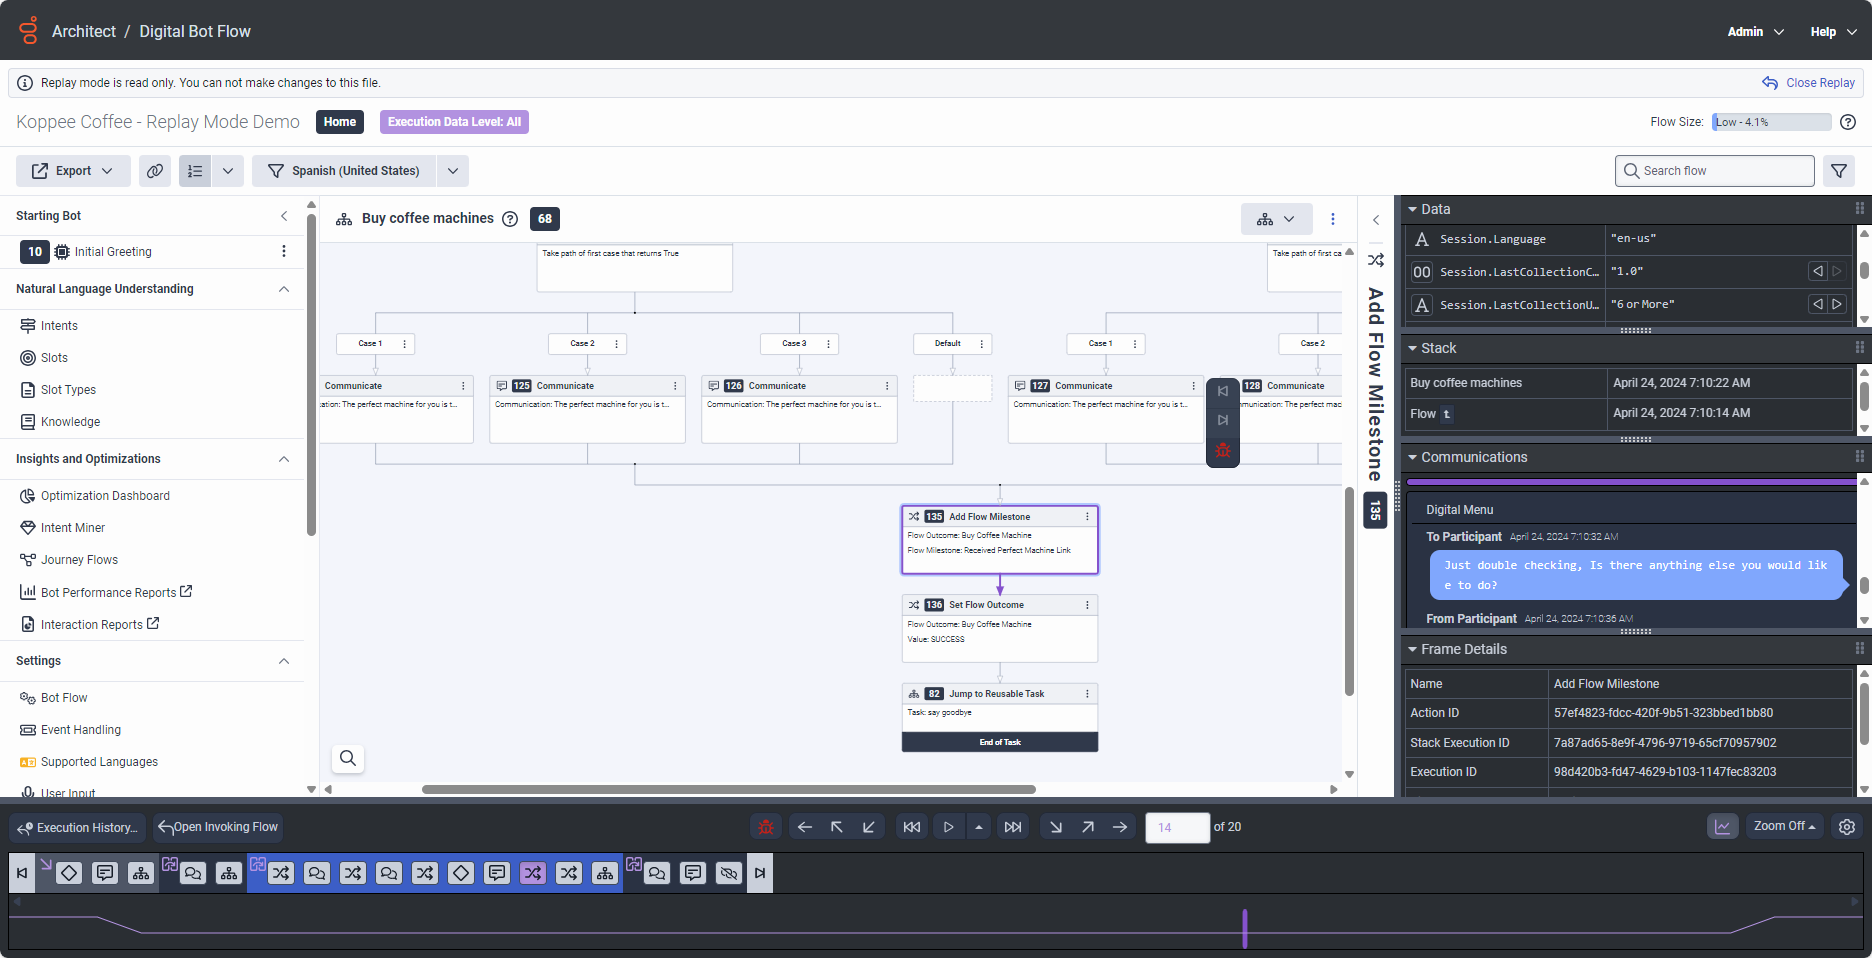
- To open the flow that invoked the flow you are viewing in replay mode, click Open Invoking Flow. This option is only available if historical execution data is available for the invoking flow. The amount of data that Architect displays for the invoking flow depends on the level of execution data at which Genesys Cloud recorded the invoking flow. Supported data types vary according to flow type. For example, you cannot see any communications data when you replay an inbound message flow, regardless of whether the execution data level at which Genesys Cloud recorded the flow would generally include such data.
- To open the workitem that invoked the workitem flow you are viewing in replay mode, click Open Invoking Workitem. A workitem can launch a workitem flow at the creation time, on workitem status change, or when a date-based event occurs for the workitem. This option allows you to navigate to the workitem that triggered the flow instance.
- To show or hide the Stack Graph, click .
- To adjust the timeline’s zoom level from no zoom to small, medium, and full zoom, click the Zoom drop-down.
- To change keyboard shortcuts or customize the replay mode view, click Preferences.
- Architect GUIDs
- Specific actions, menus, states, or tasks
- Variables
You can use various operators to narrow down your search. To select a search operator, click and select one of the following operators:
- Contains = Architect returns all search results that contain all the characters that you specify.
- Exact = Architect returns all search results that match the characters that you specify exactly.
- Starts with = Architect returns all search results that start with the characters that you specify.
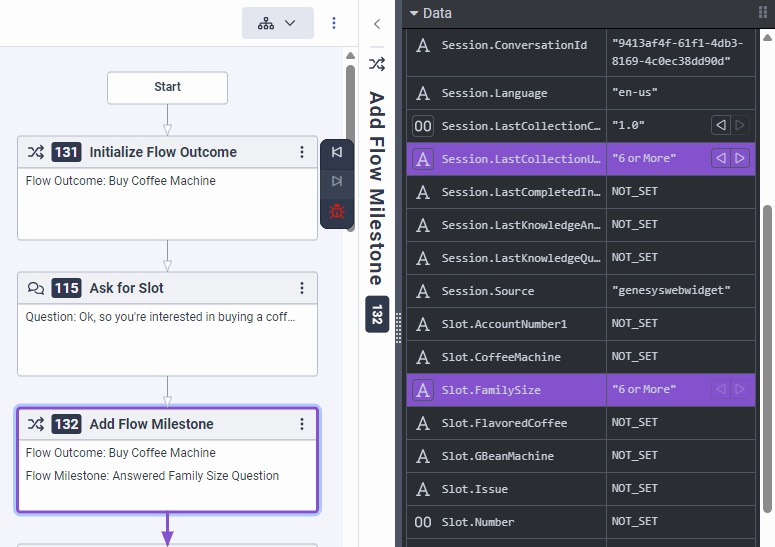
- Architect displays arrow buttons next to variables whose value changes during flow execution. See the string type variable named
Slot.FamilySizein the attached example. - You can set a breakpoint on such variables. To set a breakpoint, click the button that indicates the data type of the variable and select Set a breakpoint. For
Slot.FamilySize, the letterAthat precedes the variable name. - If the value of a variable of the JSON, string or collection data type exceeds the size limit that Genesys Cloud can store in execution data, Architect displays
ValueTooLarge. Because encrypted values can be very long, Architect often shows values of variables used in Set Secured Data actions asValueTooLarge. - For variable values in secure flows (because Genesys only reports execution data for such flows at the Base level) and values of variables used in Architect actions for secured or encrypted data, Architect displays
ValueRedacted. - Architects displays
ValueInvalidfor variables whose value was, for example, set by an expression or function that failed. For example, if a string value to be converted to a DateTime type was invalid, as inToDateTime("2009-01-10T06:30:").
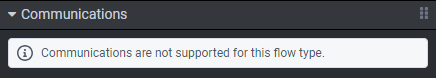
The Communications panel provides an easy way to see the entire communication thread that occurred when the flow ran. You can configure the panel to show either all communications or only communication that relates to the currently selected flow execution item.
The Communications panel is where you can see interactions between a flow and external participants. For example, message exchanges between a customer and a chat bot.
Click the image to enlarge.
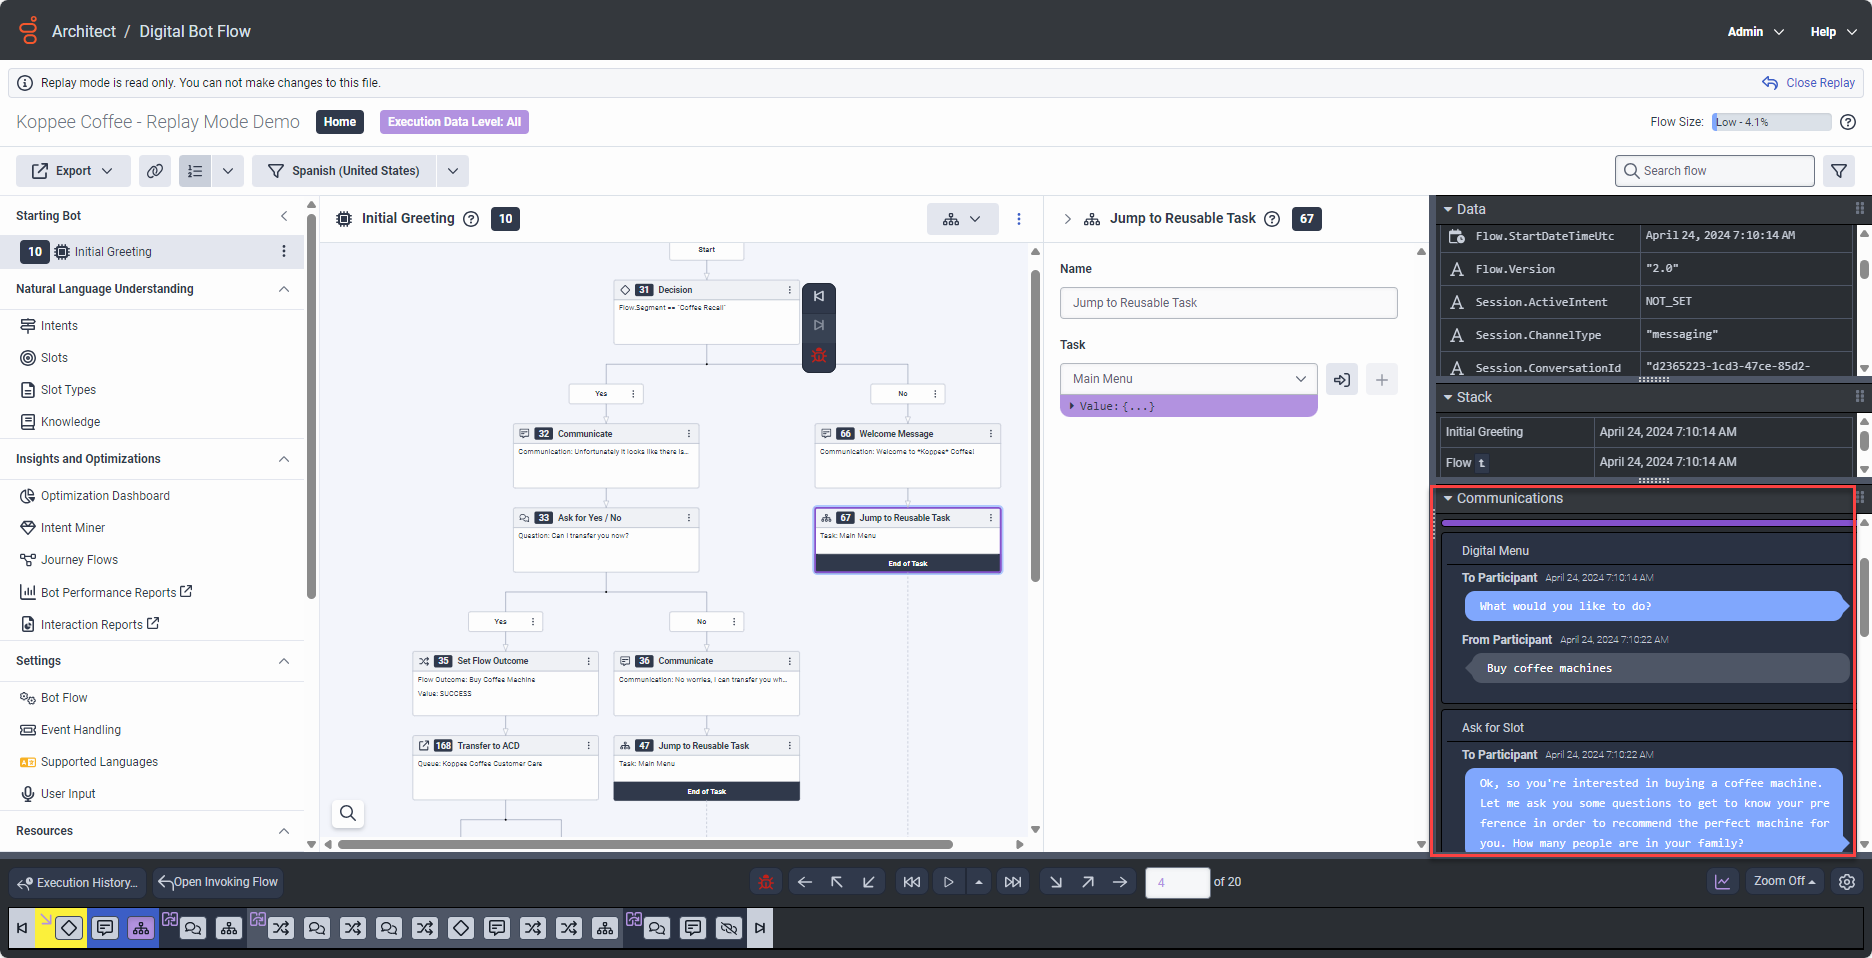
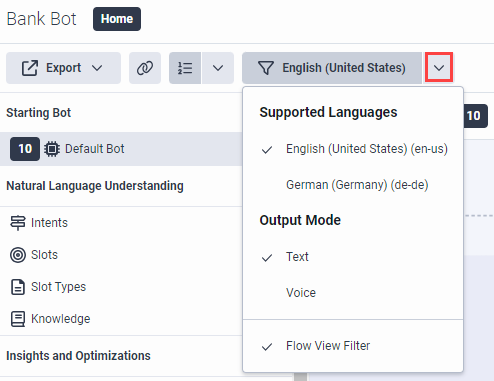
To switch between the flow’s default language and supported languages, click the down arrow next to the language filter and select the preferred language to view.
To work with element IDs, follow one of these steps:
- To show or hide element identification numbers, click Show or hide action, menu, task, and state IDs.
- To go to a specific element, click the down menu, select Go To, and select the appropriate ID.
To find flows that reference and use the current flow, click Find consuming flows.
When the flow instance you are replaying contains secure data, Architect displays the ![]() icon. To search for execution items that reference secure data, click the icon.
icon. To search for execution items that reference secure data, click the icon.
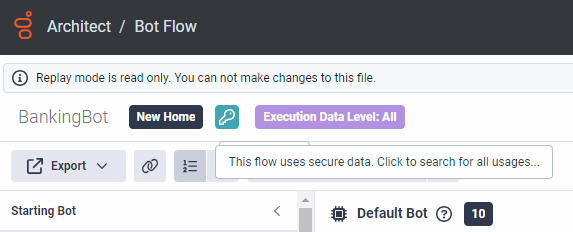
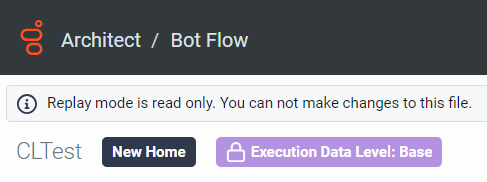
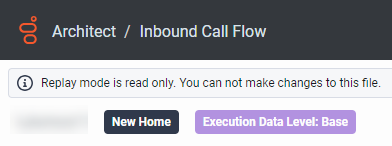
Architect displays the execution data level that Genesys Cloud used to store historical data for the flow instance.
In the following example, you can see that Genesys Cloud captured execution data at flow runtime at the Base level. Therefore, the user cannot access variable value data or communications data:
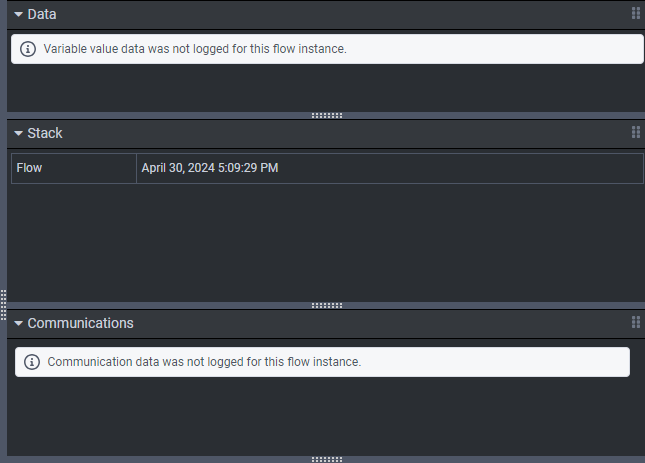
For more information about historical execution data and data settings, see Historical execution data overview, Manage execution data at the flow level, and Manage historical execution data.
To export flow execution or configuration data, click Export and click one of these options:
- Export execution data
- Export as .i3xxx
- Export as .yaml
For more information on how to access replay mode for a specific flow through the Operational Console when an event is generated, see Troubleshoot using the Genesys Cloud Operational Console.
- Click Preferences. The Preferences dialog box appears.
- Select Keyboard Shortcuts.
- Use the Search field to search for existing shortcuts.
- Use the Filter By field to narrow the list of displayed keyboard shortcuts:
- To display the keyboard shortcuts that you can use to perform actions within the flow, select Flow.
- To display the keyboard shortcuts that you can use to open the Keyboard Shortcuts view or toggle the Expression Help view, select Global.
- To display the keyboard shortcuts that you can use for the Replay commands, select Replay.
- To import shortcuts, click .
- To export shortcuts, click .
- To restore the default keyboard shortcuts, click Reset to Defaults.
- (Optional) You can define primary and secondary keystrokes for any shortcut.
- Click Save to save your changes or click Cancel to discard them.
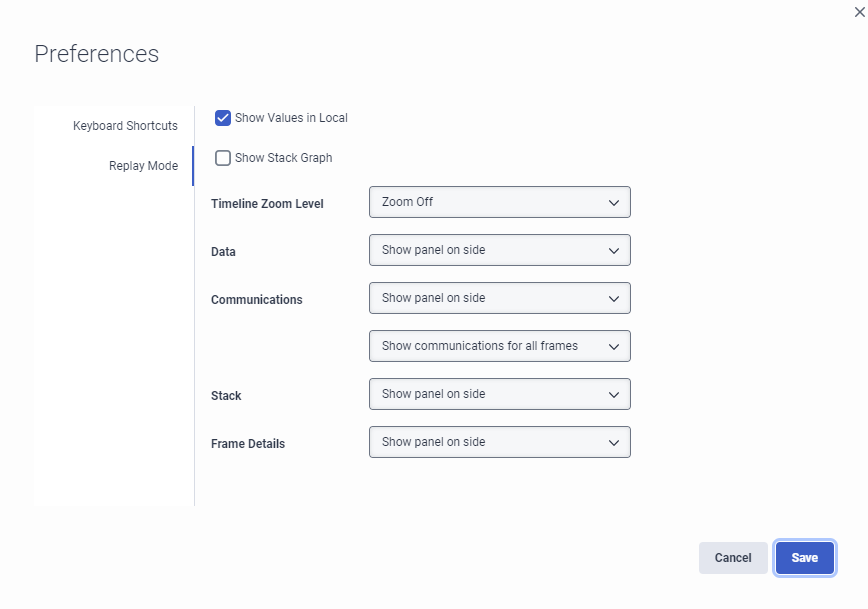
To customize the replay mode view, complete the following steps:
- Click Preferences. The Preferences dialog box appears.
- Select Replay Mode.
- Click Show Values in Local to use the display format for values that the local language in which the flow ran standardly uses. For example, show decimal values with the comma as the decimal separator if the local language was German, or use a local date and time display format instead of ISO-8601 to communicate date- and time-related data.
- Click Show Stack Graph to show a graph that indicates the levels of the stack the flow ran through.
- Select the preferred Timeline Zoom Level from the drop-down. The possible values are Zoom Off, Zoom Small, Zoom Medium, Zoom Full.
- From the Data drop-down, select whether to show the panel and if so, whether to show it on the bottom or on the side.
- From the first Communications drop-down, select whether to show the panel and if so, whether to show it on the bottom or on the side.
- From the second Communications drop-down, select whether to show communications for all frames or only for the current frame.
- From the Stack drop-down, select whether to show the panel and if so, whether to show it on the bottom or on the side.
- From the Frame Details drop-down, select whether to show the panel and if so, whether to show it on the bottom or on the side.
For more information, see Use the replay controls.