
Flows Performance Detail view
The following permissions:
- Analytics > Data Export > All
- Analytics > Flow Aggregate > View
- Architect > Flow > Search
- Architect > Flow > View
- Analytics > Insight Configurations > View
- Analytics > Speech and Text Analytics Aggregates > View
The Flows Performance Detail view displays statistics, including flow outcomes and milestones, for calls that enter a specific Architect flow. These statistics can help supervisors determine performance issues with a specific flow and gather data about self-service success.
Available columns
To view the available columns, see Flows Performance Detail view section in the View available columns in performance views by category article.
To view the consolidated list of available columns in the performance views, see Consolidated view of available columns in performance views.
To view the list of available columns in the performance views by category, see View available columns in performance views by category.
Set a default time zone in the workspace
You can set the default time zone in the analytics workspace before viewing any analytics view.
To set the default time zone in the workspace, follow these steps:
- Click Performance > Workspace.
- On the left side, from the Time zone drop-down menu, select the required time zone as the default time zone for the analytics workspace.
View data for a specific flow
- Click Performance > Workspace > Flows > Flow Outcome Performance.
- From the Flows Performance Summary view, click a specific flow or flow version.
- To see the most current data, click Refresh . This view does not update automatically.
- To save the view with your filter and column settings, click Save .
- To export the data in the view, click Export .
- To view a summary graphic of a metric, at the top of the page, click that metric.
To view more flow outcome information and open the Flows Outcome Detail view, click the Outcomes tab.
Customize the view
Customize the view to show only certain data. For example, you can choose to show only certain columns or filter to see information for certain flows. You can also save your filter and column settings as a saved view to quickly switch between different data of interest in the same view.
To customize analytics views, use the date filter.
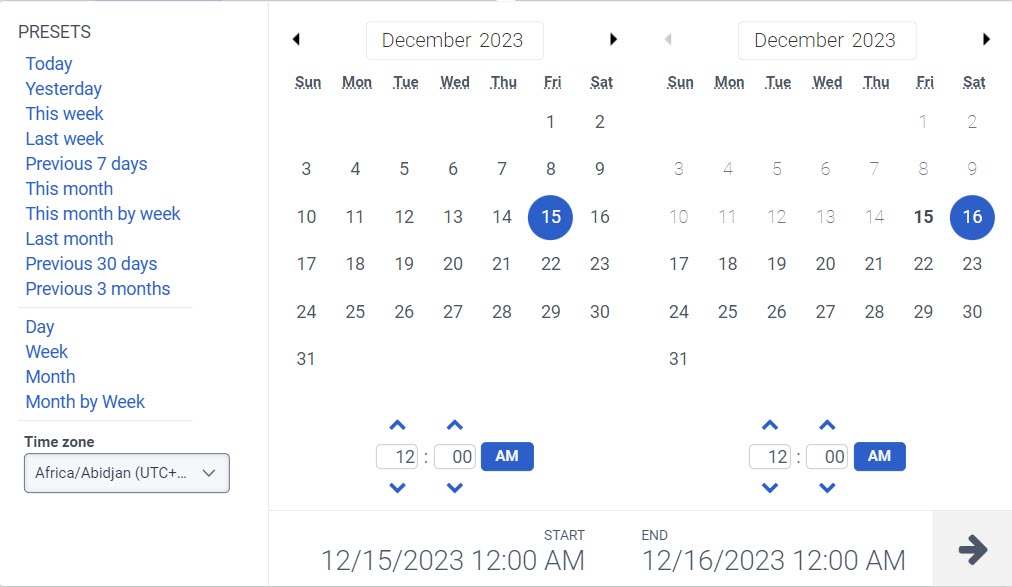
To filter metrics by date or configure a custom date range, use presets. When filtering metrics for this view, select any custom date range up to 6 weeks.
To use a preset to filter metrics, complete the following steps:
- To display the date filter, click the date.
- In the Presets list, select a preset date option.
Date presets
| Presets | Description |
|---|---|
| Today | Shows data for the time period that includes the current interval. |
| Yesterday | Shows data for the previous day. |
| This week | Shows data for a Sunday through Saturday time period. |
| Last week | Shows data for the previous week, Sunday through Saturday. |
| Previous 7 days | Shows data for the previous seven days. |
| This month | Shows data for the current month, with no extra days. |
| This month by week | Shows data for the current calendar month starting on Sunday and ending on Saturday, including extra days if the month does not start on Sunday or end on Saturday. |
| Last month | Shows data for the previous calendar month with no extra days. |
| Previous 30 days | Shows data for the previous 30 days. |
| Previous 3 months | Shows data for the previous 3 months. For example, Nov 1, 2022 – Jan 31, 2023. |
| Day | Shows data for a single 24-hour day. |
| Week | Shows data for a Sunday through Saturday time period. |
| Month | Shows data for the exact month with no extra days. If the current month is selected, you can see the data up to the current date. |
| Month by Week | Shows data for a calendar month starting on Sunday and ending on Saturday, including extra days if the month does not start on Sunday or end on Saturday. |
To use a custom date range to filter metrics, complete the following steps:
- Click the date to display the date filter.
- Select a start date and an end date on the calendar, and click the filter arrow .
To view data for a different time period using the same date presets, click the arrows on either side of the date display. ![]()
For example, to view data for the previous day, click the Day preset, and then click the arrow on the left side of the date.
To view data for a different time zone using the same date presets, from the Time zone drop-down menu, select the required time zone. You can create and save reports with the same selected time zone.
- To filter by media type, click the Filter icon
 .
. - Select the media type.
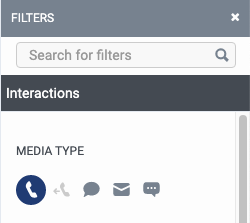
- When filtering you can select more than one media type. Click the relevant media type to select or deselect the type.
- You cannot select the voice and callback types at the same time.
- If you select voice, the callback option will be deselected. If you select callback, the voice interaction will be deselected.
- The available media types may vary from those shown above.
The selected media type icon is displayed above the column headers. For more information about various media types and their settings, see the Set behavior and thresholds for all interaction types section in the Create and configure queues.
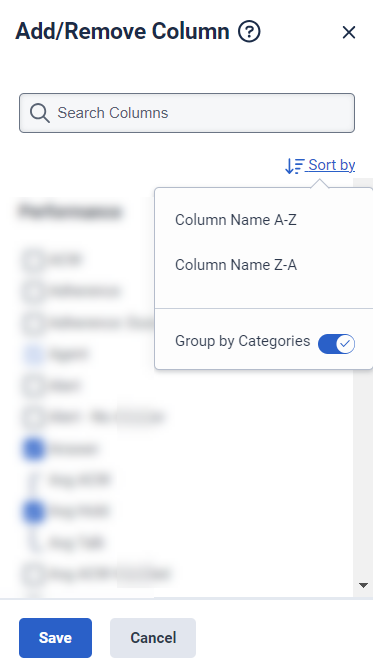
To show or hide columns:
- Click the Pick columns icon on the right side. The Add/Remove Column pane appears.
- (Optional) To sort the columns in ascending or alphabetical order, click Sort by > Column Name A-Z.
- (Optional) To sort the columns in descending or reverse alphabetical order, click Sort by > Column Name Z-A.
- (Optional) To categorize or uncategorize the columns, click Sort by and enable or disable the Group by Categories toggle. Click the image to enlarge.
- Search or scroll to select the columns you want to view. Note: You can also use keyboard navigation to choose the columns.
- Click Save. The selected columns appear on the screen. Note: The column selections appear only after saving the changes and do not apply to the table immediately.
To rearrange the columns, click a column header and drag it.
To reset a view to default column settings, click Reset view to defaults ![]() .
.
You can select up to 20 columns.
For more information about the metrics shown in the columns, see the Available Columns section in this article.
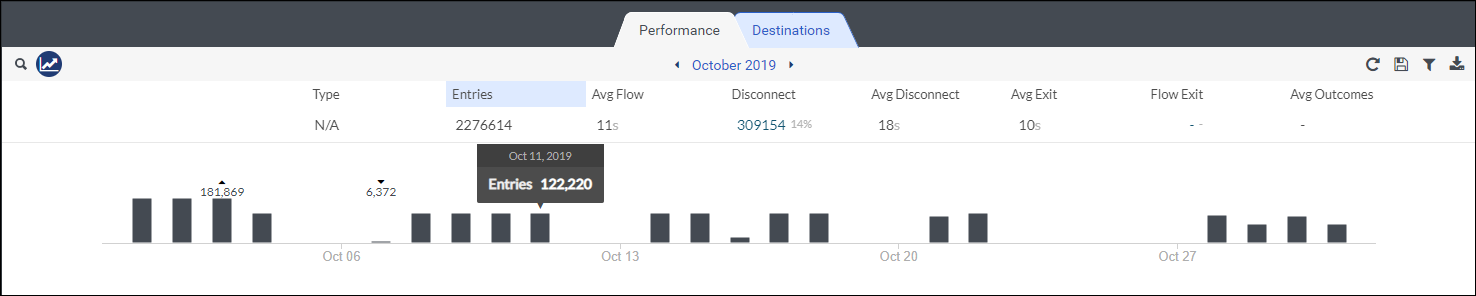
The summary row above the flow rows displays a graph of a metric for the flow. To choose which metric to display, click a metric above the graph. To see more metric options, show more metric columns. To see only data for certain flows, filter for those certain flows.
To see more information about the data, hover over the bars in the graph. The above a bar represents the largest amount for that time period, and the represents the lowest amount.
To filter by information about the flow, click Filters , and then search or scroll to select the filter you want to use.
| Filter | Description |
|---|---|
| DNIS | Displays information for interactions with the selected original DNIS number. This DNIS number was dialed at the beginning of the interaction.
|
| Session DNIS | Displays information for interactions with the selected DNIS number. The DNIS number could have been dialed any time during the interaction.
|
| ANI | Displays interactions with the selected ANIs.
|
| Direction | Displays information about interactions of the selected directions. |
| Initial Direction | Displays information about interactions with the selected initial direction. |
| Type | Displays information for the selected flow type such as inbound call, outbound call, secure call, inbound chat, inbound email, inbound message, digital bot, bot, and voice survey. |
| Flow Version | Displays statistics for the selected flow version. Enter in the full version number, for example, 25.0. |
| Destination Type | Displays the selected type of flow destination: ACD, group, number, user, ACD voicemail, user voicemail, flow, and secure flow. |
| Flow Outcomes | Displays statistics for the selected flow outcomes. For more information about flow outcomes, see Add a flow outcome. |
| Flow Outcome Value | Displays statistics for the selected flow’s success or failure outcome value. For more information about flow outcome values, see Set Flow Outcome action |
| Wrap-up | Displays interactions that have the selected wrap-up codes set during the flow. |
| To | Displays information for interactions sent to the selected email addresses.
|
| From | Displays information for interactions sent from the selected email addresses.
|
| Provider | The source provider for the conversation. For example, Genesys Cloud EMAIL, Edge, and so on. |
| Message Type | Displays metrics for interactions of the selected ACD message type. This filter only appears if you set the media type filter to Message. If you do not have any message types selected, the view displays information for all message types. Genesys Cloud currently supports the following message types: Facebook, Instagram, Line, Open, SMS, Web Messaging, WhatsApp, and X (Twitter). Note: Line message type is deprecated. But we still support display filtering. |
| Flow Milestones | Displays information about interactions with the selected flow milestones. |