Agent Timeline Detail view
The following permissions:
- ui > supervisorAgentDetails > view
- directory > user > view
- analytics > userDetail > view
To view the interactions portion of the timeline:
- analytics > conversationAggregate > view
- analytics > conversationDetail > view
To select the metrics, require one of the following:
- analytics > userAggregate > view
- analytics > conversationAggregate > view
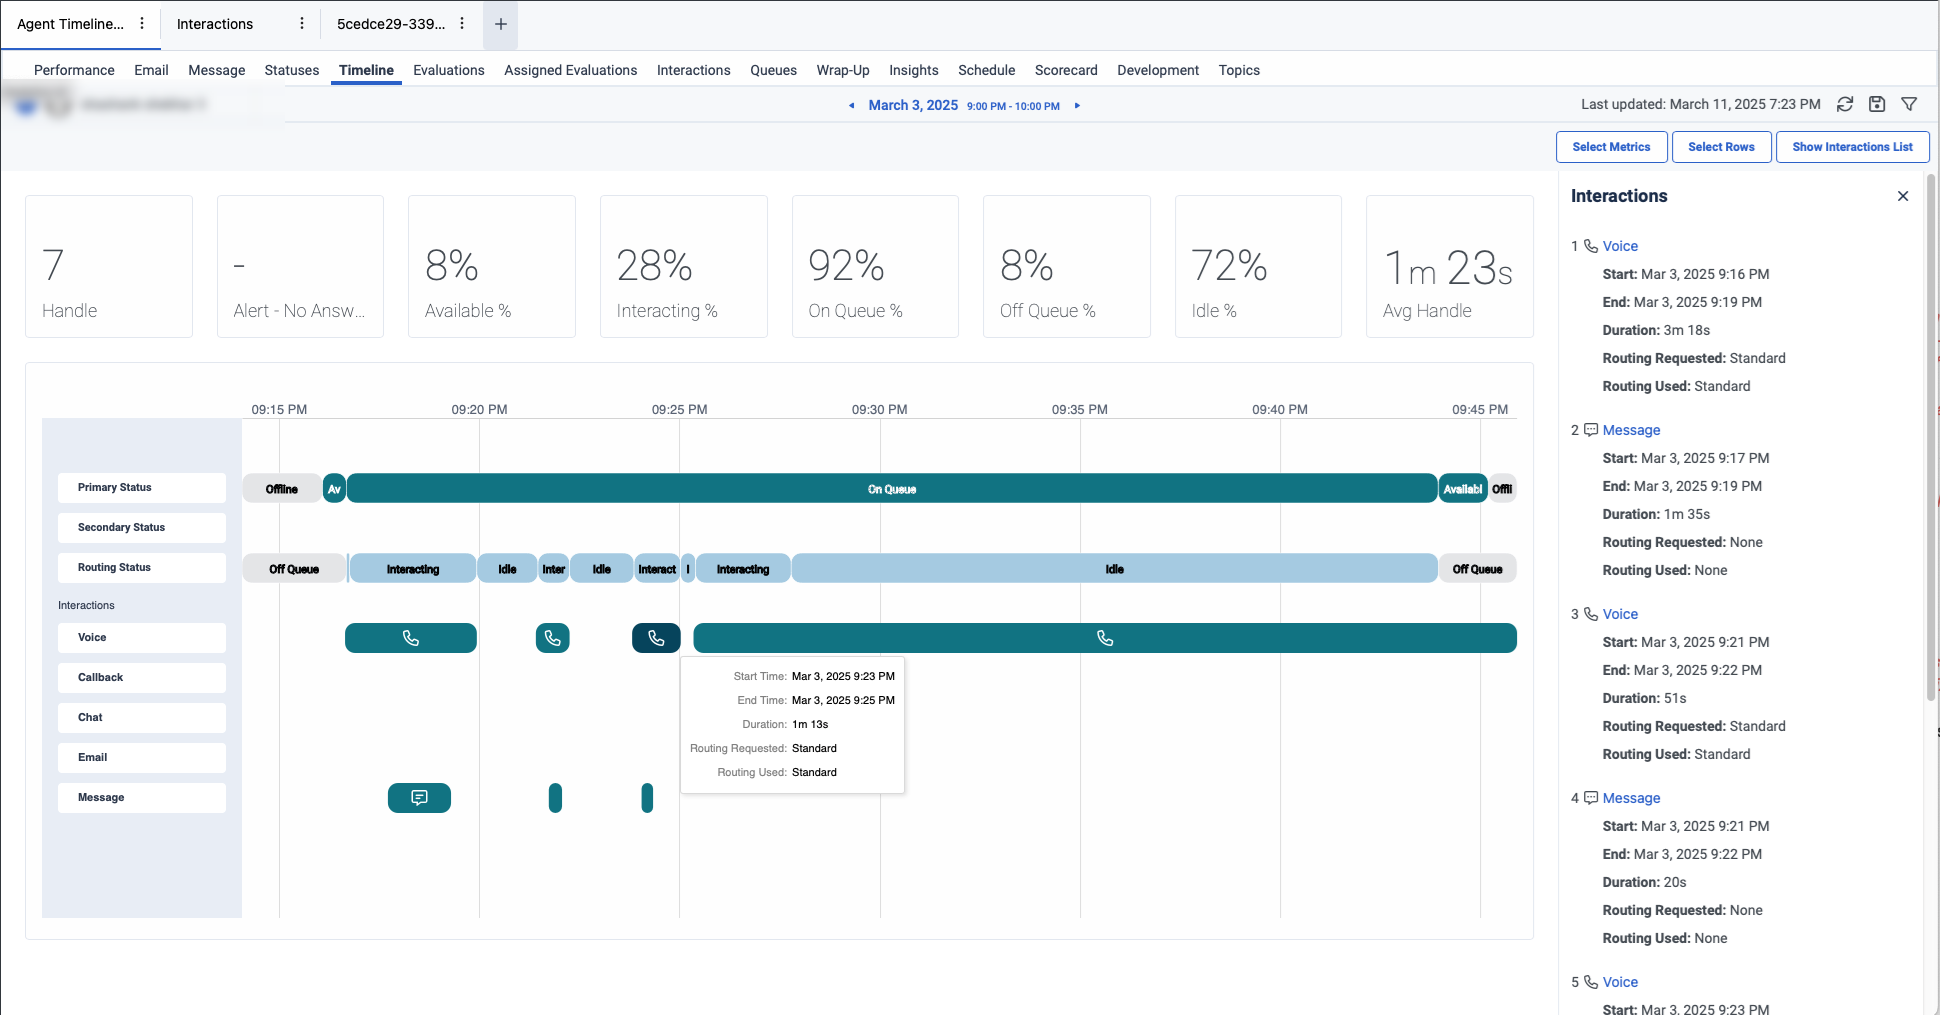
The Agent Timeline Detail view provides a detailed visual representation of the conversations handled by the agents. This view enables the supervisors to gain increased visibility into the activities of the agents. The supervisors can see how the sequence of voice conversations handled by the agents is interwoven with the overlap of multiple simultaneous digital interactions.
By default, this view provides details about primary status, secondary status, routing status, and various interactions such as voice, callback, chat, email, and message.
To view the agent timeline details:
- Click Performance > Workspace > Contact Center > Agent Performance.
- Click Menu > Analytics > Analytics Workspace.
- In the Default section, search for Agent Performance and then click the view name to open it.
- From the Agents Performance Summary view, click an agent name. The Agent’s Performance Detail view displays.
- Click the Timeline tab. The Agent Timeline Detail view appears.
 To see the most current data, click Refresh .
To save the view, click Save View .
You can zoom in and out of the time range in the timeline. For example, you can see that the 9–10 PM time interval on March 3rd is selected in the date picker. However, the timeline is zoomed in to just before 9:15 and just after 9:45 PM. If you zoom out, you can see the whole hour from 9 to 10 PM. If you have zoomed in to shorter than an hour, you can scroll horizontally to the 9:00 PM boundary to the left and the 10:00 PM boundary to the right.
To zoom in and out in the Windows OS system, you can hold the Control (Ctrl) key and scroll with your mouse or trackpad. To scroll horizontally in the Windows OS system, you can use a trackpad. To zoom in and out in the Mac OS system, you can hold the Command (CMD) key and scroll with your mouse or trackpad. To scroll horizontally in the Mac OS system, you can hold the shift key and scroll with your mouse or trackpad.
- The timeline does not show any results for primary status, secondary status, or routing status if the agent has had long periods of inactivity.
- You can view data only for up to seven days.
- If the number of interactions within the selected time range is more than 200, a warning message is shown at the top and a link is given to the Agent Interaction Details view page.
Customize the view
To show only specific data, customize the agent timeline detail view. For example, you can choose to view only certain metrics or filter to see certain types of interactions.
To customize analytics views, use the date filter.
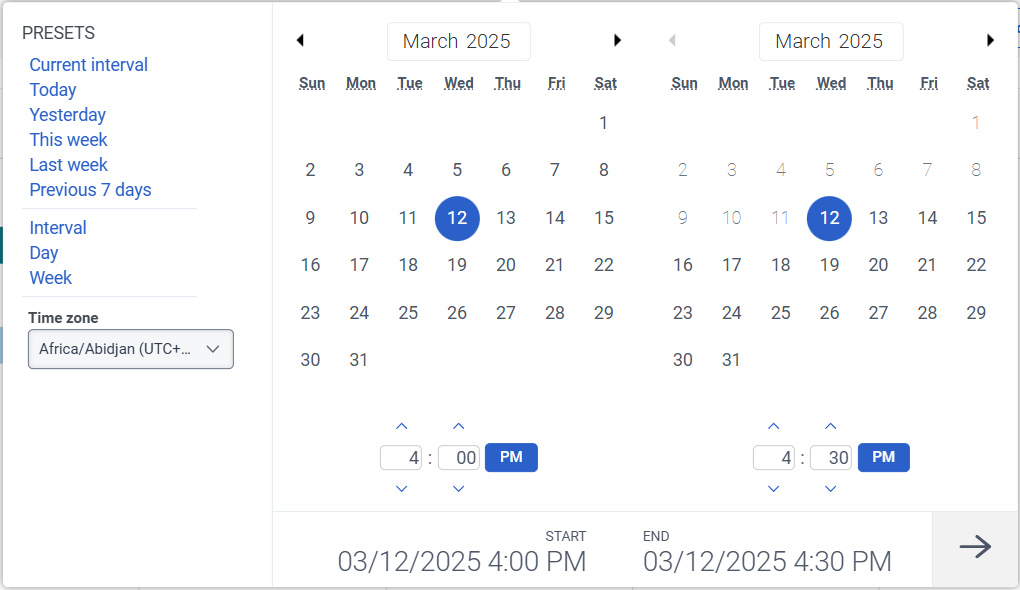
To filter metrics by date or configure a custom date range, use presets. When filtering metrics for this view, select any custom date range up to 7 days.
To use a preset to filter metrics, complete the following steps:
- To display the date filter, click the date.
- In the Presets list, select a preset date option.
Date presets
| Presets | Description |
|---|---|
| Current interval | Shows data for the current 30-minute time period. |
| Today | Shows data for the time period that includes the current interval. |
| Yesterday | Shows data for the previous day. |
| This week | Shows data for a Sunday through Saturday time period. |
| Last week | Shows data for the previous week, Sunday through Saturday. |
| Previous 7 days | Shows data for the previous seven days. |
| Interval | Shows data for a 30-minute time period. |
| Day | Shows data for a single 24-hour day. |
| Week | Shows data for a Sunday through Saturday time period. |
- To use a custom date range to filter metrics, complete the following steps:
-
- Click the date to display the date filter.
- Select a start date and an end date on the calendar, and click the filter arrow .
- To view data for a different time period using the same date presets, click the arrows on either side of the date display. For example, to view data for the previous day, click the Day preset, and then click the arrow on the left side of the date.
- To view data for a different time zone using the same date presets, from the Time zone drop-down menu, select the required time zone. You can create and save reports with the same selected time zone.
To select the metrics for the summary row:
- Click Select Metrics.
- Select the required metric categories such as Count-based, Percentage-based, and Time-based.
- Choose the required metric. For more information about the available metrics, see the Agent Timeline Detail view section in the View available columns in performance views by category article.
Note: You can choose up to 12 metrics. - Click Add. The selected metrics are displayed.
To view the consolidated list of available metrics in the performance views, see Consolidated view of available columns in performance views.
To show or hide the timeline rows:
- Click Select Rows. The Select Rows pop-up window appears.
- Select the required rows such as Primary Status, Secondary Status, Routing Status, and Interactions.
- Click Confirm. The selected rows are displayed on the left side.
To show or hide the interaction list, click Show Interactions List.
All the interactions for the chosen date range are listed on the right side.
To view more details about any interaction, click on the required interaction. You are directed to the interaction details view page.


