
View predictive routing comparison test results
A comparison test alternately routes interactions on a queue using predictive routing and your current routing method. Each runs 50 percent of the time in an hour-on, hour-off pattern.
Open the comparison test results pane
- To open the pane showing comparison test results, click Test Mode from the Predictive Routing Evaluation column on the Queues window.
What data does the results pane show?
- The pane shows the results for a currently running comparison or the most recently completed test period. Genesys Cloud stores comparison test reports for six months. If you have not run a comparison test in more than six months, this pane is empty.
- Only the most recent 30 days of the current, or most recent, comparison test appear on the summary statistics, the graphs, and the exported report.
- Summary information for up to four more comparison tests that you ran within the last six months appears at the bottom of the pane. Each result is based on a maximum of 90 days of data. If your comparison test has run longer than 90 days, the results pane shows the outcome from the most recent 90 days.
- The comparison test result pane displays only the interactions that have the current routing method as either Standard or Bullseye. For the purpose of comparison test, predictive routing does not consider the interactions that have Last used agent as the routing method.
- If you set a custom KPI on the queue, depending on the KPI set, the Benefit pane lists the actual number of sales conversion, number of customers retained, or number of customers that were prevented from leaving the service.
Results pane fields
- Queue name
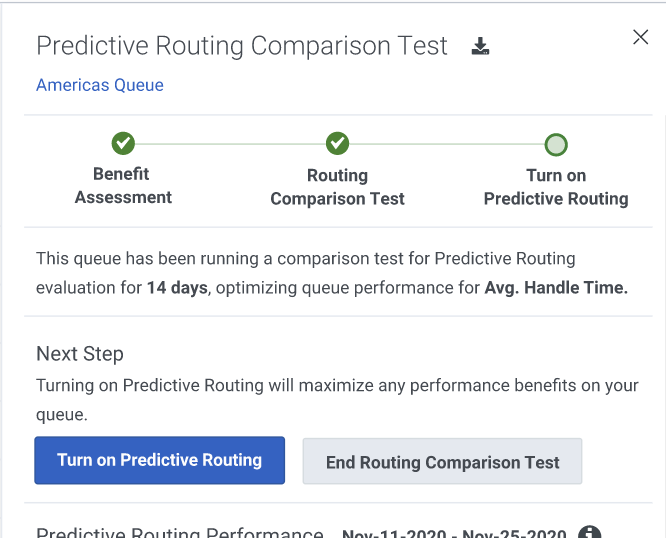
- Export results icon – Exports the results of the current or most recent comparison test as a .pdf file. If there are no results, this icon is absent.
- Breadcrumbs – Show which steps you have completed of the journey toward activating predictive routing.
- Number of days and KPI – How long the comparison test has been running (for an active test period) or ran (for a completed test period) and the KPI tested.
- Next step buttons:
- Turn on Predictive Routing – Activates predictive routing for all interactions on the queue and enables you optionally to configure more settings. For more information, see Activate predictive routing.
- Turn off Comparison Test – Opens the Queue list page where you can change your routing method.
- Summary statistics – The big picture effect on the average KPI value, based on the most recent 30 days of data. The data projected varies according to the KPI set. The following sections explain the graph for the different KPIs you can use in predictive routing:
Average Handle Time KPI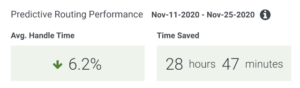
- Graphs showing the comparison test results – The daily performance over the course of the most recent 30 days of the comparison test. Click the tab for the graph you want to see.
- The KPI Benefit tab shows a dot chart of the daily benefit using predictive routing.
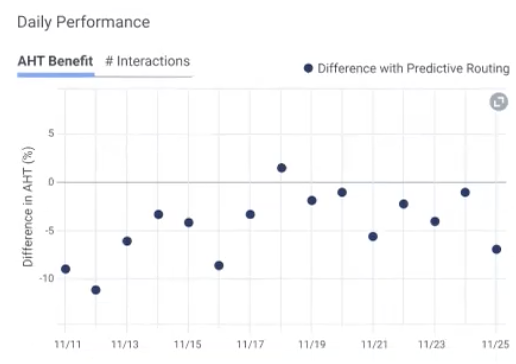
- The #Interactions tab shows a bar chart with the number of interactions routed each day using predictive routing and non-predictive routing. If Genesys Cloud finds no qualifying agent before predictive routing times out or if the number of the agents on the queue is three or lesser, it routes the interaction using standard routing, which is the fallback routing method. The #Interactions tab displays the number of interactions routed using the fallback routing method due to timeout and insufficiency of agents in the bar chart separately.
- The KPI Benefit tab shows a dot chart of the daily benefit using predictive routing.
- Graphs showing the comparison test results – The daily performance over the course of the most recent 30 days of the comparison test. Click the tab for the graph you want to see.
Next Contact Avoidance KPI:
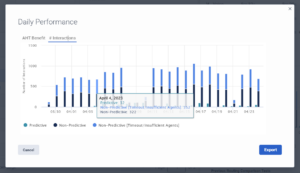
- Click the expand icon
 to open a large view of the two graphs in a popup window. The popup window has a tab for each graph type, tooltips to show what the data points indicate, and an Export button, which generates a .pdf file. The .pdf file provides a downloadable version of the results for the most recent 30 days of the current comparison test.
 - Export button – Generates a .pdf of the data for the current/latest comparison test summary and graph data in a layout that is similar to the layout shown on the pane.
- Summary performance results for up to four more comparison tests – Only tests run within the last six months appear. If there are no recent comparison tests, this section is hidden.
Note: You cannot drill down into the results for the four older comparison tests or export them.
Next Steps
Next step buttons:
- Turn on Predictive Routing – Activates predictive routing for all interactions on the queue and enables you optionally to configure more settings. For more information, see Activate predictive routing.
- Turn off Comparison Test – Opens the Queue list page where you can configure the routing method you want to use.