
Virtual Agent performance dashboard
- Analytics > summaryAggregate > View
- Analytics > Bot Aggregate > View
- Analytics > Knowledge Aggregate > View
- Analytics > Flow Aggregate > View
The Virtual Agent performance dashboard provides customers with comprehensive analytics and information about Virtual Agents. For more information about Genesys Virtual Agent, see About Genesys Virtual Agent. The dashboard provides a holistic view of the performance of Virtual Agents and their features, including intent performance, AI-powered slots, AI-powered knowledge retrieval, summarization, and wrap-up codes.
The dashboard provides a comprehensive view of the Key Performance Indicators (KPIs) of Virtual Agent, including the containment rate, transferred rate, agent escalation rate, abandoned rate, recognition failure rate, and error rate. This dashboard enables customers to quickly understand Virtual Agent performance, identify and address performance discrepancies, improve decision making, and increase efficiency and effectiveness.
To access your Virtual Agent performance dashboard, click Performance > Workspace > Other > Virtual Agent Performance.
To access your Virtual Agent performance dashboard, perform the following:
- Click Menu > Analytics > Analytics Workspace.
- In the Default section, search for Virtual Agent Performance and then click the view name to open it.
Set a default time zone in the workspace
You can set the default time zone in the analytics workspace before viewing any analytics view.
To set the default time zone in the workspace, follow these steps:
- Click Performance > Workspace.
- Click Menu > Analytics > Analytics Workspace.
- On the left side, from the Time zone drop-down menu, select the required time zone as the default time zone for the analytics workspace.
Virtual Agent performance dashboard overview
The dashboard gives you insights into the performance of Virtual Agents and their features.

To see the most current data, click Refresh .
To save the view with your filter and column settings, click Save .
To customize analytics views, use the date filter.
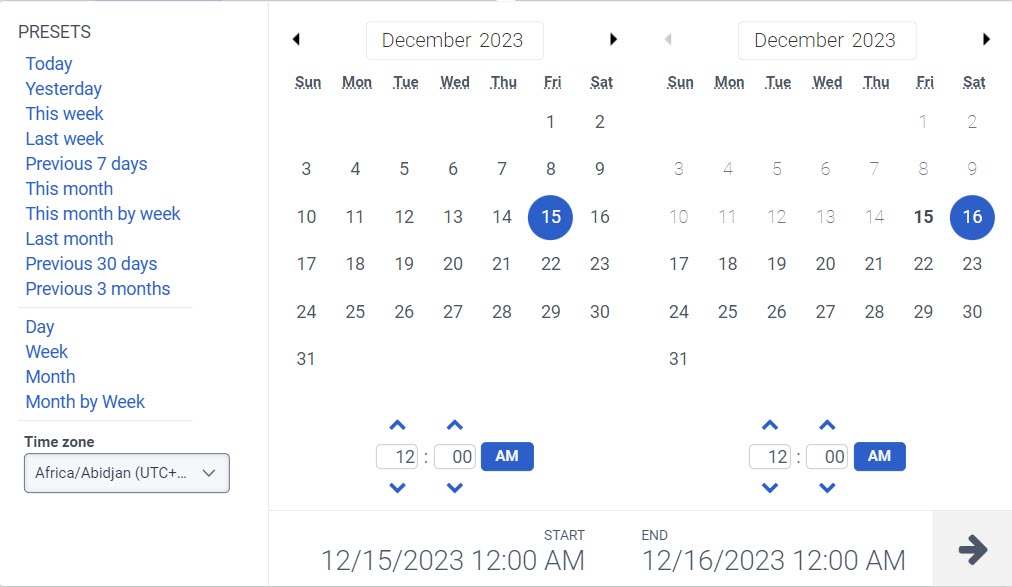
To filter metrics by date or configure a custom date range, use presets. When filtering metrics for this view, select any custom date range up to 6 weeks.
To use a preset to filter metrics, complete the following steps:
- To display the date filter, click the date.
- In the Presets list, select a preset date option.
Date presets
| Presets | Description |
|---|---|
| Today | Shows data for the time period that includes the current interval. |
| Yesterday | Shows data for the previous day. |
| This week | Shows data for a Sunday through Saturday time period. |
| Last week | Shows data for the previous week, Sunday through Saturday. |
| Previous 7 days | Shows data for the previous seven days. |
| This month | Shows data for the current month, with no extra days. |
| This month by week | Shows data for the current calendar month starting on Sunday and ending on Saturday, including extra days if the month does not start on Sunday or end on Saturday. |
| Last month | Shows data for the previous calendar month with no extra days. |
| Previous 30 days | Shows data for the previous 30 days. |
| Previous 3 months | Shows data for the previous 3 months. For example, Nov 1, 2022 – Jan 31, 2023. |
| Day | Shows data for a single 24-hour day. |
| Week | Shows data for a Sunday through Saturday time period. |
| Month | Shows data for the exact month with no extra days. If the current month is selected, you can see the data up to the current date. |
| Month by Week | Shows data for a calendar month starting on Sunday and ending on Saturday, including extra days if the month does not start on Sunday or end on Saturday. |
- To use a custom date range to filter metrics, complete the following steps:
-
- Click the date to display the date filter.
- Select a start date and an end date on the calendar, and click the filter arrow .
- To view data for a different time period using the same date presets, click the arrows on either side of the date display. For example, to view data for the previous day, click the Day preset, and then click the arrow on the left side of the date.
- To view data for a different time zone using the same date presets, from the Time zone drop-down menu, select the required time zone. You can create and save reports with the same selected time zone.
When each row shows a day, click a row to view that day’s 30-minute intervals.
You can filter the information by media types and message types. The supported media types are voice, chat, and message.
To filter the information:
- Click Toggle filters panel .
- Search or scroll to select the filter you want to use. The dashboard reflects the data based on one or more filters selected.
The Virtual Agent performance dashboard has two sections as follows:
- Overview
- Virtual Agent Features
In this section, let us discuss them in detail.
Overview
The overview section provides insights about the following:
- Total number of Virtual Agent sessions, and the sessions broken down by voice and digital.
- Percentage of the total number of Virtual Agent sessions broken down by containment, transferred, agent escalation, abandoned, recognition failure, and error.
- Graphical representation of the total number of Virtual Agent sessions broken down by containment, transferred, agent escalation, abandoned, recognition failure, and error over a period.
Virtual Agent Sessions
A Virtual Agent session is defined as a single virtual agent session with one or more exchanges, either through digital or voice channels. The Virtual Agent Sessions widget is linked to the Bot performance view. Click View Bot Performance at the bottom of the widget to go to the Bot Performance Summary view.
Contained
Contained is the percentage of Virtual Agent sessions resolved without:
- Transferring using the Transfer to ACD, Transfer to User, Transfer to Number, or Transfer to Group action (Transferred).
- Transferring to a live agent after a user’s request (Agent Escalation).
- Abandoned sessions (Abandoned).
- A recognition failure or error (Recognition Failure or Error).
Transferred
Transferred is the percentage of Virtual Agent sessions transferred using the Transfer to ACD, Transfer to User, Transfer to Number, or Transfer to Group action.
Agent Escalation
Agent escalation is the percentage of Virtual Agent sessions transferred to a live agent after a user’s request. For example, after detecting a customer’s want to speak to an agent as “I want to speak to an agent.” For more information about the agent escalation in voice and digital bot flows, see Agent escalation in voice and digital bot flows.
Abandoned
Abandoned is the percentage of Virtual Agent sessions that expired due to user inactivity on a digital channel or where the user hung up the phone on a voice channel.
Recognition Failure
Recognition failure is the percentage of Virtual Agent sessions that ended due to the Virtual Agents’ inability to understand the users’ queries or the users’ inability to respond to the Virtual Agents’ after breaching the configured limit of retries.
Error
Error is the percentage of Virtual Agent sessions that ended in error.
Virtual Agent Sessions – Graph
A Virtual Agent session shows the graphical representation of the trends of Virtual Agents sessions broken down by containment, transferred, agent escalation, abandoned, recognition failure, and error over a period. This line graph helps customers to track how user sessions are evolving with Virtual Agents.
Virtual Agent features
The virtual agent features section provides insights about the following:
- Intent Performance
- AI-Powered Slots
- AI-Powered Knowledge Retrieval
- Summarization
- Wrap Up Codes
Intent Performance
Intent Performance displays the total number of intent-related queries. It also shows the graphical representation of the success rate of the correctly matching user inputs to the intended intents. This chart helps customers to analyze the performance of the Virtual Agents in successfully recognizing and self-serving users’ queries and requests.
AI-Powered Slots
AI-Powered slots show the graphical representation of the frequency of usage for each AI-powered slot type, including freeform, alphanumeric, and numeric, in user interactions. You can view the success rate versus frequency when hovering over the graph. This line graph helps customers to understand the success rate of capturing customer information and validating users’ inputs using LLM-powered slots in a conversational manner.