Genesys Agent Assist performance dashboard
Access to the following menu options to collect analytics for the dashboard from Agents:
- Knowledge > Document content copy > Add
- Knowledge > Document view > Add
- Knowledge > Feedback > Create, View
Access to the following menu options to see the dashboard for analysts:
- Analytics > Tab configurations > All Permissions
- Analytics > Conversation Aggregate > View
- Analytics > Knowledge Aggregate > View
- Analytics > Flow Observation > View
- Analytics > Queue Observation > View
Access to the following menu options to use filters:
- Directory > User > View
- Routing > Queue > View
- Assistants > Assistant > View
- Assistants > Queue > View
- Knowledge > Knowledge base > View
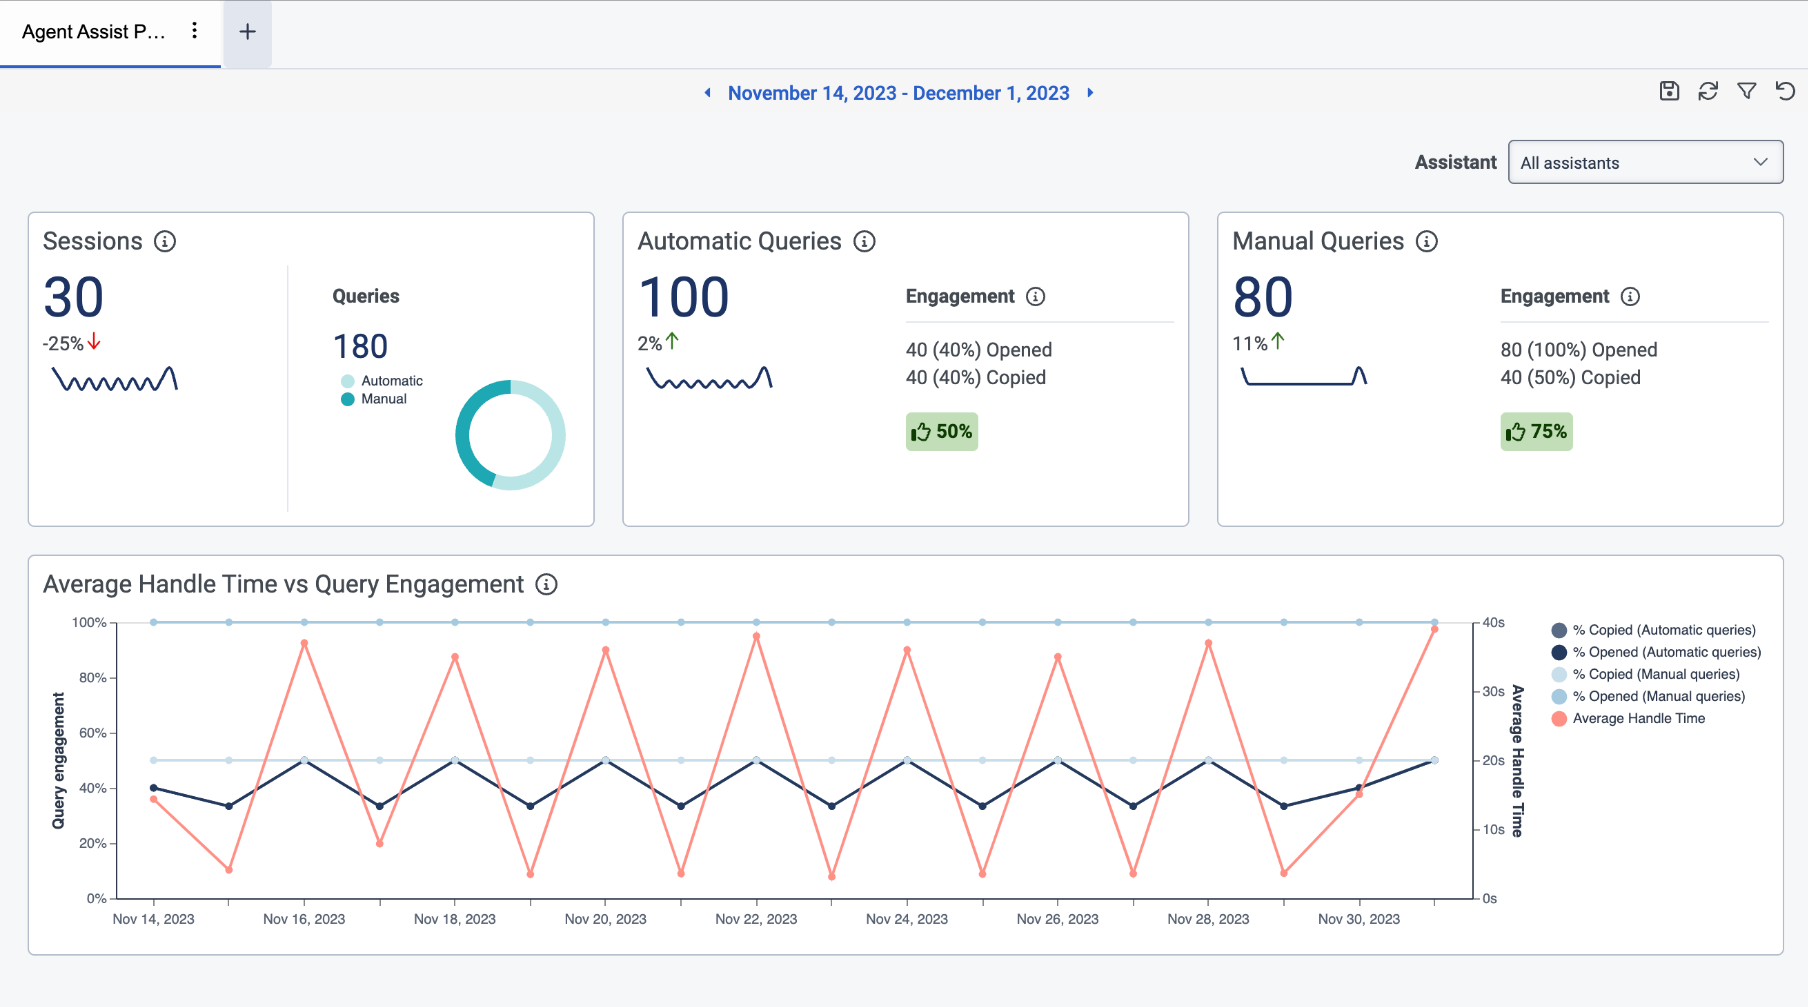
The Genesys Agent Assist dashboard helps you understand knowledge base activities.
Click the image to enlarge.
Access the Genesys Agent Assist dashboard
Click Performance > Agent Assist Performance.
- Click Add. The list of available views appears.
- Search for Agent Assist Performance, or scroll to Other and select it from the list.
Select the Genesys Agent Assist
If you set up multiple Genesys Agent Assist configurations, you can select the Genesys Agent Assist that you want to examine in the Assistant list in the upper right corner of the screen.

Filter results
You can use several filters to refine the results.
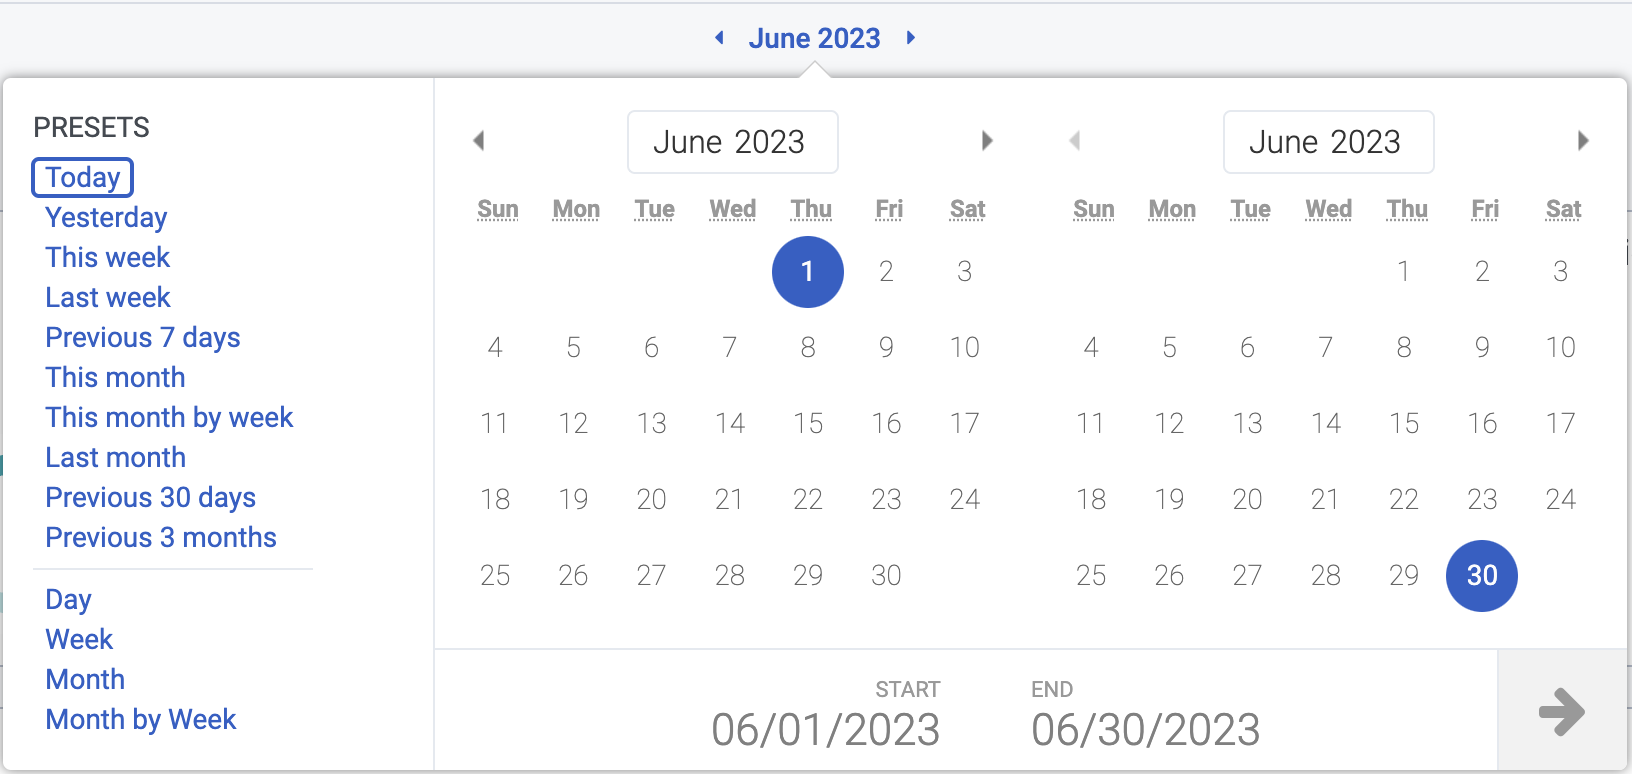
Filter for a time period
Use the date selector to filter for a time period in which you want to examine Genesys Agent Assist analytics.
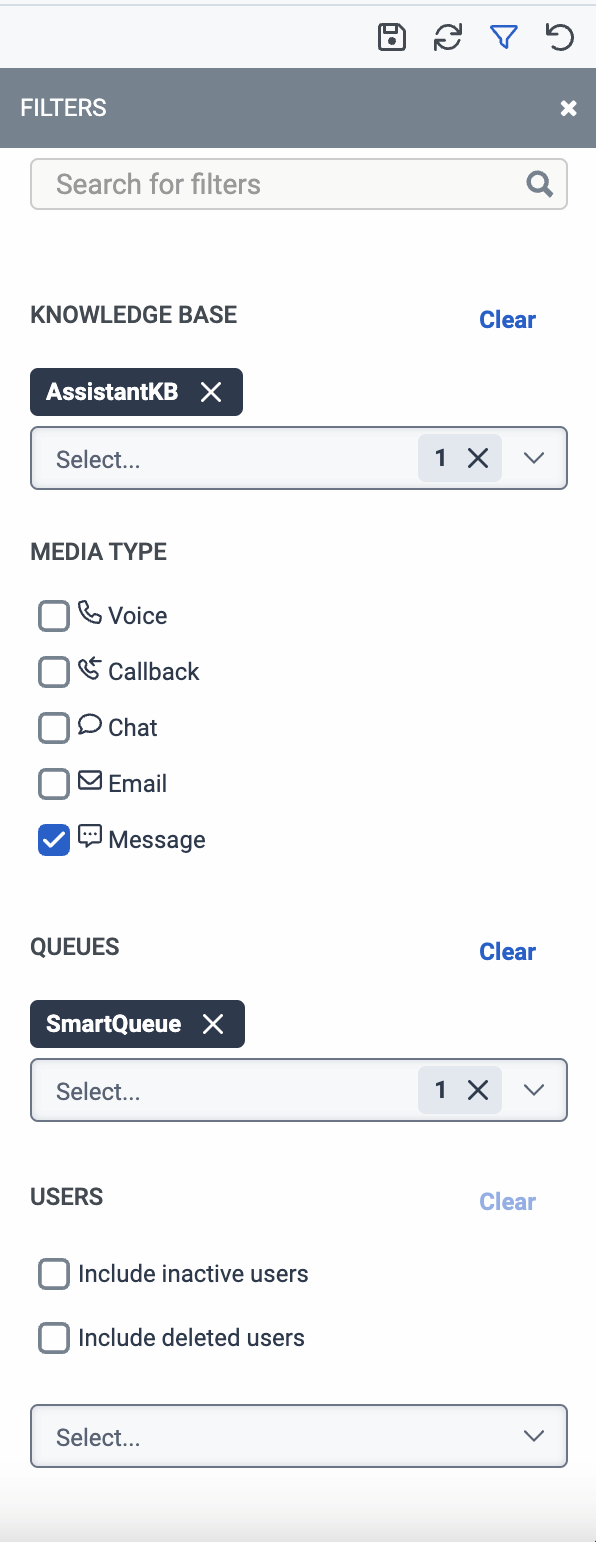
Filter for knowledge base, queue, media type, or agent
To refine your search filters, click the Filter icon. You can filter for these metrics:
- Knowledge base
- Media types (voice, callback, chat, email, message)
- Queues
- Users
Genesys Agent Assist dashboard overview
| Tile | Illustration | Description |
|---|---|---|
| Sessions | 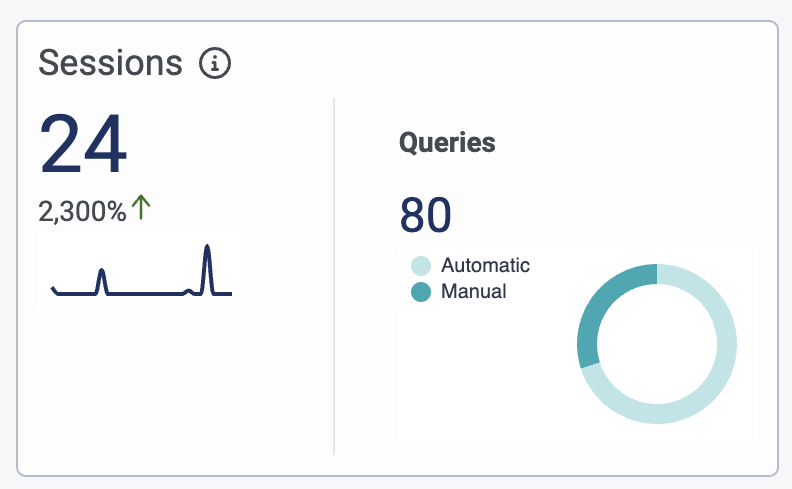 |
Sessions indicate web chat or voice conversations between a customer and an agent. This tile shows the overall number of sessions. The percentage value under the overall number indicates the change in overall session numbers compared with the previous time period of the same length that you query. A green upward arrow indicates if the overall number increased; a red downward arrow indicates if the overall number decreased. Example:
If you filter for the past seven days in the date selector, the percentage value in sessions shows the change in overall session numbers compared with the seven-day time period before the queried seven days. The Queries chart indicates the number of automatic or manual queries. |
| Automatic queries | 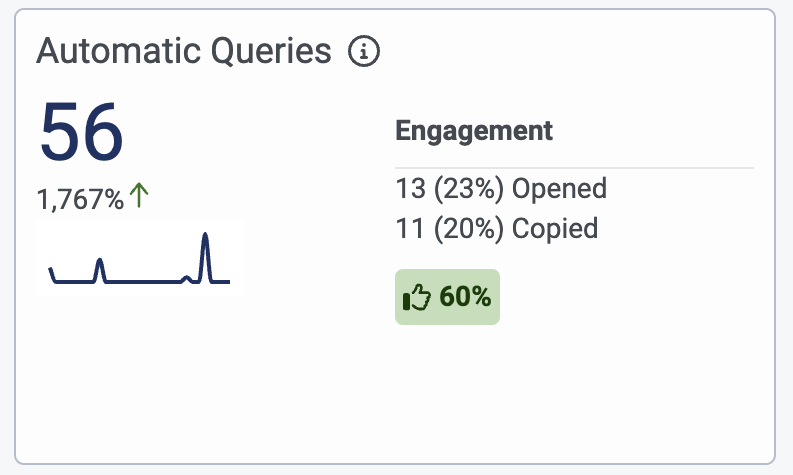 |
This tile indicates the overall number of automatic queries for suggestions. The percentage value under the overall number indicates the change in the overall number of automatic queries for suggestions compared with the previous time period of the same length that you have queried. A green upward arrow indicates if the overall number increased; a red downward arrow indicates if the overall number decreased. Engagement shows two values:
Example:
The image shows that the overall number of instances when Genesys Agent Assist automatically suggested articles is 56. The number of times when an agent opened an article from the automatically suggested articles is 13. Expressed in percentages, query performance of opened articles is 23%. The number of times when an agent copied an article from the automatically suggested articles is 11. Expressed in percentages, query performance of copied articles is 20%. |
| Manual queries | 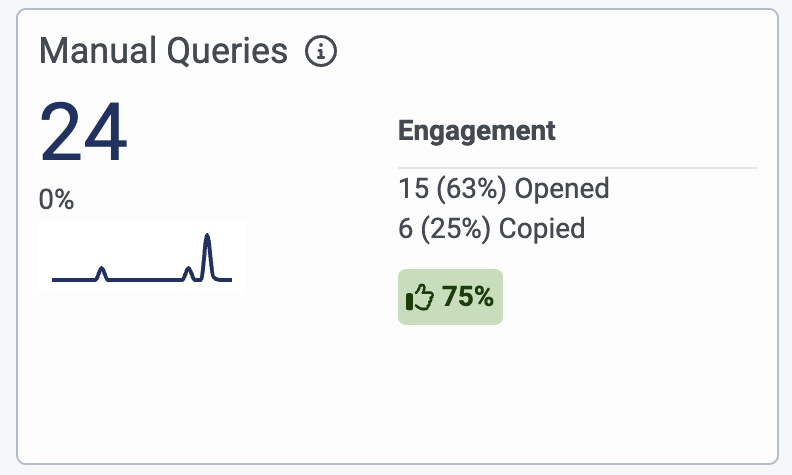 |
This tile indicates the overall number of manual queries. The percentage value under the overall number indicates the change in overall manual queries compared with the previous time period of the same length that you have queried. A green upward arrow indicates if the overall number increased; a red downward arrow indicates if the overall number decreased. Engagement shows two values:
Example:
The image shows that the overall number of manual queries that returned articles is 24. The number of times when an agent opened an article from the manually queried articles is 15. Expressed in percentages, query performance of opened articles is 63%. The number of times when an agent copied an article from manually queried articles, is 6. Expressed in percentages, query performance of copied articles is 25%. |
|
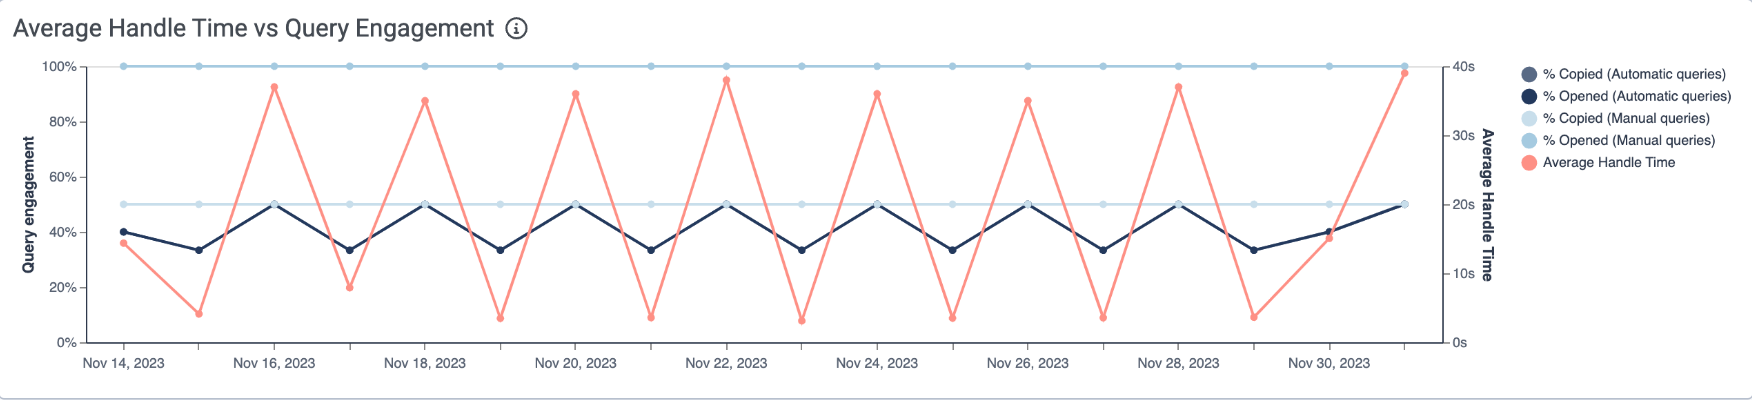
Average handle time vs. Article engagement |
Click the image to enlarge.
|
This diagram shows a comprehensive view of average handle time and article engagement, distributed into automatic and manual queries. The dashboard displays the percent of automatic queries, which result in opened or copied articles. |