
Genesys Agent Copilot performance dashboard
Access to the following menu options to collect analytics for the dashboard from Agents:
- Conversation > Suggestion Engagement > Add
- Knowledge > Document content copy > Add
- Knowledge > Document view > Add
- Knowledge > Feedback > Create, View
- Knowledge > Search > Edit
Access to the following menu options to see the dashboard for analysts:
- Analytics > Tab configurations > All Permissions
- Analytics > Agent Copilot Aggregate > View
- Analytics > Conversation Aggregate > View
- Analytics > Knowledge Aggregate > View
- Analytics > Flow Observation > View
- Analytics > Summary Aggregate > View
- Analytics > Queue Observation > View
Access to the following menu options to use filters:
- Directory > User > View
- Routing > Queue > View
- Assistants > Queue > View
The Genesys Agent Copilot dashboard helps you to get a deeper insight into Agent Copilot-related features, like interaction and queue activities or after-call work statistics.
Access the Genesys Agent Copilot dashboard
- Click Performance > Workspace.
- To open a new tab, click Create New Tab .
- From the list on the left, select Agent Copilot Performance on the left side of the screen. Alternatively, in the Search Views , field, start to type
Agent Copilot Performance, and select it when it appears in the Others section. - Click Menu > Analytics > Analytics Workspace.
- In the Default section, search for Agent Copilot Performance and then click the view name to open it.
Select the corresponding queue
From the Queue drop-down, select the queue you want to inspect.
- If you want to compare the selected queue with another queue, select the wanted queue from the Comparison Queue drop-down.
Filter results
You can use several filters to refine the results.
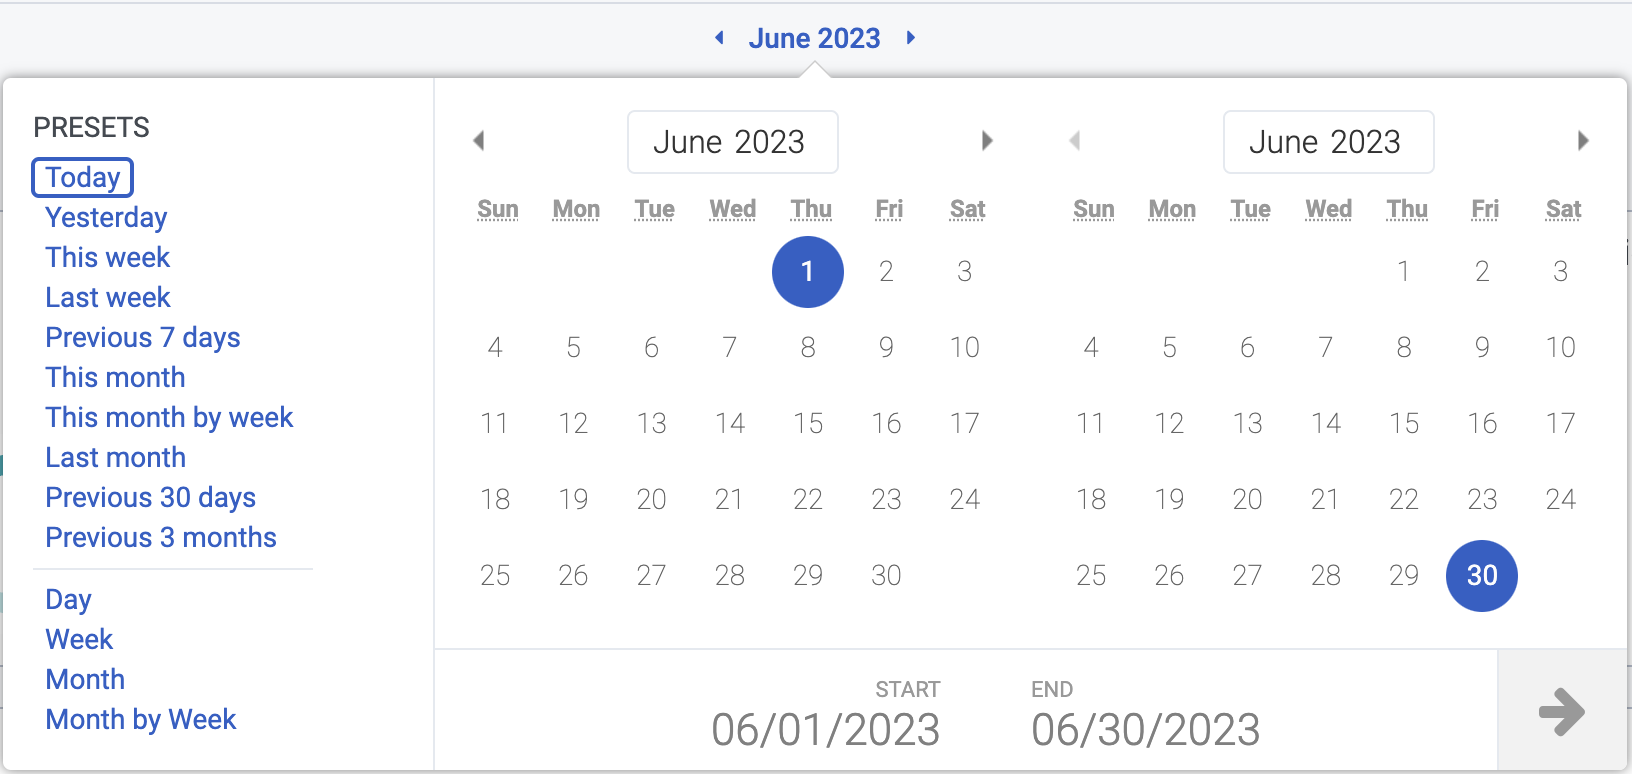
Filter for a time period
Use the date selector to filter for a time period in which you want to examine Genesys Agent Assist analytics.
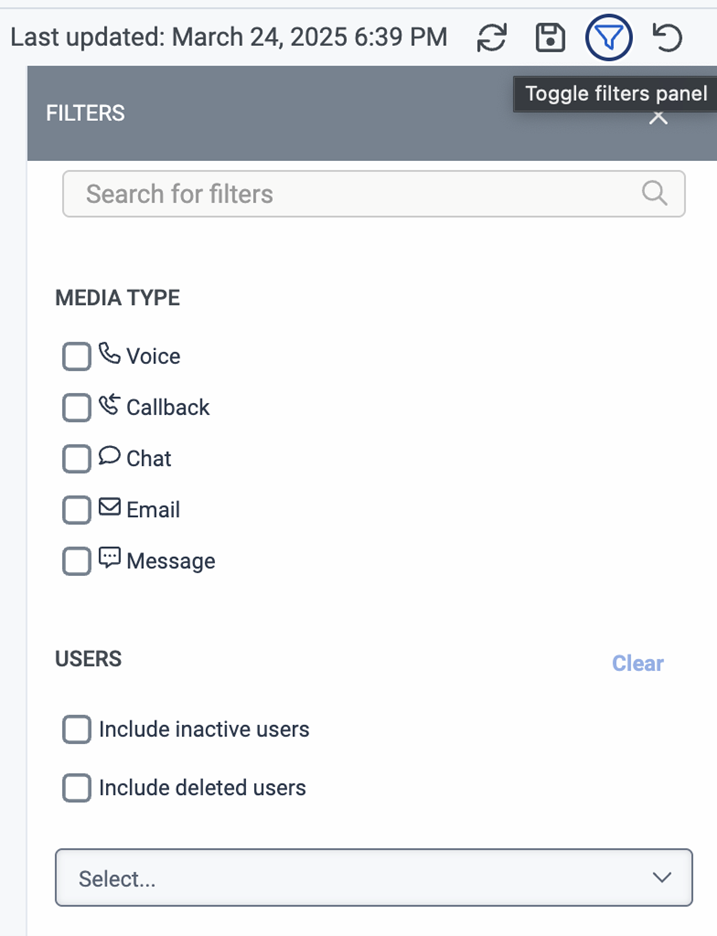
Filter for media type or agent
To refine your search filters, click the Filter icon. You can filter for these metrics:
- Media types (voice, callback, chat, email, message)
- Users
Genesys Agent Copilot dashboard overview
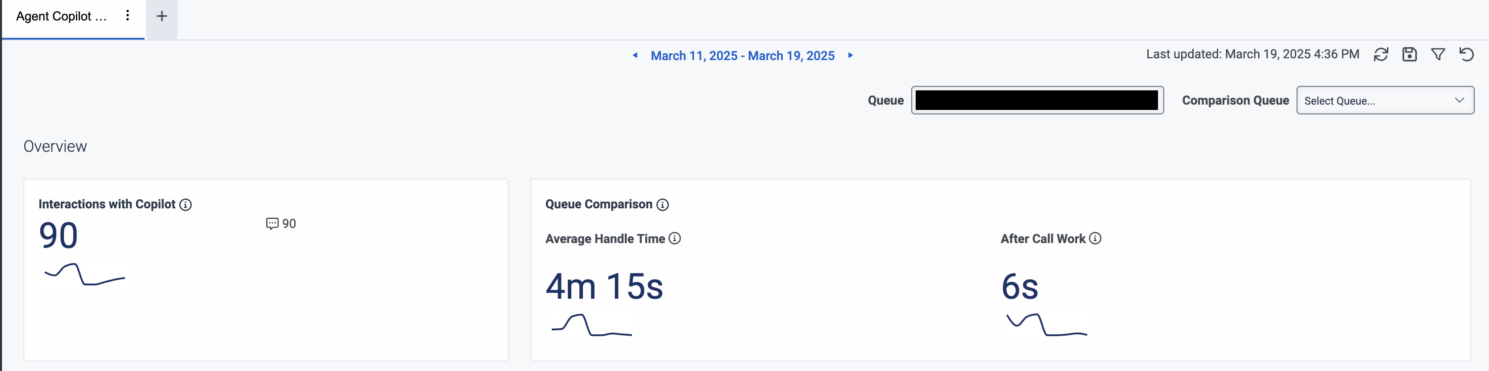
This table summarizes the general dashboard tiles and their functionalities.
| Tile | Description |
|---|---|
| Interactions with Agent Copilot | This tile shows the total number of interactions with Agent Copilot on the selected queue. |
|
Queue Comparison
|
|
Genesys Agent Copilot dashboard recommendations
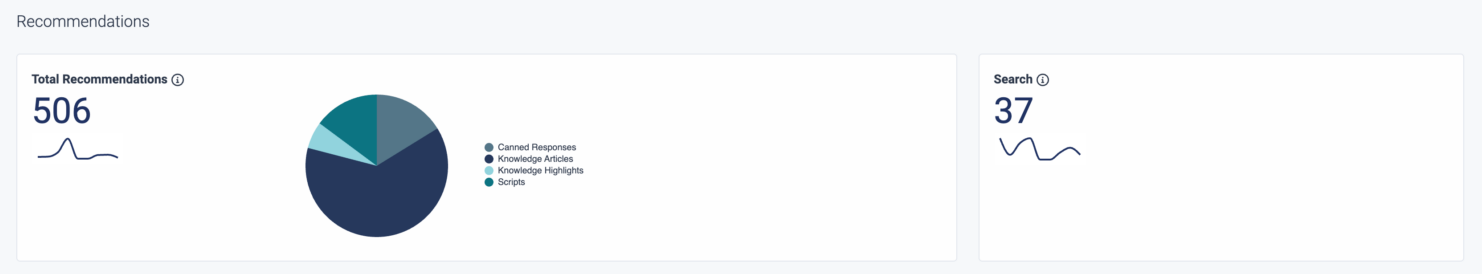 This table summarizes the dashboard recommendations tiles and their functionalities.
| Tile | Description |
|---|---|
| Total recommendations |
This tile shows how many recommendations the Agent Copilot made on the selected queue. You can see specific statistics about each of the recommended content types (canned responses, knowledge articles, knowledge highlights, scripts). Available content types
|
| Search | This tile shows how many manual knowledge searches were performed in the Agent Copilot panel. |
| Recommendation details |
This tile gives a detailed overview about the Total recommendations statistics. You can inspect the following characteristics for each content type:
|
Genesys Agent Copilot dashboard after-call work overview
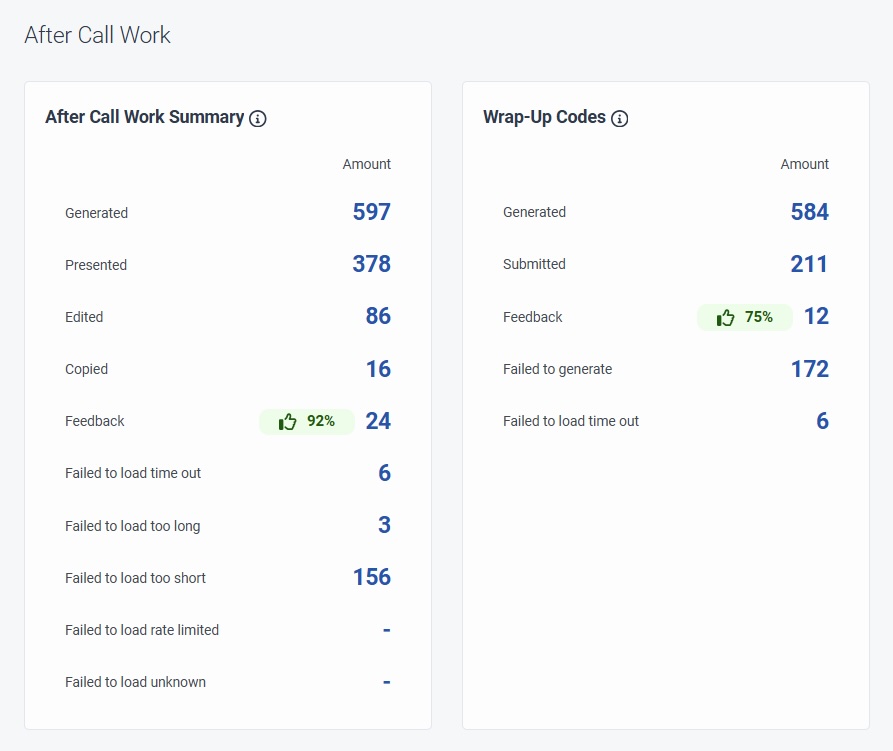 This table summarizes the after-call work dashboard tiles and their functionalities.
| Tile | Description |
|---|---|
|
After call work (ACW) summary
|
This tile gives a detailed overview related suggested ACW summaries generated at the end of an interaction.
|
|
Wrap-up codes
|
This tile gives a detailed overview related suggested Wrap up codes generated at the end of an interaction.
|