Queue Routing Performance Summary view
The following permissions:
- Analytics > Conversation Aggregate > View
- Routing > Queue > View
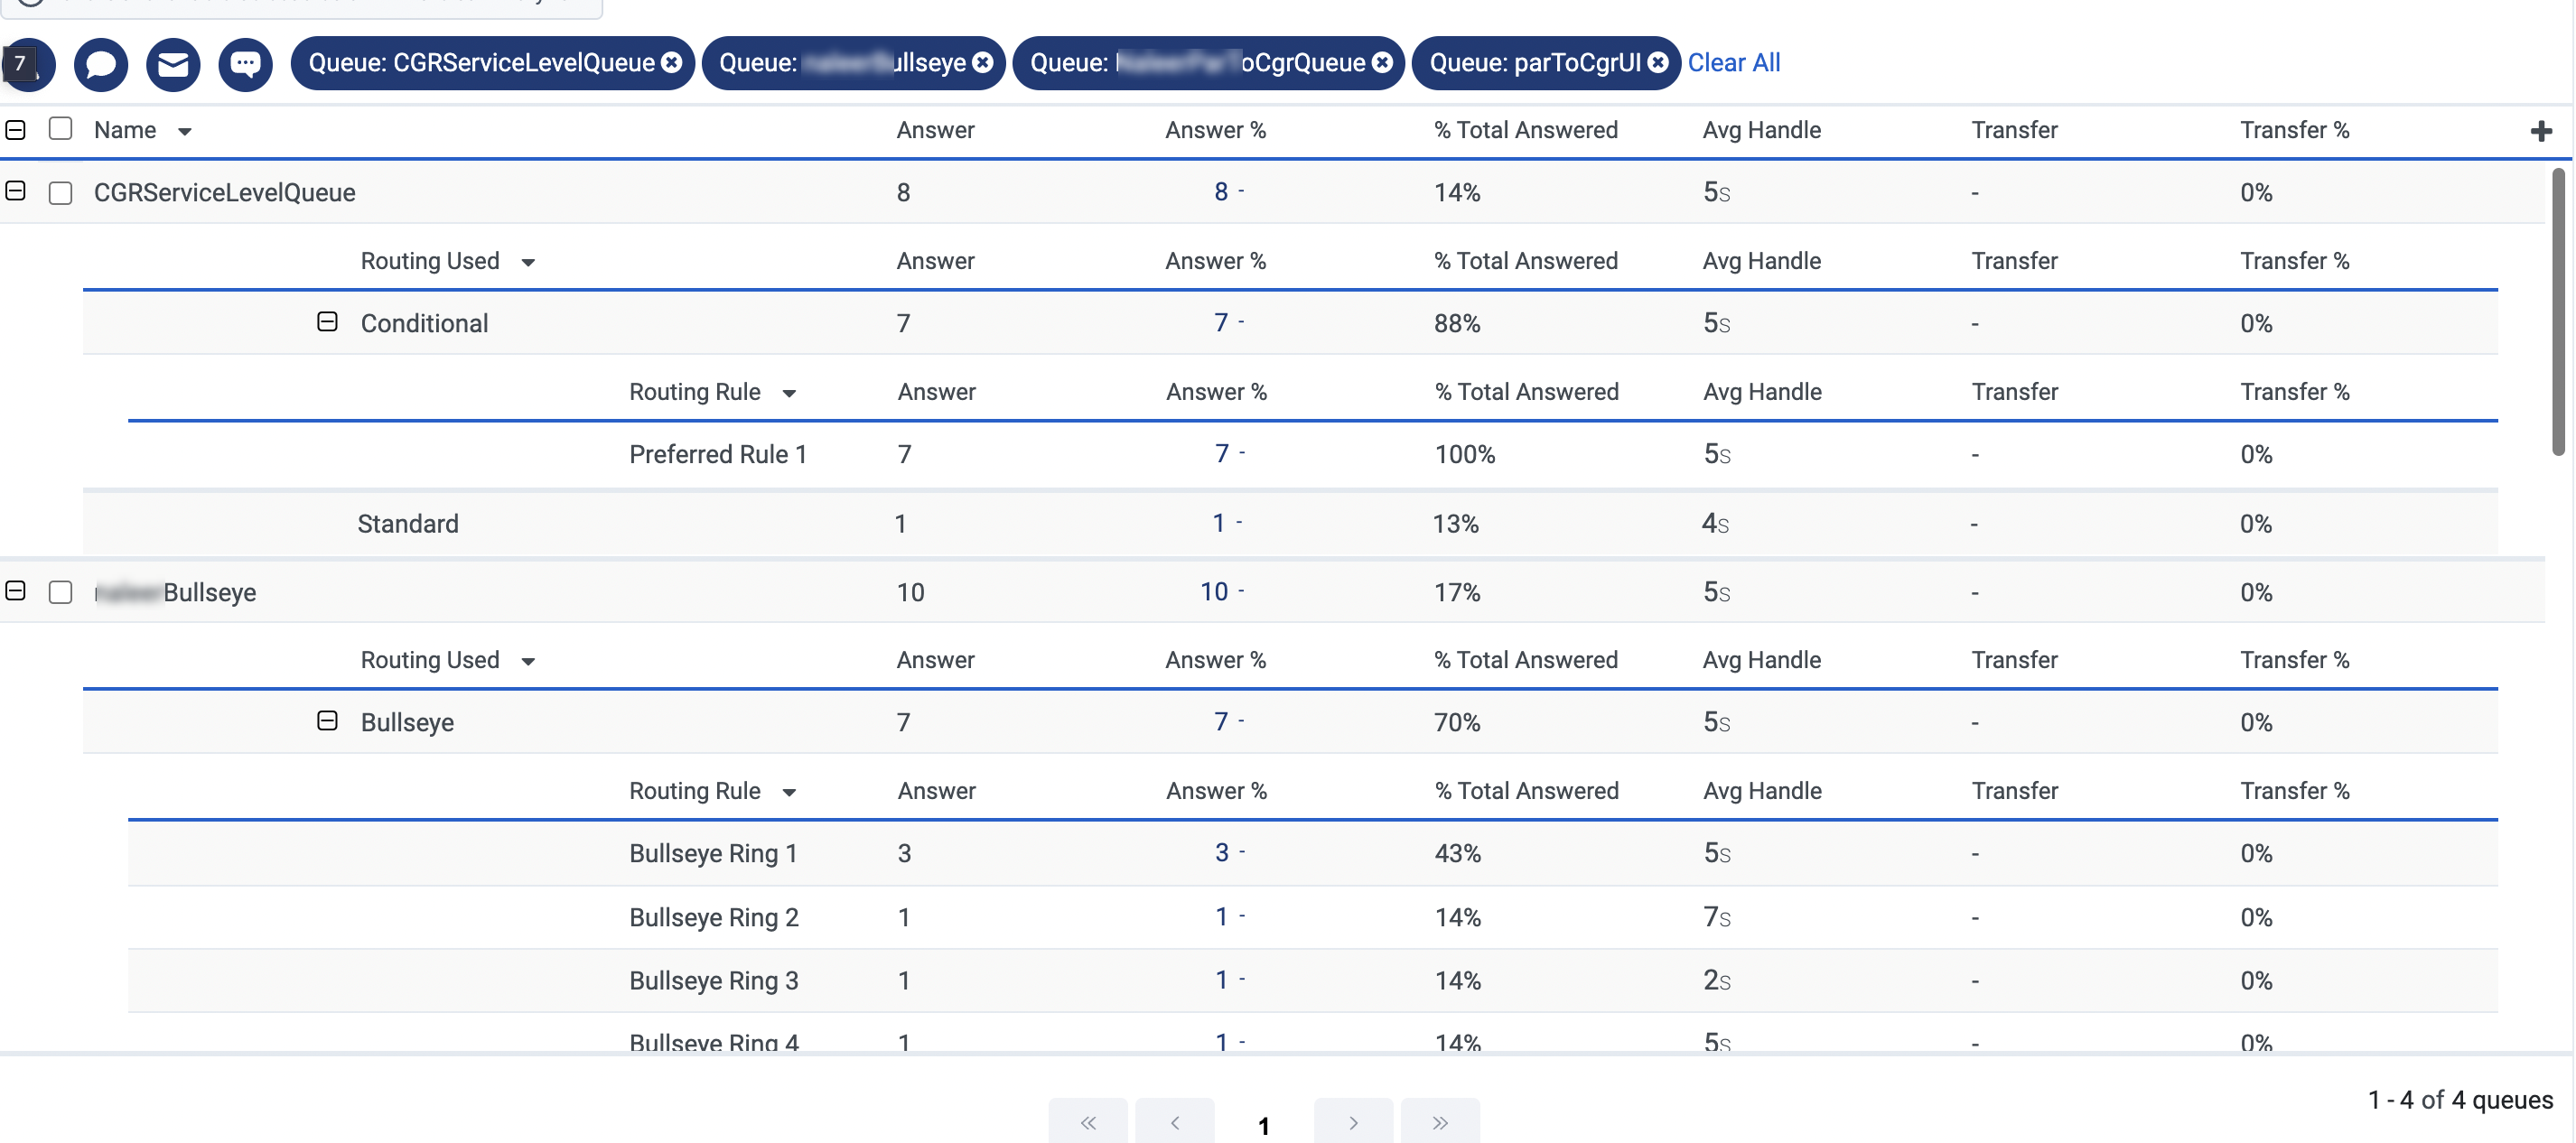
The Queue Routing Performance summary view provides insights about the types of routing such as preferred agent routing, Bullseye routing, standard routing, and conditional group routing, and the routing rings used while answering the interactions. This view also provides insights on the number of calls answered or transferred on a queue by routing rings/rules configured under preferred agent routing/Bullseye routing. The administrators can use the insights to understand how a particular routing strategy is performing for a specified queue and can take timely corrective actions.
Available columns
To view the available columns, see the Queue Routing Performance Summary view section in the View available columns in performance views by category article.
- To view the consolidated list of available columns in the performance views, see Consolidated view of available columns in performance views.
- To view the list of available columns in the performance views by category, see View available columns in performance views by category.
Set a default time zone in the workspace
You can set the default time zone in the analytics workspace before viewing any analytics view.
To set the default time zone in the workspace, follow these steps:
- Click Performance > Workspace.
- Click Menu > Analytics > Analytics Workspace.
- On the left side, from the Time zone drop-down menu, select the required time zone as the default time zone for the analytics workspace.
To see current and past queue routing metrics and data, click Performance > Workspace > Contact Center > Queue Routing Performance. Customize the view with filters and column controls.
To see current and past queue routing metrics and data, perform the following:
- Click Menu > Analytics > Analytics Workspace.
- In the Default section, search for Queue Routing Performance and then click the view name to open it.
Customize the view with filters and column controls.
To export the data in the view, click Export .
To save the view with your filter and column settings, click Save .
This view updates automatically except when you use filters from the Filters pane. To see the most current data, click Refresh .
Customize the view
To show only specific data, customize the queue routing performance summary view. For example, you can show only specific columns or filters to see certain types of interactions. You can also save your filter and column settings as a saved view to switch quickly between different data of interest in the same view.
Filter by queues to populate the summary row with aggregate data about those queues.
Data in the view can be displayed in a chart. To view the chart, click the Show/Hide chart icon . To show or hide columns: To reorder the columns within the column picker: To rearrange the columns outside the column picker, click a column header and drag it. To reset a view to default column settings, click Reset view to defaults . You can select up to 20 columns. To customize analytics views, use the date filter. To filter metrics by date or configure a custom date range, use presets. When filtering metrics for this view, select any custom date range up to 6 weeks. To use a preset to filter metrics, complete the following steps: To filter by media type, perform the following: The selected media type icon is displayed above the column headers. For more information about various media types and their settings, see the Set behavior and thresholds for all interaction types section in the Create and configure queues. To enter names of queues you want to view, click the Filter queue(s) search icon . Enter the name of the queue and select the queue from the search results. You can continue to enter and select additional queues to add to the view. You can select multiple queues to filter by. To use the summary row above the queue rows and to see aggregate metrics for multiple queues, search for and select multiple queues. The summary row then shows the aggregate metrics for the selected queues. Displays metrics for interactions with agents who have the selected skills. Filter for multiple skills at one time by entering other skills and searching again. Displays metrics for interactions with agents who have the selected languages. Filter for multiple languages at one time by entering other languages and searching again. Displays information about interactions of the selected directions. Displays whether the interaction was inbound, outbound, or inbound/outbound. Displays information about interactions with the selected initial direction. Displays whether the interaction was inbound, outbound, or inbound/outbound. Displays the routing methods that were requested for the interaction. Gives insight into each of the routing methods the conversation went through prior to being answered, abandoned, or flow-out. The routing data is relevant beginning September 5, 2020. Displays the routing method that was used to get to the agent who answered the interaction. The routing data is relevant beginning September 5, 2020. Displays data for the first queue of an interaction. Select the First Queue check box to retrieve queue statistics for only the first queue that the interaction occurred on.
![]() of a column, and then drag and drop to reorder it within the column picker.
of a column, and then drag and drop to reorder it within the column picker.
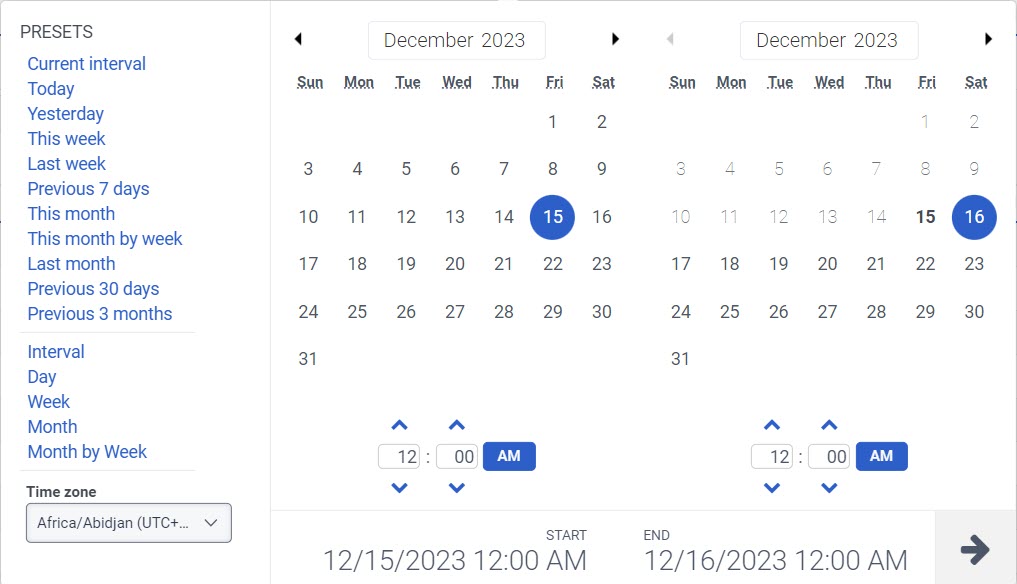
Date presets
Presets
Description
Current interval
Shows data for the current 30-minute time period.
Today
Shows data for the time period that includes the current interval.
Yesterday
Shows data for the previous day.
This week
Shows data for a Sunday through Saturday time period.
Last week
Shows data for the previous week, Sunday through Saturday.
Previous 7 days
Shows data for the previous seven days.
This month
Shows data for the current month, with no extra days.
This month by week
Shows data for the current calendar month starting on Sunday and ending on Saturday, including extra days if the month does not start on Sunday or end on Saturday.
Last month
Shows data for the previous calendar month with no extra days.
Previous 30 days
Shows data for the previous 30 days.
Previous 3 months
Shows data for the previous 3 months. For example, Nov 1, 2022 – Jan 31, 2023.
Interval
Shows data for a 30-minute time period.
Day
Shows data for a single 24-hour day.
Week
Shows data for a Sunday through Saturday time period.
Month
Shows data for the exact month with no extra days. If the current month is selected, you can see the data up to the current date.
Month by Week
Shows data for a calendar month starting on Sunday and ending on Saturday, including extra days if the month does not start on Sunday or end on Saturday.
Filter by selecting multiple queues
Filter
Description
Skills
Languages
Direction
Initial Direction
Routing Requested
Routing Used
First Queue