
Flows Destinations view
The following permissions:
- Analytics > Data Export > All
- Analytics > Flow Aggregate > View
- Architect > Flow > Search
- Architect > Flow > View
- Analytics > Insight Configurations > View
The Flows Destinations view allows you to see how interactions enter and leave specific flows in your contact center. These flows with interaction behavior that you can view are inbound call, outbound call, secure call, inbound message, inbound email, and inbound chat. To see the Flows Destinations view, click Performance > Workspace > Flows > Flow Destination. To see the Flows Destinations view, perform the following:
- Click Menu > Analytics > Analytics Workspace.
- In the Default section, search for Flow Destination and then click the view name to open it.
Set a default time zone in the workspace
You can set the default time zone in the analytics workspace before viewing any analytics view.
To set the default time zone in the workspace, follow these steps:
- Click Performance > Workspace.
- Click Menu > Analytics > Analytics Workspace.
- On the left side, from the Time zone drop-down menu, select the required time zone as the default time zone for the analytics workspace.
Interpret the view
The view has a graph and three main sections: Entries, Exits, and Disconnects.
Graph of data
This view contains a graph of data about the number of entries, exits, or disconnects in the flow. In the graph, click a section name to display graphical data about that section. The graph’s data filters when you filter by date, flows, or DNIS. If you click a reason in the Exits or Disconnects sections, then the graph updates to show that reason in comparison to all of that section’s total calls. The data does not filter when you click an entry reason in the Entries section.
To see more information about the data, hover over the bars in the graph. The arrow pointing up above a bar represents the largest amount for that time period, and the arrow pointing down represents the lowest amount.
To view or hide the graph, click Graph.
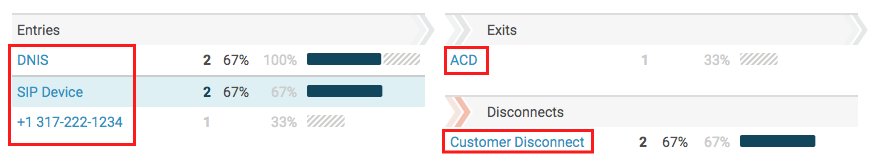
Entries
The Entries section displays how interactions entered the flow. The section displays the overall entry reasons, such as DNIS or agent transfer, and specific entry reasons, such as a specific DNIS number or the name of the agent who transferred the interaction to a flow. Click an entry reason to filter the other sections by that entry reason.
| Entry reason | Description |
|---|---|
| Agent |
An agent transferred a call to a flow. |
| Direct |
Someone, such as an internal user, called a flow directly by typing the flow name directly into the dialpad. |
| DNIS |
The caller dialed a number that directly routes to a flow. Note: The same number could route to different flows based on how your organization has set up routing. For example, schedule and emergency settings could route the same DNIS to a different flow. |
| Flow |
A flow transferred the interaction to another flow. |
| Outbound |
Outbound dialing called a contact. After the contact answered the call, the system transferred the call to an outbound flow. |
Exits
The Exits section displays where calls went after they exited the flow, such as to a queue or another flow. Click a specific exit reason to see more details about that reason and to filter the other sections by that exit reason. For example, click the ACD reason to see the names of queues that the interactions entered and to see the number and percentage of other reasons that had that exit.
| Exit reason | Description |
|---|---|
| ACD | The interaction entered a queue. |
| ACD Voicemail | The interaction entered into an ACD voicemail. |
| Flow | The interaction entered another flow. |
| Group | The interaction went to a group. |
| Group Voicemail | The interaction went to a group voicemail in your organization. |
| Number | The interaction went to another number. |
| Return to Agent | The interaction returned to an agent after the agent transferred the call to a secure call flow that triggered a return to agent action. |
| Secure Flow | The interaction entered a secure flow. |
| User | The interaction went to a user in your organization. |
| User Voicemail | The interaction went to a user’s voicemail in your organization. |
Disconnects
The Disconnects section displays how calls disconnected from the flow. Click a disconnect reason to filter the other sections by that disconnect reason.
| Disconnect reason | Description |
|---|---|
| Customer Disconnect | An external event, such as a customer hanging up, disconnected the interaction from the flow. |
| Flow Disconnect |
The flow disconnected the interaction due to the flow design, such as a disconnect action that allows callers to press a number to end the flow. |
| System Error Disconnect |
The call encountered an error in the flow, and the flow disconnected due to its error handling settings. |
Section columns
By default, each section has four columns:
- a list of reasons for that particular section
- the number of calls for that reason
- the percentage of calls for that reason
- a visual representation of the percentage of calls compared with the total number of calls
| Example | Column | Description |
|---|---|---|
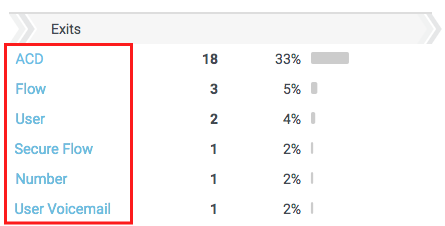 |
Reason | How the interaction entered, exited, or disconnected from the flow. |
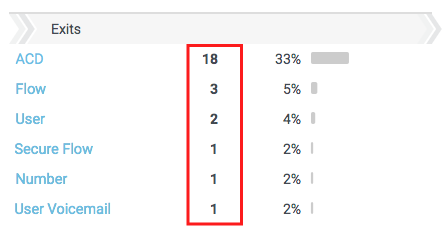 |
Number of calls | The number of interactions for that section that match the reason. |
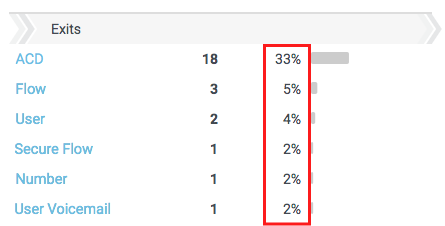 |
Percentage of calls | The percentage of interaction that match the reason related to the total number of interactions. |
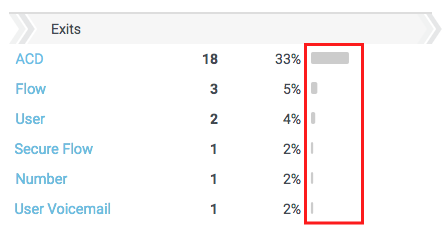 |
Visual Representation | A visual representation of the percentage of interactions that match the reason. |
Click a specific entry, exit, or disconnect reason to filter the sections by that reason. When you filter by a reason, the view updates the current data and adds more columns.
| Example | Column | Description |
|---|---|---|
|
Click the image to enlarge. |
Reason | How the interaction entered, exited, or disconnected from the flow. The view highlights the row of the reason you click to filter by. |
Click the image to enlarge.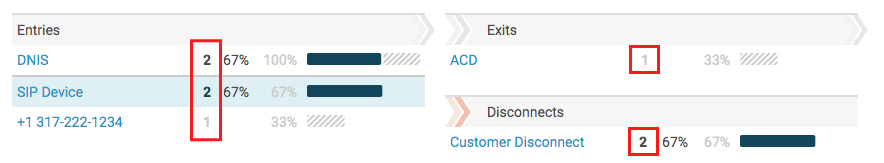 |
Number of calls | The number of interactions for that section that match the reason and selected reason filter. If no interactions match the selected reason filter, then the number remains as the total number of interactions that match the reason, but the number appears dimmed. |
Click the image to enlarge.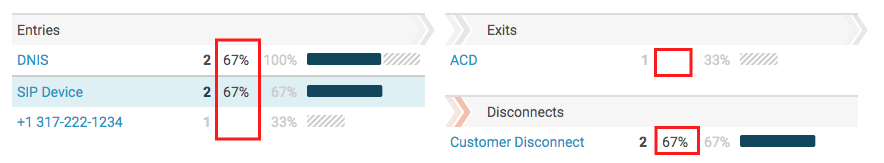 |
Percentage of filtered calls |
When you filter by a reason, then this column appears and displays the percentage of interactions that match the filtered reason related to the total number of interactions. If no interactions match the selected reason filter, then the view does not display a filtered percentage. |
Click the image to enlarge.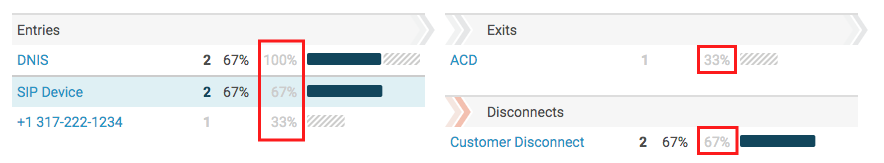 |
Percentage of calls | The percentage of interactions that match the reason in the row related to the total number of interactions for that reason. |
Click the image to enlarge.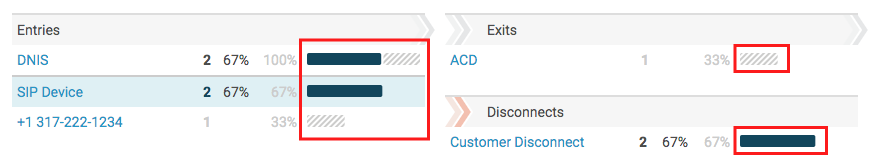 |
Visual representation | A visual representation of the percentage of interactions that match the reason and the selected reason filter. Any difference between the two percentages appears as a dimmed part of the bar. |
Export the data in the view
To export the data shown in this view and deliver it to your inbox, click Export .
Customize the view
Customize the view to show only certain data. To save your filter and date settings for the view, click Save .
To customize analytics views, use the date filter.
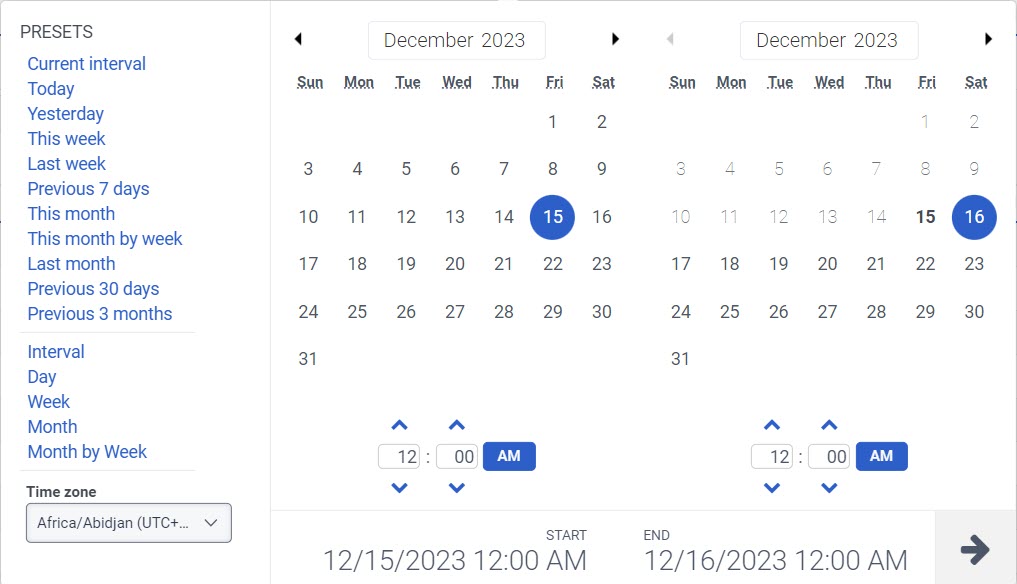
To filter metrics by date or configure a custom date range, use presets. When filtering metrics for this view, select any custom date range up to 6 weeks.
To use a preset to filter metrics, complete the following steps:
- To display the date filter, click the date.
- In the Presets list, select a preset date option.
Date presets
| Presets | Description |
|---|---|
| Current interval | Shows data for the current 30-minute time period. |
| Today | Shows data for the time period that includes the current interval. |
| Yesterday | Shows data for the previous day. |
| This week | Shows data for a Sunday through Saturday time period. |
| Last week | Shows data for the previous week, Sunday through Saturday. |
| Previous 7 days | Shows data for the previous seven days. |
| This month | Shows data for the current month, with no extra days. |
| This month by week | Shows data for the current calendar month starting on Sunday and ending on Saturday, including extra days if the month does not start on Sunday or end on Saturday. |
| Last month | Shows data for the previous calendar month with no extra days. |
| Previous 30 days | Shows data for the previous 30 days. |
| Previous 3 months | Shows data for the previous 3 months. For example, Nov 1, 2022 – Jan 31, 2023. |
| Interval | Shows data for a 30-minute time period. |
| Day | Shows data for a single 24-hour day. |
| Week | Shows data for a Sunday through Saturday time period. |
| Month | Shows data for the exact month with no extra days. If the current month is selected, you can see the data up to the current date. |
| Month by Week | Shows data for a calendar month starting on Sunday and ending on Saturday, including extra days if the month does not start on Sunday or end on Saturday. |
- To use a custom date range to filter metrics, complete the following steps:
-
- Click the date to display the date filter.
- Select a start date and an end date on the calendar, and click the filter arrow .
- To view data for a different time period using the same date presets, click the arrows on either side of the date display. For example, to view data for the previous day, click the Day preset, and then click the arrow on the left side of the date.
- To view data for a different time zone using the same date presets, from the Time zone drop-down menu, select the required time zone. You can create and save reports with the same selected time zone.
To filter by media type, perform the following:
- Click the Filter icon .
- Select the required media type.
- When filtering, you can select more than one media type. Click the relevant media type to select or deselect the type.
- You cannot select the voice and callback types at the same time.
- If you select voice, the callback option will be deselected. If you select callback, the voice interaction will be deselected.
- The available media types may vary from those shown above.
The selected media type icon is displayed above the column headers. For more information about various media types and their settings, see the Set behavior and thresholds for all interaction types section in the Create and configure queues.
Filter the view to display the information related to a specific flow.
To filter by a flow, enter name of flows you want to view in the Filter by flows(s) field. Select the flow from the search results.
To filter by DNIS, click Filter . In the DNIS field, enter the full DNIS of the DNIS number you want to filter for. For example, enter 13172223333. Do not include other characters such as +, -, or ( ).
Filter for multiple numbers at one time by entering other numbers and searching again.
Data in the view can be displayed in a chart. To view the chart, click the Show/Hide chart icon .
Displays information for interactions sent to the selected email addresses.
- Enter the full email address, such as person@example.com. The filter cannot search for a partial address.
- Filter for multiple addresses at one time by entering other addresses and searching again.
- When searching for a phone number, enter the entire phone number. For example, enter 13171002997 or 3171002997 to search for interactions sent to +1 317-100-2997.
The filter cannot search for a partial phone number and it cannot process hyphens. You can omit the country code.