
Predictive routing queue detail view
The queue detail view of an individual queue presents different aspects of the performance of the selected queue. The page contains the following tabs:
- Overview – Opens the queue detail view summarizing the impact of predictive routing for the selected period. More information about the overview tab is available in the subsequent sections of this page.
- Predictive Model – Presents the top features that contribute to the routing decisions of the selected queue. For more information, see View features that influenced predictive routing decisions.
The queue detail view contains metrics about the impact of predictive routing for the selected period.
Set a default time zone in the workspace
You can set the default time zone in the analytics workspace before viewing any analytics view.
To set the default time zone in the workspace, follow these steps:
- Click Performance > Workspace.
- Click Menu > Analytics > Analytics Workspace.
- On the left side, from the Time zone drop-down menu, select the required time zone as the default time zone for the analytics workspace.
To view details about a specific queue view, go to Performance > Workspace > Contact Center > Predictive routing, and from the list, click the name of the specific queue.
To view details about a specific queue view, perform the following:
- Click Menu > Analytics > Analytics Workspace.
- In the Default section, search for Predictive Routing and then click the view name to open it.
- Click the name of the specific queue.
For more information, see Predictive routing queue impact view.
The details of a specific queue depend on the KPI that you choose.
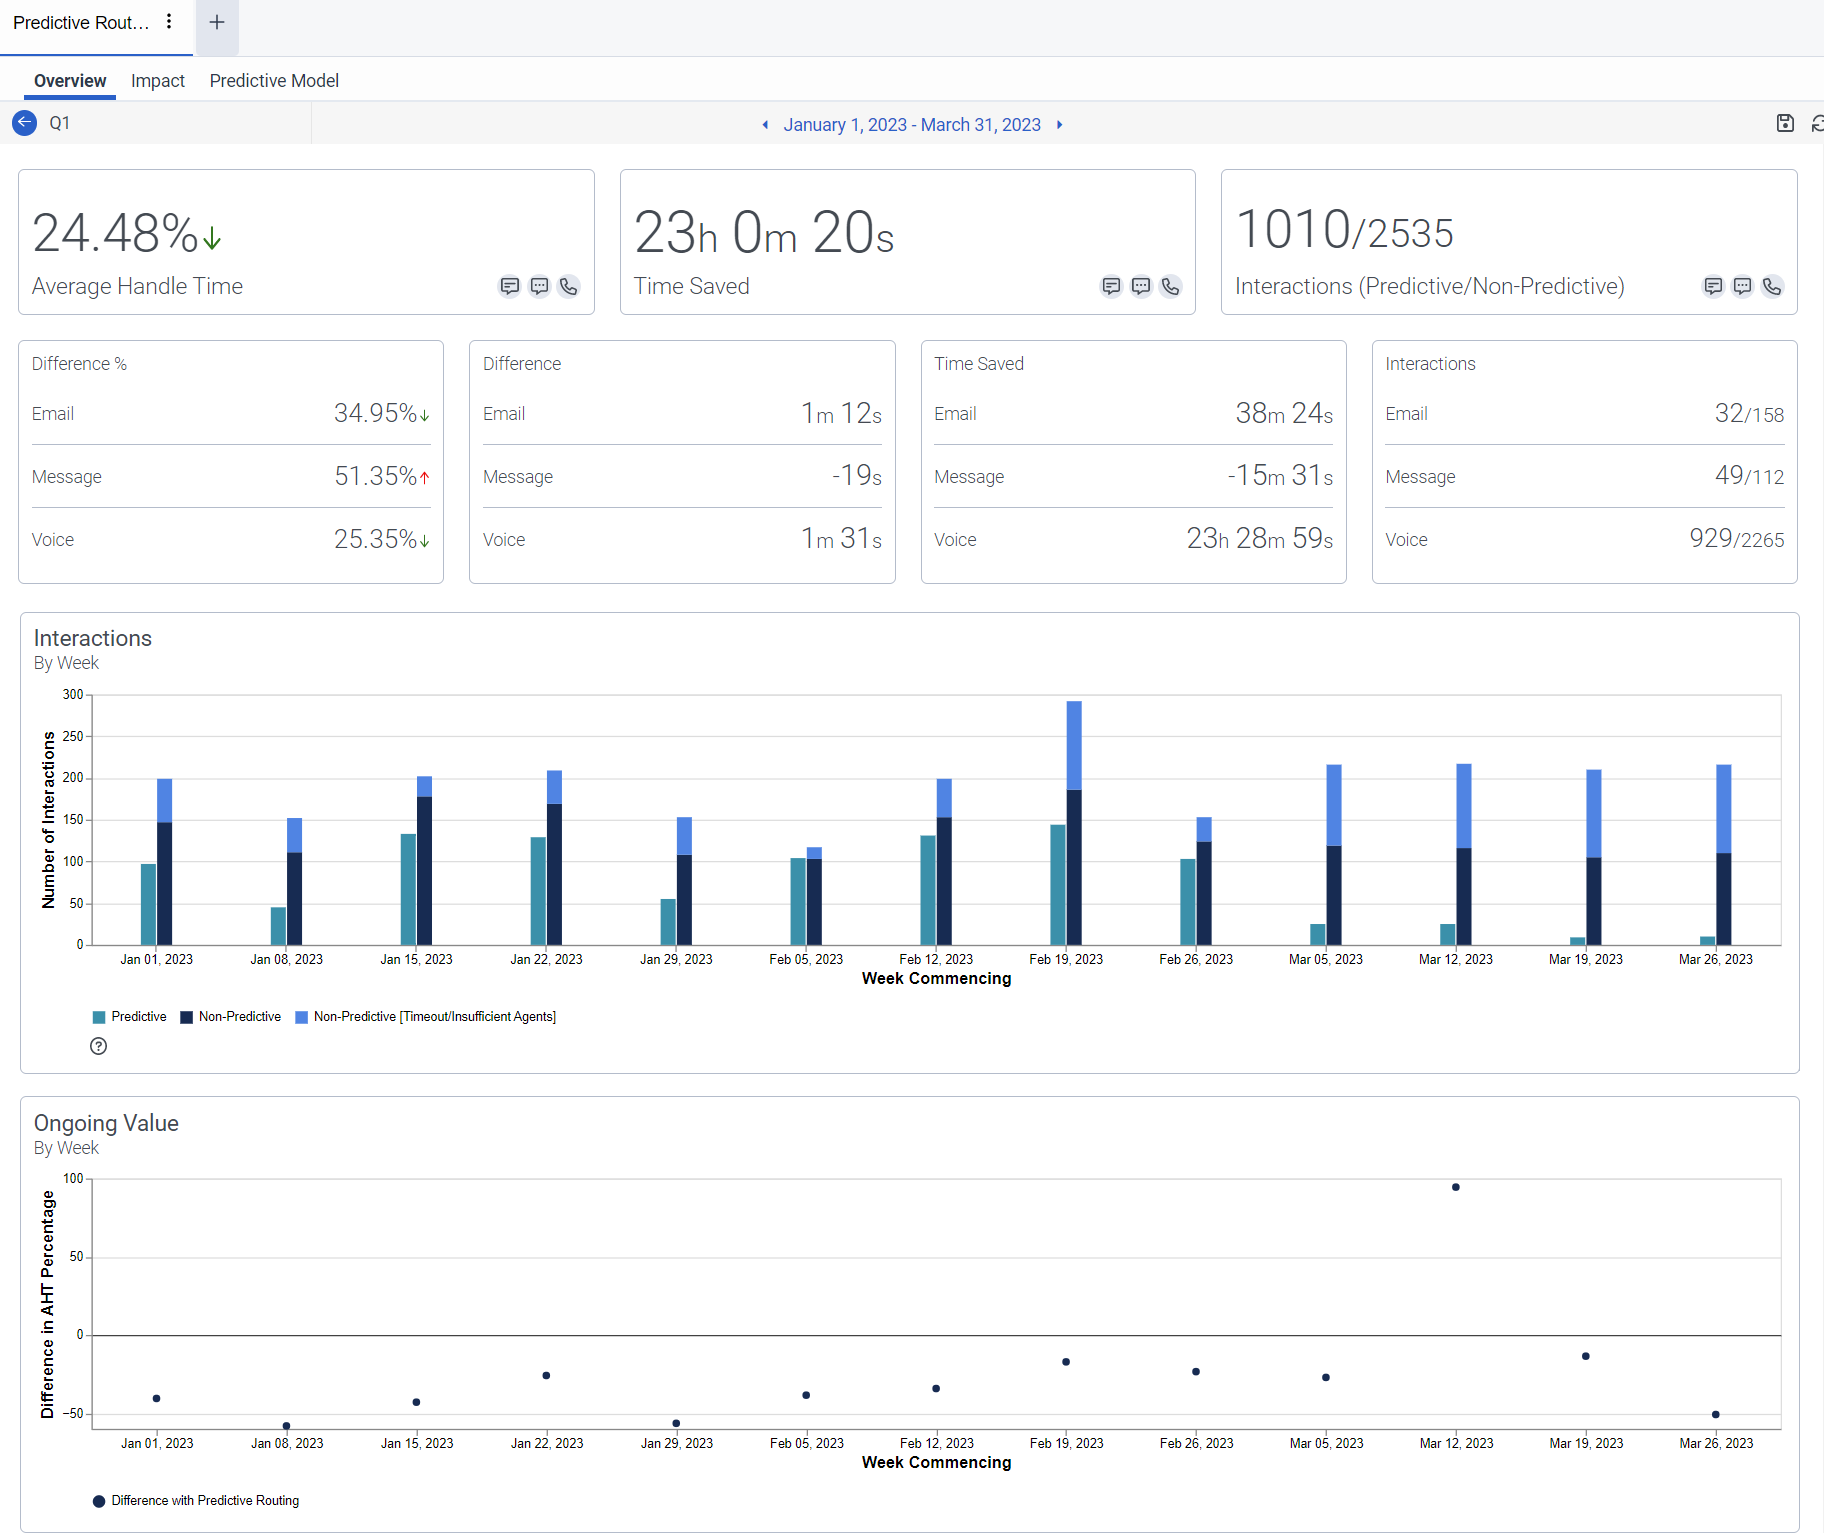
Use the Average handle time KPI to display the following details.
| Detail | Description | Notes (For reference, refer to the image) |
|---|---|---|
|
Average handle time (AHT Difference %) |
Indicates the percentage difference in the amount of handling time of interactions that routed using predictive routing compared with the amount of handling time of interactions that routed using non-predictive routing methods during the selected time period. |
When a queue supports more than one media type, a breakdown of the AHT Difference % per media type appears in addition to the AHT Difference % value. The AHT Difference % does not match the sum or average of the % of each media type. |
| AHT Difference |
Indicates the difference in the AHT value between the interactions that routed using predictive routing and the interactions that routed without predictive routing, during the selected date range per interaction. This value appears in hours, minutes, and seconds. |
The AHT Difference value is only displayed for a specific (single) media type queue. If a queue includes more than one media type, a breakdown of the AHT difference per media type appears. |
| Time saved |
Indicates the amount of handling time saved when using predictive routing during the selected time period. Time saved is calculated by multiplying the total number of interactions, using predictive routing, by the AHT difference for the specified date range. |
When a queue supports more than one media type, a breakdown of the data according to media type also appears below the Time saved table. |
| Interactions |
Indicates the total number of interactions that routed with predictive routing, compared with the number handled by other routing methods. For example, in the Single media queue image below, 1010 is the total number of interactions that routed with predictive routing, and 2535 is the total number of interactions handled without predictive routing. |
When a queue supports more than one media type, a breakdown of the data according to media type also appears. If the number of interactions of any media type is zero, the total number of interactions differs, as the zero value is not considered for the total. |
| Interactions bar chart |
Displays predictive routing and non-predictive routing volumes for the selected date range in weekly intervals. If Genesys Cloud finds no qualifying agent before predictive routing times out, or if the number of agents in the queue is three or fewer, the interaction routes via standard routing, which is the fallback routing method. For more information about the agent selection process, see the Agent selection process. |
The first week shown in the chart starts from the first day of the selected date range. The last week is a full or partial week, depending on the selected date range. The Non-Predictive (Timeout/Insufficient Agents) bar represents all the interactions where Genesys Cloud attempted predictive routing but instead used non-predictive routing methods. |
| Ongoing value (AHT Difference % Scatter plot) |
This scatter plot depicts weekly AHT Difference % values above or below a zero line. A dot on the zero line indicates that predictive routing did not make a difference in the AHT of predictive interactions compared with non-predictive interactions. Positive values above the zero line indicate that interactions routed using predictive routing have, on average, a longer handle time than interactions routed without predictive routing. Values below the zero line indicate that interactions routed using predictive routing have a shorter handle time than interactions routed without predictive routing. To see data for that specific date, hover above one of the points on the graph. |
The first week shown in the chart starts from the first day of the selected date range. The last week is a full or partial week, depending on the selected date range. |
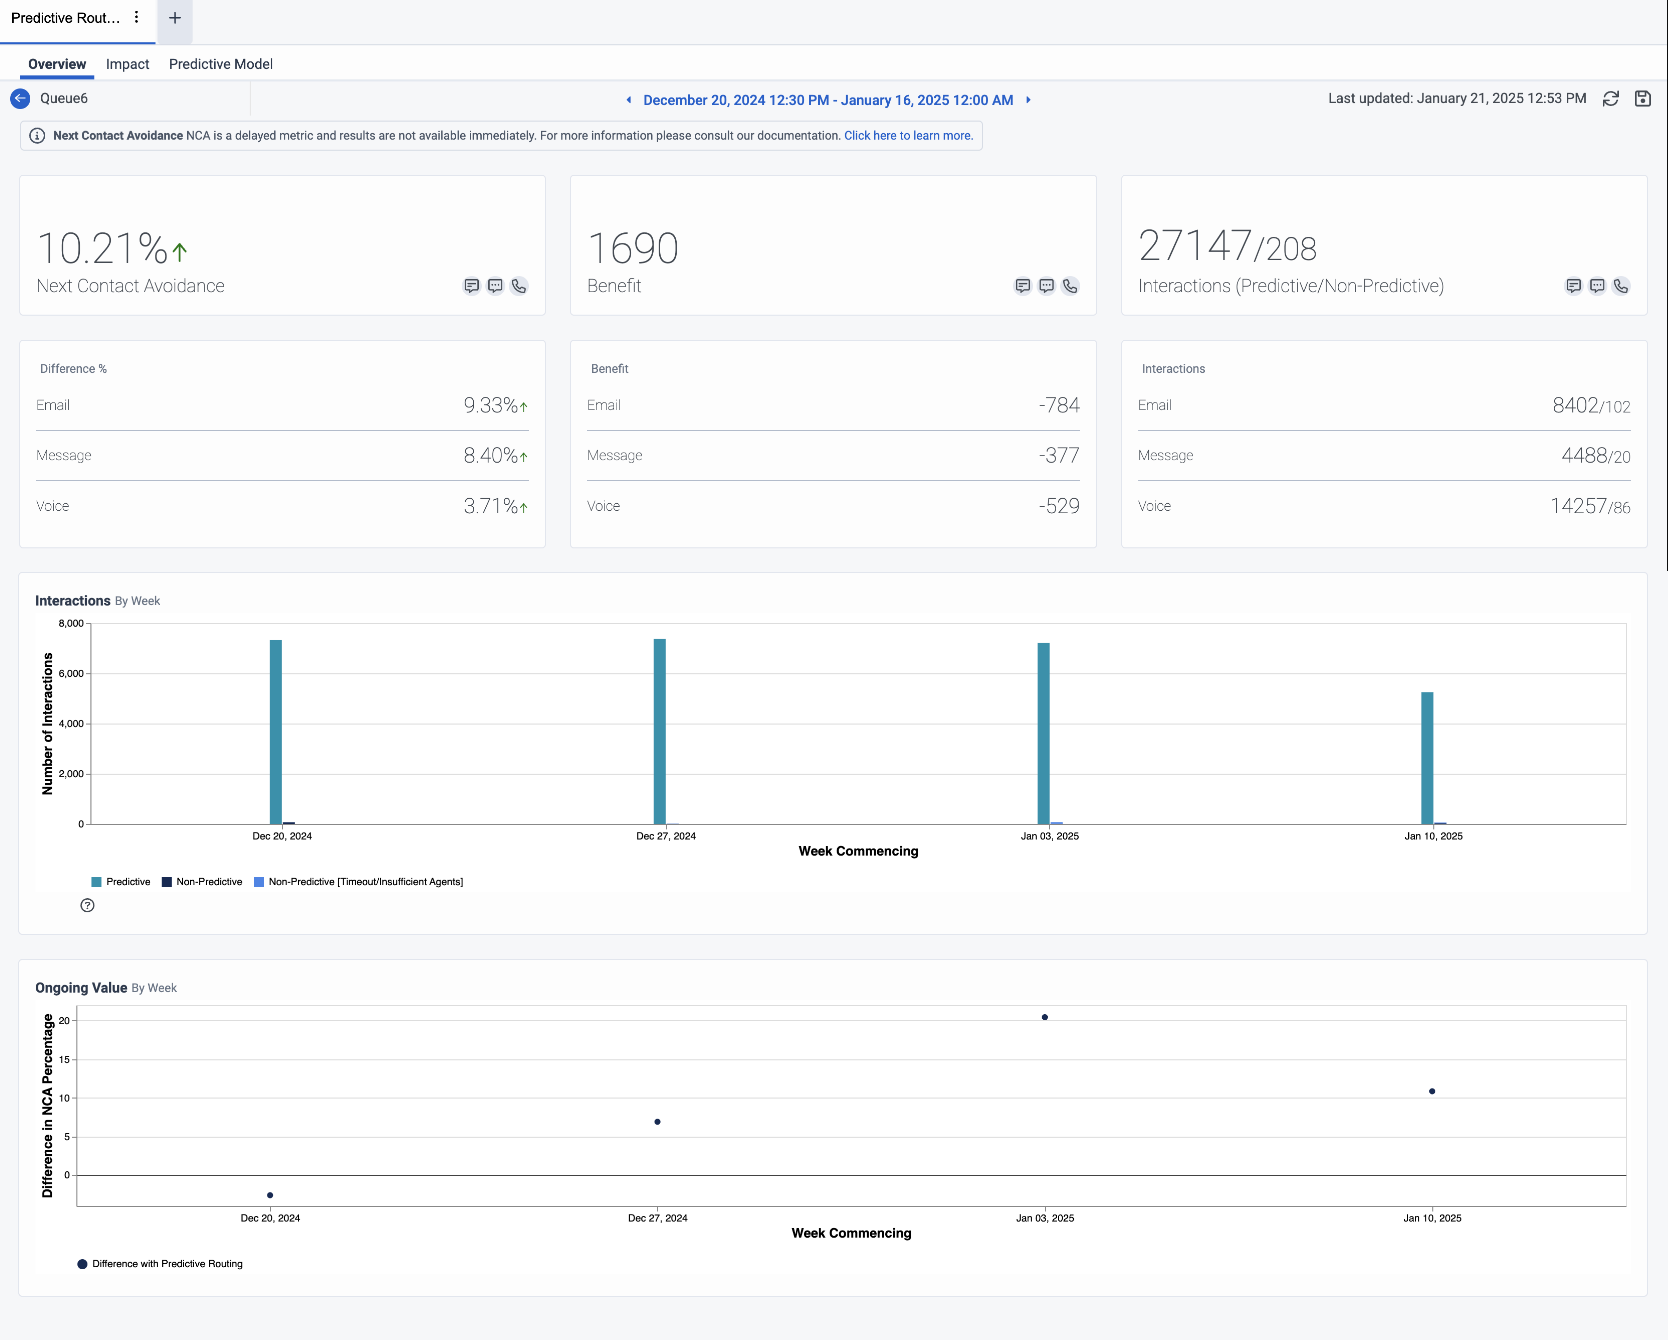
Use the Next contact avoidance KPI to display the following details.
| Detail | Description | Notes (For reference, refer to the image) |
|---|---|---|
|
Next Contact Avoidance (NCA Difference %) |
Indicates the percentage difference in the number of repeat contact avoided interactions that routed using predictive routing compared with the number of repeat contact avoided interactions that routed using non-predictive routing methods during the selected time period. |
When a queue supports more than one media type, a breakdown of the NCA Difference % per media type appears, in addition to the NCA Difference % value. The NCA Difference % does not match the sum or average of the % of each media type. |
| Benefit |
Indicates the number of repeated contact-avoided interactions when using predictive routing during the selected time period. The benefit is calculated based on the number of repeated contacts avoided. |
When a queue supports more than one media type, a breakdown of the data according to media type also appears below the Benefit table. |
| Interactions |
Indicates the total number of interactions that routed with predictive routing compared with the number handled by other routing methods. For example, in the Single media queue image below, 27147 is the total number of interactions that routed with predictive routing, and 208 is the total number of interactions handled without predictive routing. |
When a queue supports more than one media type, a breakdown of the data according to media type also appears. If the number of interactions of any media type is zero, the total number of interactions differs, as Genesys Cloud does not consider the zero value for the total. |
| Interactions bar chart |
Displays predictive routing and non-predictive routing volumes for the selected date range in weekly intervals. If Genesys Cloud finds no qualifying agent before predictive routing times out, or if the number of agents on the queue is three or fewer, the interaction routes via standard routing, which is the fallback routing method. For more information about the agent selection process, see the Agent selection process. |
The first week shown in the chart starts from the first day of the selected date range. The last week is a full or partial week, depending on the selected date range. The Non-Predictive (Timeout/Insufficient Agents) bar represents all the interactions where Genesys Cloud attempted predictive routing but instead used non-predictive routing methods. |
| Ongoing value (NCA Difference % Scatter plot) |
This scatter plot depicts weekly NCA Difference % values above or below a zero line. A dot on the zero line indicates that predictive routing did not make a difference in the NCA of predictive interactions compared with non-predictive interactions. Positive values above the zero line indicate that predictive routing performance improved. Negative values below the zero line indicate that predictive routing is not providing better results than other routing methods. To see data for that specific date, hover above one of the points on the graph. |
The first week shown in the chart starts from the first day of the selected date range. The last week is a full or partial week, depending on the selected date range. |
- To change the time period, click the date at the top of the view and select a different date.
- To return to the Predictive routing list, click the following back icon next to the queue view name
 .
.