View bot and digital bot metrics in the Optimization dashboard
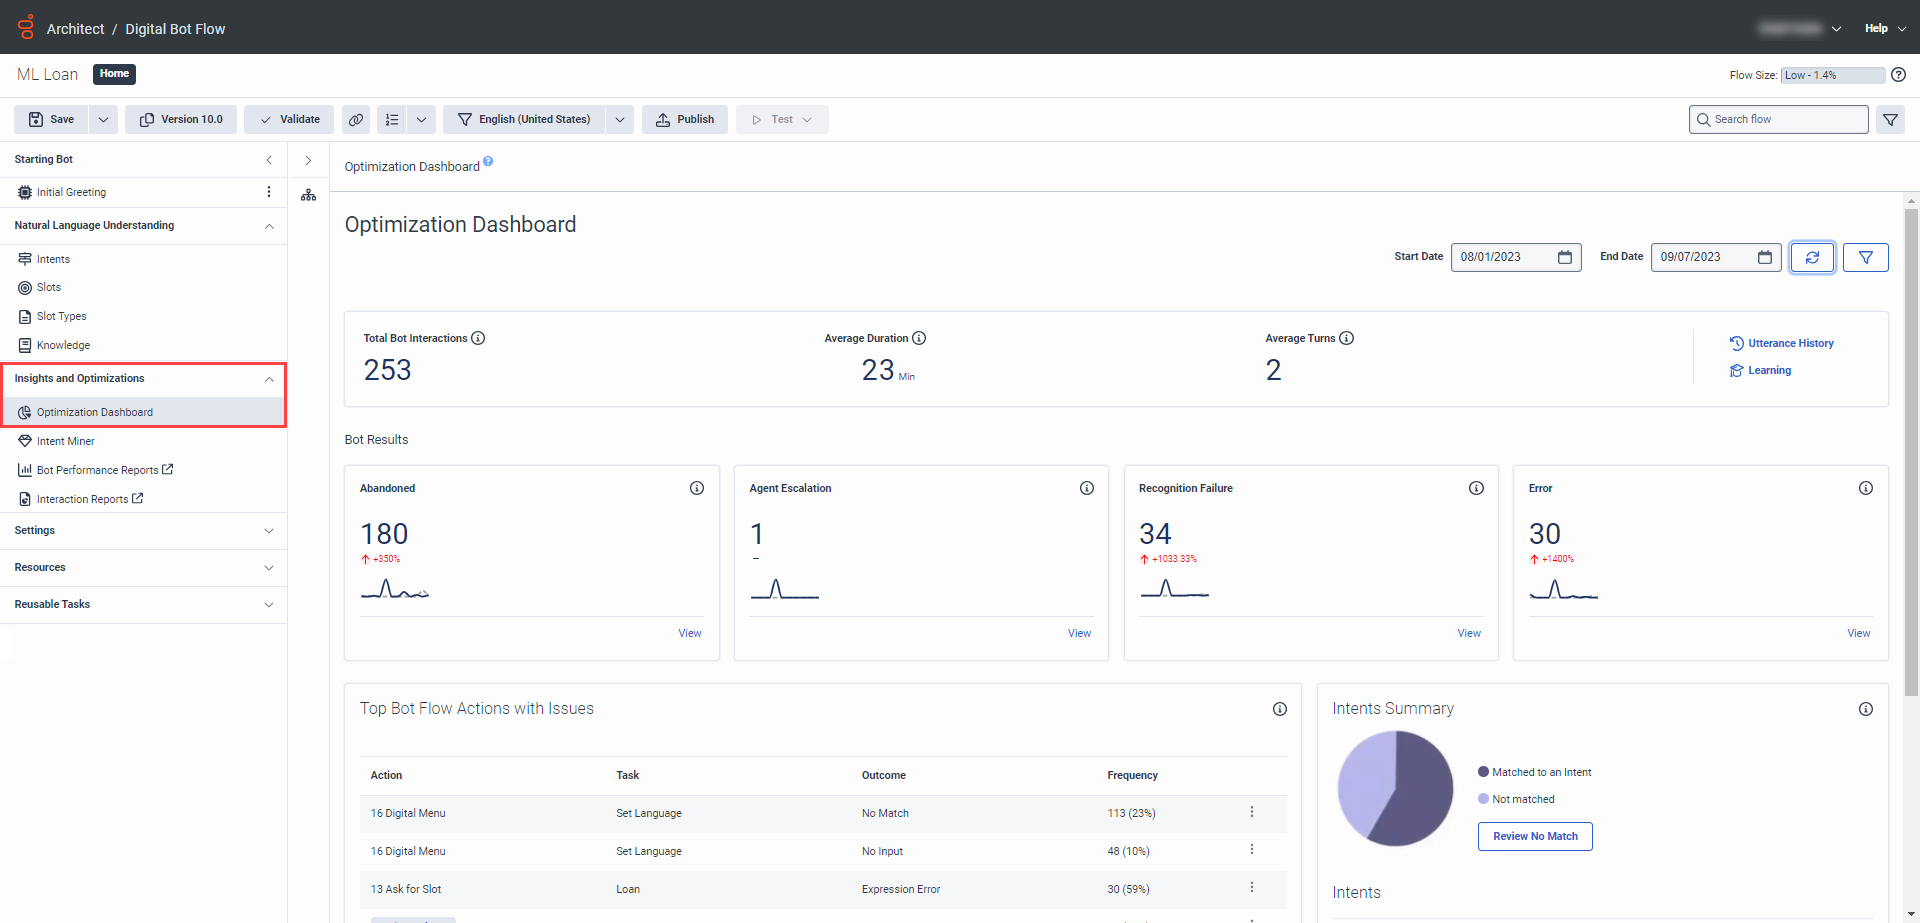
Use the Optimization dashboard in Architect to view performance and high-level operational metrics for a selected Genesys Dialog Engine Bot Flow or Genesys Digital Bot Flow. This data helps you improve and troubleshoot your bot flows. You can also filter these results by specifying a date range or a configured language.
The dashboard provides a single location to review areas for improvement. The dashboard also links directly to key areas in the flow or the conversations to resolve any issues; allowing you to more easily optimize your voice or digital bot flow. Access the dashboard in the Architect > [selected Bot Flow or Digital Bot Flow] > Insights & Optimizations menu and view this key information:
- Total bot interactions, average duration, and average turns
- The state in which the bot ends, including abandoned, agent escalation, recognition failure, and error
- Top bot flow actions that contain issues for review
- Intent summary information to show no matches for your review and top frequent intents
- Links to the Utterance History view and the Learning view
Click the image to enlarge.
The following sections describe how to use the Optimization dashboard. To view the most recent data, click Refresh .
Select a date range
You can change the default date range in the Optimization dashboard. To set another range, use the Start Date and End Date boxes.
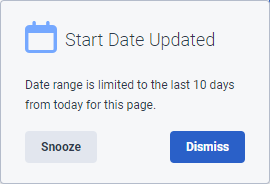
The Utterance History view and the Bot Conversation Library only retain data from the last 10 days from today’s date. If you select a range of time that is longer than 10 days in the Optimization dashboard, then when you open the Utterance History view or the Bot Conversation Library view, a message tells you of the date range limit.
- To hide the message until the next time that you review the page with the modified date range, click Snooze. These reminders appear each time that you access the view.
- To prevent the message from appearing again, click Dismiss.
Filter by language
If you configure more than one language for the bot or digital bot flow, you can view optimization results separately for each language.
- From the Optimization Dashboard, click Filter .
- Under Language Filter, click All Languages and then select the language that contains the optimization results to view.
Metrics
The Optimization dashboard contains data for the following metrics:
- Total Bot Interactions: The total number of users that interacted with the bot.
- Average Duration: The average length of time, in minutes, that users interacted with the bot. If the average duration for a digital bot is higher than expected, best practice recommends that you consider reviewing the No Input Timeout feature in Settings > User Input.
- Average Turns: The average number of steps that a user encounters with the bot; the number of times the bot processed user activity.
In the metrics section, you can perform these tasks:
- To view the bot flow’s utterance history and complete details about conversations related to the bot, click Utterance History.
- To open the Learning view and improve your bot by training it to recognize utterances from live users, click Learning.
- To return to the dashboard, click the Optimization Dashboard breadcrumb link.
- Ranges within 10 days are used and the date displays accordingly.
- Ranges outside 10 days default to the last 10 days, and the Start Date Updated message appears.
- The start date outside 10 days sets the start date to 10 days ago. The Start Date Updated message with the updated date appears.
- The end date within the 10 days is used and not adjusted.
Click the image to enlarge.

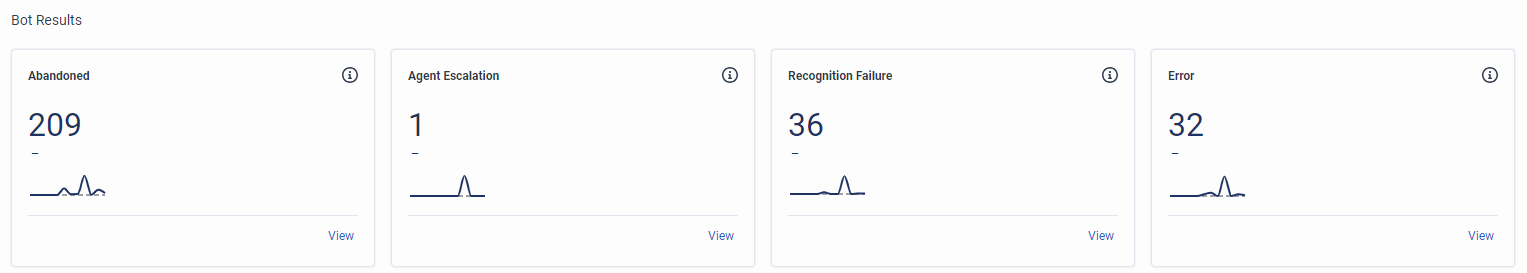
Bot results
The Bot Results section of the Optimization dashboard contains results for how the bot conversation ends and includes the following metrics:
- Abandoned: Occurs in voice bots when the caller ends the call or in digital bots when the conversation expires due to participant activity.
- Agent Escalation: Occurs when the bot detects a customer’s preference to speak to an agent without a specific intent to capture this behavior. For more information, see Agent escalation in bot flows.
- Recognition Failure: Occurs when the bot fails a specific number of times to understand the participant as set in the Max No Match setting, or the bot fails a specific number of times to return a response as set in the Max No Input setting, thus ending the conversation. Note: The recognition failure metric in the Optimization dashboard always shows 0 when the recognition failure handling falls back to a reusable task. To view the no match metric where applicable, access the Learning tab or view the Top bot flow actions with issues section.
- Error: Occurs when the bot encounters other issues, such as a problem with an expression. For more information, see Call Bot Flow action.
In this section, you can perform tasks that help you understand how you can modify your bot for optimization:
- To see trending data from the current period in a solid line, and also data from the previous period in the same number of days in a dotted line, hover over the graph in each tile. For example, if you set the Optimization dashboard from July 1, 2023 to July 31, 2023, then the graph shows that data in a solid line and also shows data from June 1, 2023 to June 30, 2023 in a dotted line. The graph also shows the difference, in percentage, between the two periods.
- To open the Bot Conversation Library, where you can see a list of conversations related to the particular bot result, click View below any of these tiles. View details such as session ID, bot result, date of occurrence, and reason for the result.
- To return to the dashboard view, click the Optimization Dashboard breadcrumb link.
Click the image to enlarge.
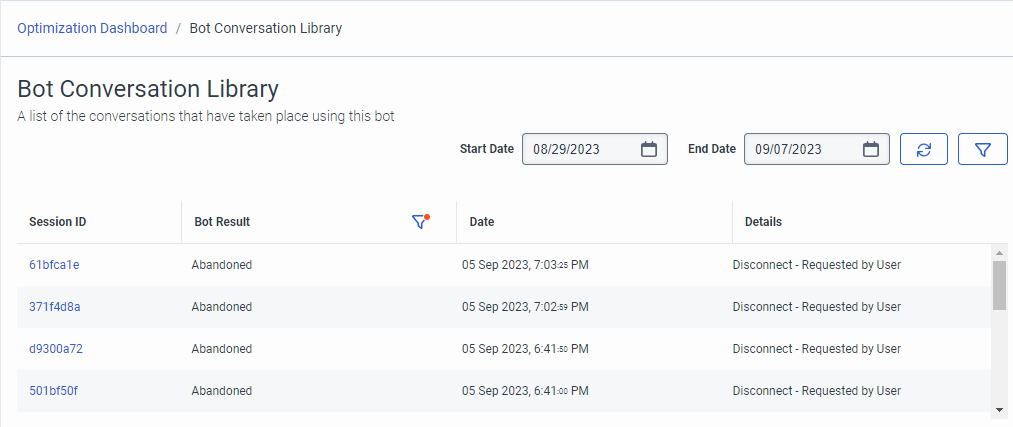
Bot Conversation Library
The Bot Conversation Library displays separate, unique bot conversations and filters them by the language that you set in the Optimization dashboard and by the tile that you click. For example, if you click View in the Abandoned tile, then the library shows only the abandoned conversations.
- Ranges within 10 days are used and the date displays accordingly.
- Ranges outside 10 days default to the last 10 days, and the Start Date Updated message appears.
- The start date outside 10 days sets the start date to 10 days ago. The Start Date Updated message with the updated date appears.
- The end date within the 10 days is used and not adjusted.
In this view, you can perform these tasks:
- View details about the conversation, such as bot result, date of occurrence, and reason for the result, click a session ID.
- To view conversations for another language, click Filter and select the language. A red asterisk on the filter icon indicates that a filtered language is in place. This action does not change the language already set in the Optimization dashboard.
- To view the most recent data, click Refresh .
- To change the date range, select the desired range in the Start Date and End Date boxes.
Click the image to enlarge.
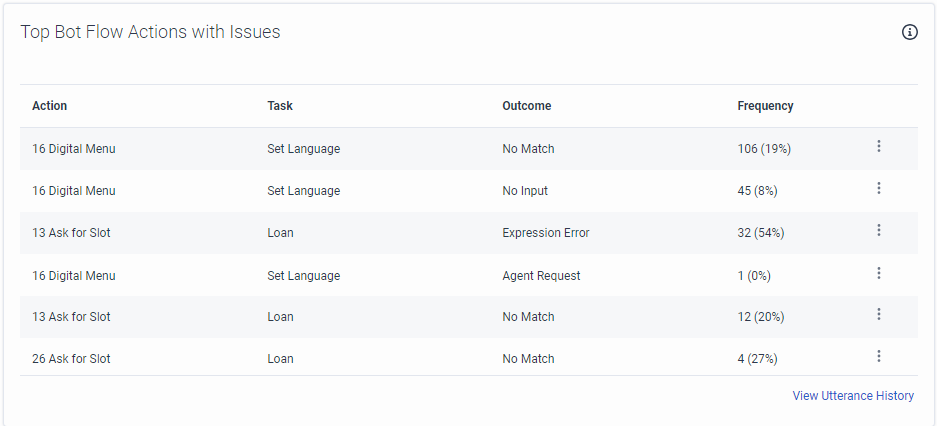
Top bot flow actions with issues
This section explores a lower level into the bot and shows you specific information about the top individual actions in the bot flow with issues that you may want to address:
- Action name and ID
- Task in which the action resides, if applicable
- Outcome, such as no match, no input, expression error, confirmation prompted, and no confirmation.
- Frequency in which the issue occurred, both total number and percentage.Note: Architect calculates the count based on the number of turns. For example, each turn that has an issue counts as a frequency of one. A conversation that contains a single action with three No Matches counts as a frequency of three. Architect calculates the percentage based on the count of the issues for that action, divided by the total count for that action, including successful turns. For example, if the total count of the Digital Menu action is 120 and the count of No Matches is 30, then the result is 25%.
In this section, follow these steps:
- Next to a specific action, click More .
- From the menu that appears, choose View Bot Flow or View Utterance History.
- View Bot Flow: Select this option to open the area of the bot flow in which this issue exists.
- View and modify the action as necessary.
- To return to the dashboard, under Insights and Optimizations, click Optimization Dashboard.
- View Utterance History: Select this option to open a list of utterances that relate to this action and issue.
- To view the conversation and information such as prompt or utterance, action, outcome, and other details, click an utterance .
- Click View Interaction and open the Interactions view for further details about the conversation.
- To return to the dashboard, click Optimization Dashboard.
- View Bot Flow: Select this option to open the area of the bot flow in which this issue exists.
Click the image to enlarge.
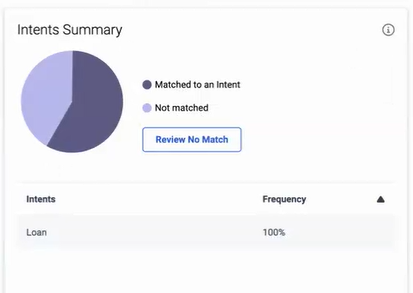
Intents summary
This section displays the breakdown of the most frequent intents. Here, review the utterances that matched to an intent or not, and review the utterances with no match. You can perform these tasks:
- To view the percentage and category of utterances that matched or did not match to an intent, hover over an area in the pie chart.
- To open the Learning view with the last 10 days of data and improve your bot by training it to recognize utterances from live users, click Review No Match.
- To switch between the top and bottom frequency intents, click the triangle next to Frequency.