Gather Chrome console logs
When problems occur, console and network logs provide visibility into the actions and events on an agent’s computer. When combined with Cloud-side logging, browser logs (console logs and network logs) provide Customer Care with a full picture of an issue. Troubleshooting issues without complete information can be difficult, if not impossible.
The method to get a console log on Mac and Windows is the same:
-
In your Chrome browser, click and then More tools > Developer tools.
Note: It is normal to see that tracing is already running in the Console upon opening. -
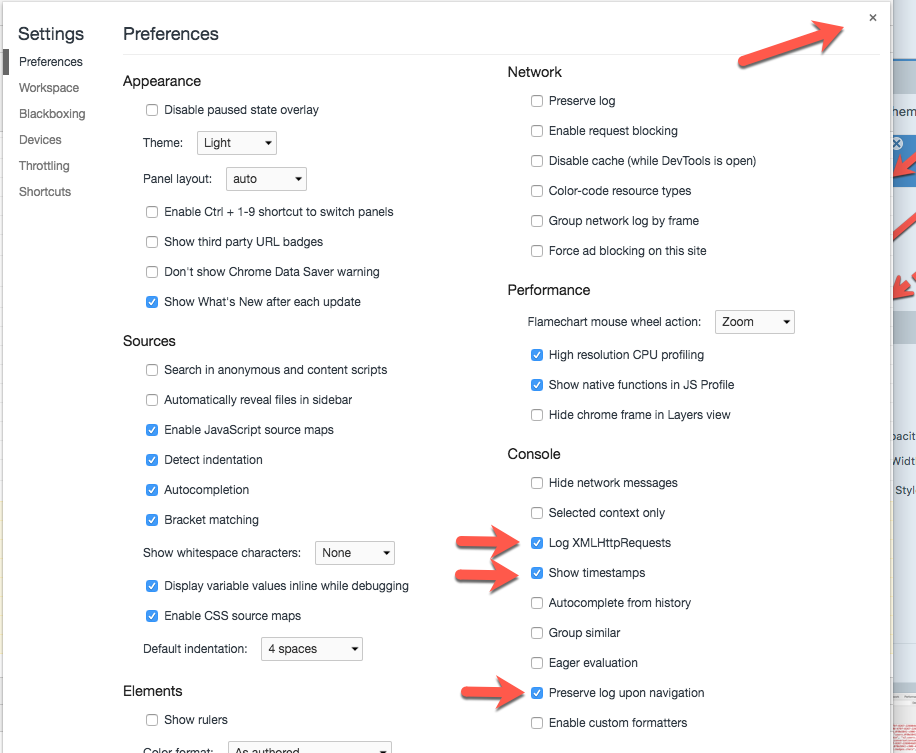
To the upper right of the Developer tools menu, click the settings icon .
- Under the Console section, click the following check boxes:
- Log XMLHttpRequests
- Show timestamps
- Preserve log upon navigation
- To close the page, click at the upper right corner.
-
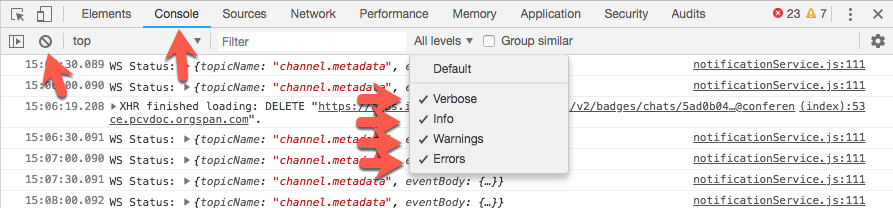
On the Console tab, to the right of the Filter field, click the Log level list and select any filter level that is not already selected. When you select all the levels, the log level selection reads All levels.
- To clear the console, click .
- Leave the console open and reproduce the steps for the issue under investigation.
- After you reproduce the issue, return to the console.
- Right-click and save the log file.Note: If you copy or move log files soon after saving, they can break. Ensure to wait for the data transfer to complete after saving the file and then, move the file to a different location or upload the file to the Support ticket.
- Upload the file to the Support ticket along with any other requested information. Use My Support to open and manage your support cases.