
Workitem Performance view
The following permissions:
- Workitems > Workbin > View
- Workitems > Worktype > View
- Analytics > taskManagementAggregate > View
To access the list view:
- Workitems > queryJob > All Permissions, Add, or View
- Workitems > queryJobResults > All Permissions or View
The Workitem Performance view displays the number of workitems across all workbins and their related worktypes and statuses. The supervisors and the administrators can use these statistics to understand the amount of work that comes into the contact center and the amount of work accumulated via the predefined process flows.
Available columns
To view the available columns, see the Workitem Performance view section in the View available columns in performance views by category article.
- To view the consolidated list of available columns in the performance views, see Consolidated view of available columns in performance views.
- To view the list of available columns in the performance views by category, see View available columns in performance views by category.
Set a default time zone in the workspace
You can set the default time zone in the analytics workspace before viewing any analytics view.
To set the default time zone in the workspace, follow these steps:
- Click Performance > Workspace.
- Click Menu > Analytics > Analytics Workspace.
- On the left side, from the Time zone drop-down menu, select the required time zone as the default time zone for the analytics workspace.
To see the Workitem Performance view, click Performance > Workspace > Contact Center > Workitem Performance. To see the Workitem Performance view, perform the following:
- Click Menu > Analytics > Analytics Workspace.
- In the Default section, search for Workitem Performance and then click the view name to open it.
The top of the view displays the totals for that page. To display a graph of a metric per interval within the date range, select a metric in the total row.
To save the view with your filter and column settings, click Save View .
To export the data in the view, click Toggle export panel .
Customize the view
To show only certain data and to manage your exports, customize the Workitem Performance view. For example, you can choose to show only certain columns or filter to see certain types of interactions.
Data in the view can be displayed in a chart. To view the chart, click the Show/Hide chart icon .
To show or hide columns:
- At the top right corner of the columns, click the Pick columns icon. The Add/Remove Column pane appears.
- Click the Manage columns tab.
- (Optional) To sort the columns in ascending or alphabetical order, click Sort by > Column Name A-Z.
- (Optional) To sort the columns in descending or reverse alphabetical order, click Sort by > Column Name Z-A.
- (Optional) To categorize or uncategorize the columns, click Sort by and enable or disable the Group by Categories toggle.
- Search or scroll to select the columns you want to view. Note: You can also use keyboard navigation to choose the columns.
- Click Save. The selected columns appear on the screen. Note: The column selections appear only after saving the changes and do not apply to the table immediately.
To reorder the columns within the column picker:
- At the top right corner of the columns, click the Pick columns icon. The Add/Remove Column pane (column picker) appears.
- Click the Reorder columns tab.
- Click the grid icon
 of a column, and then drag and drop to reorder it within the column picker.
- Click to select the grid icon of the column to be reordered, and on the keyboard, press the Spacebar.
- To position the column, use the Up or Down arrow keys.
- Press the Spacebar. The chosen column is reordered.
To rearrange the columns outside the column picker, click a column header and drag it.
To reset a view to default column settings, click Reset view to defaults .
You can select up to 20 columns.
To enter the names of the workbins you want to view, click Filter workbin(s) . Enter the name of the workbin and select the workbin from the search results. You can continue to enter and select more workbins to add to the view.
Filter by selecting multiple workbins
You can select multiple workbins to filter by.
- In the workbin row, select the check box.
- To add filters, select more check boxes.
- Click Add to filters.
To customize analytics views, use the date filter.
To filter metrics by date or configure a custom date range, use presets. When filtering metrics for this view, select any custom date range up to one month.
To use a preset to filter metrics, complete the following steps:
- Click the date to display the date filter.
- In the Presets list, select a preset date option.
Date presets
| Presets | Description |
|---|---|
| Today | Shows data for the time period that includes the current interval. |
| Yesterday | Shows data for the previous day. |
| This week | Shows data for a Sunday through Saturday time period. |
| Last week | Shows data for the previous week and Sunday through Saturday. |
| Previous 7 days | Shows data for the previous seven days. |
| This month | Shows data for the current month with no extra days. |
| This month by week | If the month does not start on Sunday or end on Saturday, shows data for the current calendar month starting on Sunday and ending on Saturday including extra days. |
| Last month | Shows data for the previous calendar month with no extra days. |
| Previous 30 days | Shows data for the previous 30 days. |
| Day | Shows data for a single 24-hour day. |
| Week | Shows data for a Sunday through Saturday time period. |
| Month | Shows data for the exact month with no extra days. If the current month is selected, you see the data up to the current date. |
| Month by Week | If the month does not start on Sunday or end on Saturday, shows data for a calendar month starting on Sunday and ending on Saturday including extra days. |
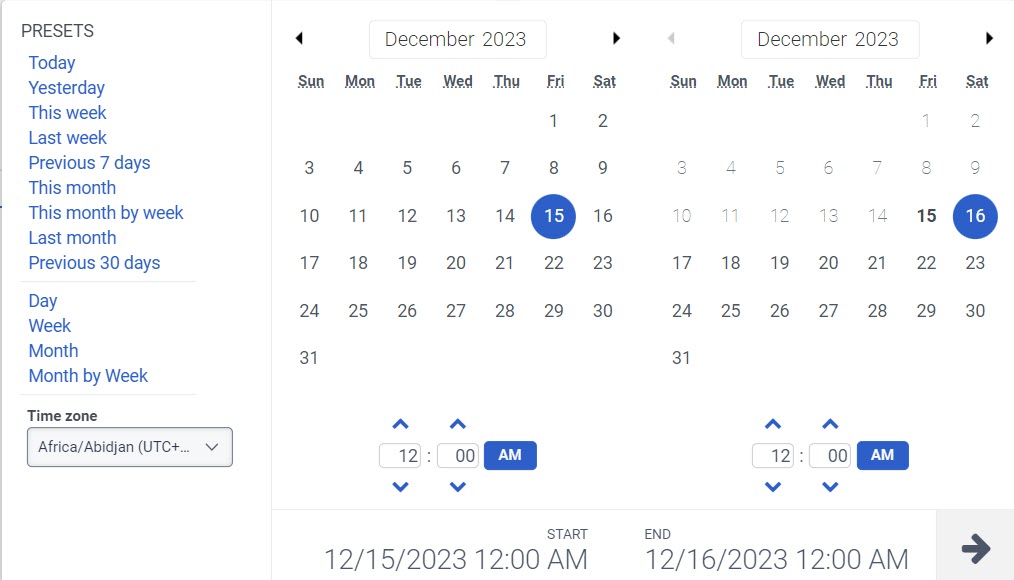
- To use a custom date range to filter metrics, complete the following steps:
-
- To display the date filter, click the date.
- Select a start date and an end date on the calendar, and click the filter arrow .
- To view data for a different time period using the same date presets, click the arrows on either side of the date display. For example, to view data for the previous day, click the Day preset, and then click the arrow on the left side of the date.
- To view data for a different time zone using the same date presets, from the Time zone drop-down menu, select the required time zone. You can create and save reports with the same selected time zone.
The global search allows you to easily find the available filters from the list of filters.
To find filters by global search:
- Click the Filter icon . The Filters pane appears.
- In the top section, in the Search for filters search box, enter the name of the preferred filter and select the filter from the search results.
To filter metrics by queue, follow these steps:
- Click the Filter icon . The Filters pane appears.
- Under Queue, in the Search for queues search box, enter the name of the queue and select the queue from the search results. You can continue to enter and select more queues to add to the view.
To filter metrics by worktype, follow these steps:
- Click the Filter icon . The Filters pane appears.
- Under Worktype, in the Filter by worktype search box, enter the name of the worktype and select the worktype from the search results. You can continue to enter and select more worktypes to add to the view.
To filter metrics by workitem assignee, follow these steps:
- Click the Filter icon . The Filters pane appears.
- Under Workitem assignee, in the Filter by assignee search box, enter the name of the assignee and select the assignee from the search results. You can continue to enter and select more assignees to add to the view.
- (Optional) To see and select inactive users in the assignee filter search, select Include inactive users.
- (Optional) To see and select deleted users in the assignee filter search, select Include deleted users.
To filter metrics by external tag, follow these steps:
- Click the Filter icon Icon included. The Filters pane appears.
- Under Worktype assignee, in the Filter by External Tag search box, enter the name of the external tag and select the external tag from the search results. You can continue to enter and select more external tags to add to the view.
To filter metrics by status, follow these steps:
- Click the Filter icon . The Filters pane appears.
- Under Status, in the Filter by status search box, enter the name of the status and select the status from the search results. You can continue to enter and select more statuses to add to the view.
To filter metrics by workitem, follow these steps:
- Click the Filter icon . The Filters pane appears.
- Under Workitem, in the Filter by workitem search box, enter the name of the workitem and select the workitem from the search results. You can continue to enter and select more workitems to add to the view.
- To edit a workbin from the Workitem Performance view page, click the more icon corresponding to the workitem and click Edit workbin .
- To edit a worktype from the Workitem Performance view page, click the more icon corresponding to the worktype and click Edit worktype .