Work with Change Daily Values and Distributions modification
The change daily values and distributions modification supports changing forecasted values for Offered and Average Handle Time (AHT) using daily and 15-minute intervals. You can view this modification in the Expanded view to ensure an effective review of the data you enter.
The view contains the following information:
| Area | Description |
|---|---|
| Enabled |
Controls whether the modification is active or inactive. |
| Metric type |
Choose from Offered or Average Handle Time. You cannot change the value once you enter a value in the Modified column (either daily or minute tables). |
| Modification |
Choose the Change daily values and distributions. You cannot change this selection once a value is entered in the Modified column in either the daily or minute intervals tables. |
| Week |
Select any week within a given forecast. Once the selection is done, the Daily table is updated and the corresponding data is displayed. |
| Daily values |
The daily values contains the following information:
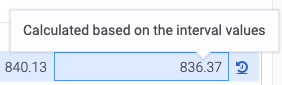
When you enter a value in the Modified column, the row automatically advances to the next row. Click a previously edited row to review the calculated values for the minute intervals. Click any row to view the corresponding distributions for that day in minutes granularity table (available within the short-term forecast date range). If there are existing modified minute granularity values, the Modified column displays the calculated value. See the tooltip to indicate that a modified value is calculated on mouse hover. The calculated values are not part of the modification and are not saved.
|
| Minute Granularity values |
The daily values contains the following information:
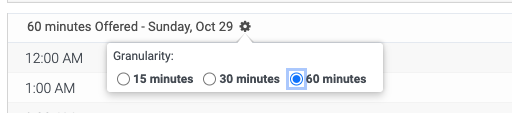
You can change the display granularity by using the column setting. This is a user setting, which controls whether the data is displayed in 15, 30, or 60 minutes granularity.
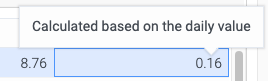
If there is an existing modified daily value, the Modified column displays the calculated value and on mouse hover, the tooltip is displayed. Calculated values are not part of the modification and are not saved.
|