
API Usage view
- Oauth > Client > View permission
The API Usage view allows you to see how many API requests that your contact center makes and which clients make those requests. If you exceed the Fair use policy for APIs, then this information can help determine which clients make the most requests and which type of request your organization uses most often. You can use that information to streamline your API usage and avoid or plan for overages.
The data in this view includes all PUT, POST, GET, or DELETE calls made from your organization in support of custom or third party applications, integrations, and solutions, including AppFoundry apps. It also includes data actions to the Genesys Cloud Public API.
This view does not include data about API requests that Genesys Cloud makes to support the function of its browser, web, and mobile apps or outbound data actions to external platforms. It also does not include API requests made explicitly by Genesys Cloud for Chrome, Genesys Cloud for Firefox, Genesys Cloud for Salesforce, and Genesys Cloud for Zendesk. Embeddable Framework applications are subject to API usage allocations.
Genesys Cloud calculates API usage data daily, as an aggregate of all API requests made between 00:00:00 and 23:59:59. This calculation is in accordance with the UTC time standard and in alignment with Genesys Cloud billing data.
To see the API Usage view, click Performance > Workspace > Other > API Usage. To see the API Usage view, perform the following:
- Click Menu > Analytics > Analytics Workspace.
- In the Default section, search for API Usage and then click the view name to open it.
This view does not include data for the current day.
API usage data calculations
For ease of use, the API Usage view displays API request dates in your local time zone. In some cases, the adjustment from UTC to your local time zone means that the date of an API request, as represented in the API Usage view, may differ from the date the request was made, according to the client’s local time zone.
Interpret the view
The view contains a graph and two main sections: OAuth Clients and API Requests. Each section has columns of data related to the specific client or request.
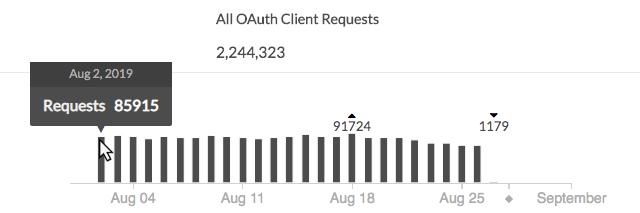
Graph of data
The graph displays all API requests for the selected time period, even if you have any filters applied to the OAuth Client and API Request sections. However, the graph does not display data when you select one day as the date range.
To see more information about the data, hover over the bars in the graph. The above a bar represents the largest amount for that time period, and the represents the lowest amount.
OAuth Clients
The OAuth clients section displays a list of clients that made API requests in the selected time period. These clients include custom or third party applications, integrations, and solutions, including AppFoundry apps. Click a client to highlight requests made by that client in the API Requests section.
API Requests
The API Requests section displays a list of all PUT, POST, GET, or DELETE calls made by OAuth clients. Click an API request to highlight the clients that made the request.
Section columns
By default, each section has four columns:
- a list of clients or API requests for that particular section
- the number of requests from the client or to the API endpoint
- the percentage of requests for the client or to the API endpoint
- a visual representation of the percentage of requests compared with the total number of requests
| Example | Column | Description |
|---|---|---|
Click the image to enlarge.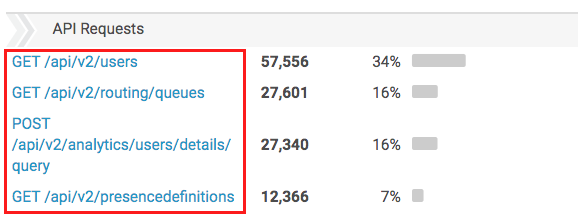 |
OAuth Client or API Request | The specific OAuth client making API requests or the specific API request that your organization made. |
Click the image to enlarge.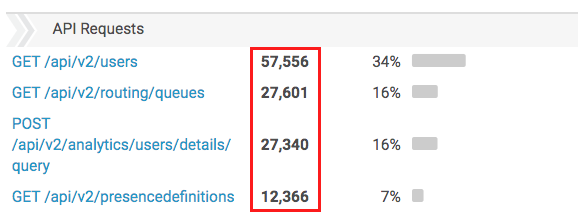 |
Number of requests | The number of requests that the OAuth client made or the number of a specific API request that your organization made. |
Click the image to enlarge.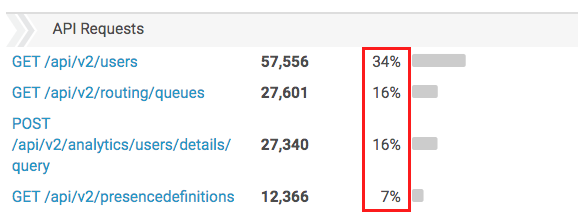 |
Percentage of requests |
The percentage of requests that the OAuth client made or the number of a specific API request that your organization made, related to the total number of requests. |
Click the image to enlarge.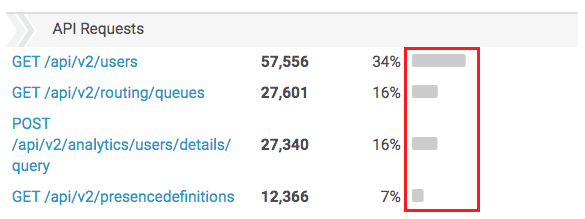 |
Visual representation | A visual representation of the percentage of requests. |
If you click a client or request to filter the data, then another column appears between the number and percentage columns. This new column displays the percentage of requests that match the filter related to the total number of requests. If no requests match the selected request filter, then the view does not display a filtered percentage.
When you filter, the other columns update to match the filter:
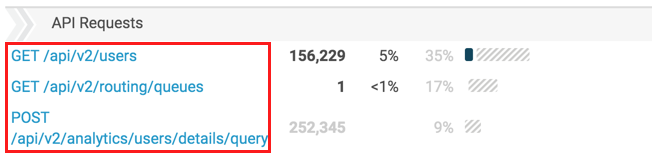
- The list of clients or API requests highlights the client or API request you clicked.
- The number of requests changes to show the number of requests that match the filter. If no requests match the filter, then the number becomes gray.
- The percentage of total requests turns gray.
- The visual representation changes from a solid bar to a bar divided to show both the percentage of requests that match the filter and the percentage of total requests. Any difference between the two percentages appears as a gray part of the bar.
| Example | Column | Description |
|---|---|---|
|
Click the image to enlarge.
|
OAuth Client or API Request | The specific OAuth client making API requests or the specific API request that your organization made. The view highlights the row you click to filter by. |
Click the image to enlarge.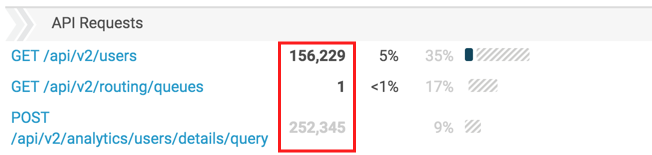 |
Number of requests |
The number of requests that the OAuth client made or the number of a specific API request that your organization made that match the filter. If no requests match the selected filter, then the number remains as the total number of requests that match the reason, but the number appears dimmed. |
Click the image to enlarge.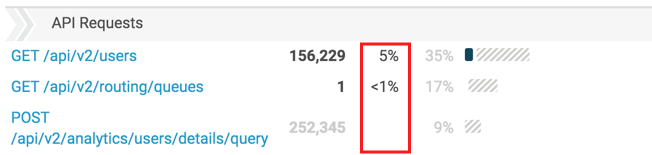 |
Percentage of filtered requests |
When you click a client or request to filter data, then this column appears and displays the percentage of requests that match the filtered client or request related to the total number of requests. If no requests match the selected filter, then the view does not display a filtered percentage. |
Click the image to enlarge.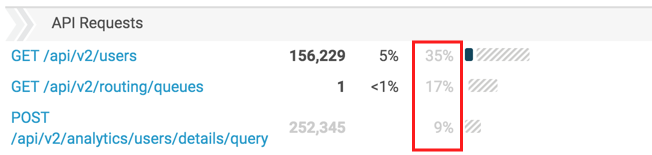 |
Percentage of requests | The percentage of requests that the OAuth client made or the number of a specific API request that your organization made, related to the total number of requests. |
Click the image to enlarge.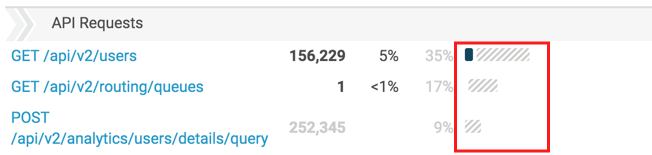 |
Visual representation |
A visual representation of the percentage of requests that match the filter and the percentage of total requests. Any difference between the two percentages appears as a gray part of the bar. |
Customize the view
Customize the view to show only certain data. To save your filter and date settings for the view, click Save .
Use the date filter to customize analytics views.
Use presets to filter metrics by date, or configure a custom date range.
To use a preset to filter metrics, complete the following steps:
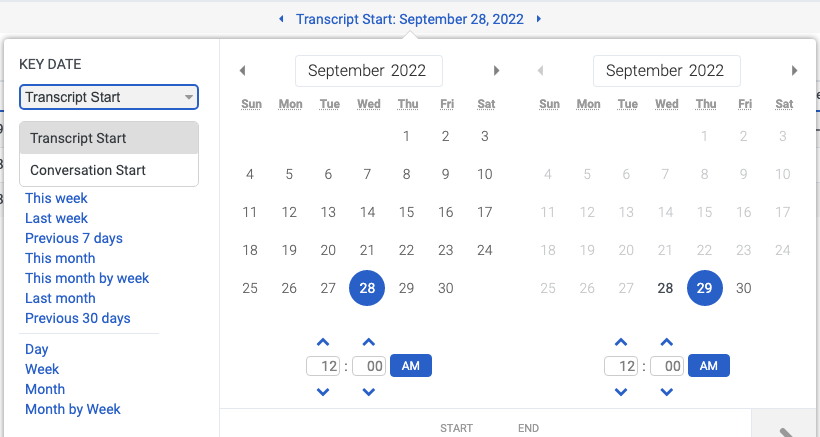
- Click the date to display the date filter.
- Under KEY DATE select Transcript Start or Conversation Start.
- In the Presets list, select a preset date option.
Date presets
| Presets | Description |
|---|---|
| Current interval |
Shows data for the current 30-minute time period. Note: Because Detail views include Interval in the data grid, the Current interval preset is not displayed for these views. |
|
Transcript Start |
Sorts the search results according to when the transcript begins. |
|
Conversation Start |
Sorts the search results according to when the conversation begins. |
| Today | Shows data for the time period that includes the current interval. |
| Yesterday | Shows data for the previous day. |
| This week | Shows data for a Sunday through Saturday time period. |
| Last week | Shows data for the previous week, Sunday through Saturday. |
| Previous 7 days | Shows data for the previous seven days. |
| This month | Shows data for the current month, with no extra days. |
| This month by week | Shows data for the current calendar month starting on Sunday and ending on Saturday, including extra days if the month does not start on Sunday or end on Saturday. |
| Last month | Shows data for the previous calendar month with no extra days. |
| Previous 30 days | Shows data for the previous 30 days. |
| Previous 3 months | Shows data for the previous 3 months. |
| Interval |
Shows data for a 30-minute time period. Note: Because Detail views include Interval in the data grid, the Interval preset is not displayed for these views. |
| Day | Shows data for a single 24-hour day. |
| Week | Shows data for a Sunday through Saturday time period. |
| Month | Shows data for the exact month with no extra days. If the current month is selected, you will see the data up to the current date. |
| Month by Week | Shows data for a calendar month starting on Sunday and ending on Saturday, including extra days if the month does not start on Sunday or end on Saturday. |
- To use a custom date range to filter metrics, complete the following steps:
-
- Click the date to display the date filter.
- Select a start date and an end date on the calendar, and click the filter arrow .
- To view data for a different time period using the same date presets, click the arrows on either side of the date display. For example, to view data for the previous day, click the Day preset, and then click the arrow on the left side of the date.
Data in the view can be displayed in a chart. To view the chart, click the Show/Hide chart icon .
To filter the data by a specific client or API request, click that request.
You can filter by either one OAuth client or one API request at a time. If you click another client or request, the filter changes to that client or request.
For more information about how the view changes when you filter, see the Section columns section in this article.