
API Usage report
- Oauth > Client > View permission
The API Usage report allows you to see how many API requests that your contact center makes and which clients make those requests. If you exceed the Fair use policy for APIs, then this information can help determine which clients make the most requests and which type of request your organization uses most often. You can use that information to streamline your API usage and avoid or plan for overages.
The data in this report includes all PUT, POST, GET, or DELETE calls made from your organization in support of custom or third-party applications, integrations, and solutions, including AppFoundry apps. It also includes data actions to the Genesys Cloud Public API.
This report does not include data about API requests that Genesys Cloud makes to support the function of its browser, web, and mobile apps or outbound data actions to external platforms. It also does not include API requests made Genesys Cloud Embedded Clients, including Genesys Cloud for Chrome, Genesys Cloud for Firefox, Genesys Cloud for Salesforce, and Genesys Cloud for Zendesk.
Genesys Cloud calculates API usage data daily, as an aggregate of all API requests made between 00:00:00 and 23:59:59. This calculation is in accordance with the UTC time standard and in alignment with Genesys Cloud billing data.
To see the API Usage report, click Admin and under Platform Usage, click API Usage click Menu > IT and Integrations > API Usage.
API usage data calculations
For ease of use, the API Usage report displays API request dates in your local time zone. In some cases, the adjustment from UTC to your local time zone means that the date of an API request, as represented in the API Usage report, can differ from the date the request was made, according to the client’s local time zone.
Interpret the report
The report contains the following sections:
- Most Active Requests
- OAuth Client Requests
- URL Requests
Each section has graphs and also the count of total API requests and total OAuth clients.
Graphs
The graphs display data for the selected time period.
To see more information about the data, hover over the bars or lines in the graph.
The API statuses represented by different colors in the graphs include:
- Status 200 – The request succeeded.
- Status 300 – The user can select a preferred representation and redirect the request to that location.
- Status 400 – The request cannot be understood by the server due to malformed syntax.
- Status 429 – Too many requests in a specified amount of time (rate limiting).
- Status 500 – The server encountered an unexpected condition, which prevented it from fulfilling the request.
For more information on status codes, see List of HTTP status codes Wikipedia article.
Most Active Requests
This section includes the following graphs:
- Top 5 Requests by OAuth Client – Displays the top five clients that made the most number of API requests in the selected time period. The graph helps you to identify the number of successful and failed API calls.
- HTTP Response Status Codes – Displays the total number of successful or failed API calls by status regardless of the client.
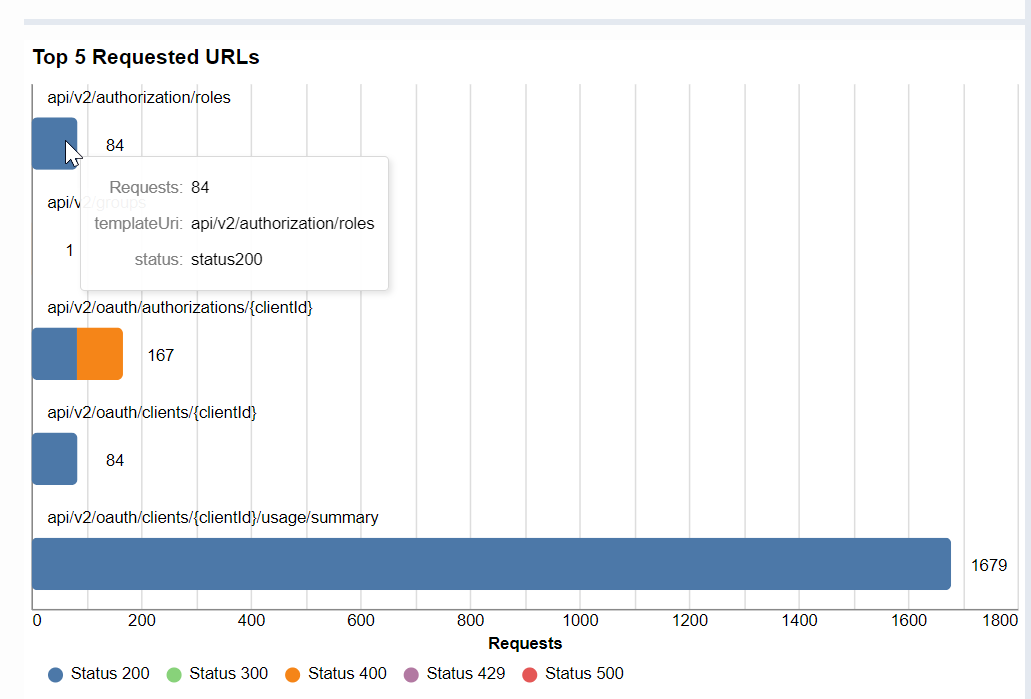
- Top 5 Requested URLs – Displays the top five URLs that resulted the most number of API calls. This graph helps you identify the URLs with failed API calls and in turn helps minimize API calls.
OAuth Client Requests
This section includes the following graphs:
- Request Counts by OAuth Client – Displays a count of the calls made by the selected OAuth clients.
- HTTP Response Status Codes – Displays the total number of successful or failed API calls by status regardless of the client.
- Request URL Counts by OAuth Client – Displays all URLs that resulted in high API calls. This graph helps you identify the URLs with failed API calls and in turn helps minimize these calls.
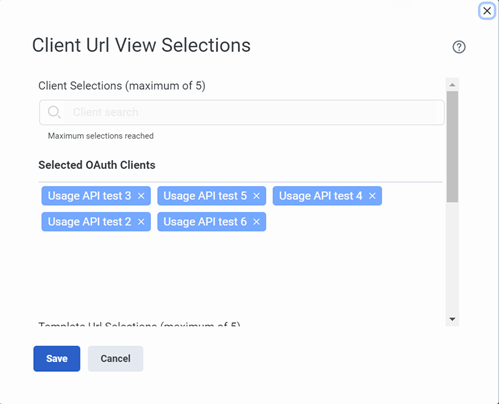
Click OAuth Client Settings and in the Client Url View Selections dialog box, specify the OAuth clients and URLs for which you want to view data in the section’s graphs. The selections made here affect all the three graphs in the OAuth Client Requests section.
URL Requests
This section includes the following graphs:
- URL Requests – Displays a list of API requests by URL.
- HTTP Response Status Codes – Displays the total number of successful or failed API calls by status regardless of the URL.
Click URL Request Settings and in the Template Url View Selections dialog box, specify the URLs for which you want to view data in the section’s graphs. The selections made here affect both graphs in the URL Requests section.
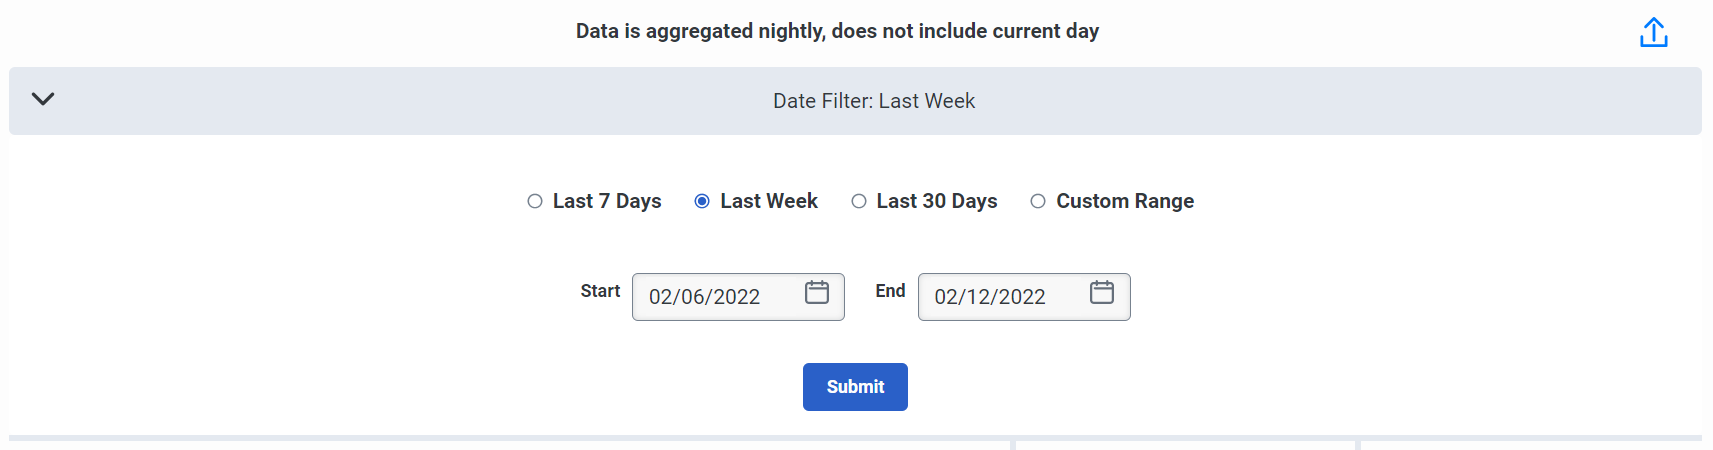
Filter information by date range
Click Expand date search filter and use the date filter to customize the report.
Export the report
To export the report into .csv format, click the Export API Usage Data option.