
Series: Historical shrinkage
Navigate the historical shrinkage view
Prerequisites
- Workforce Management > Shrinkage > View permission
- Groups > Work Teams > View permission
The shrinkage view displays the data for a management unit or work team based on your date range and granularity selection. You can view a graphical representation of the scheduled and actual shrinkage details for shrinkage over time and aggregated shrinkage.
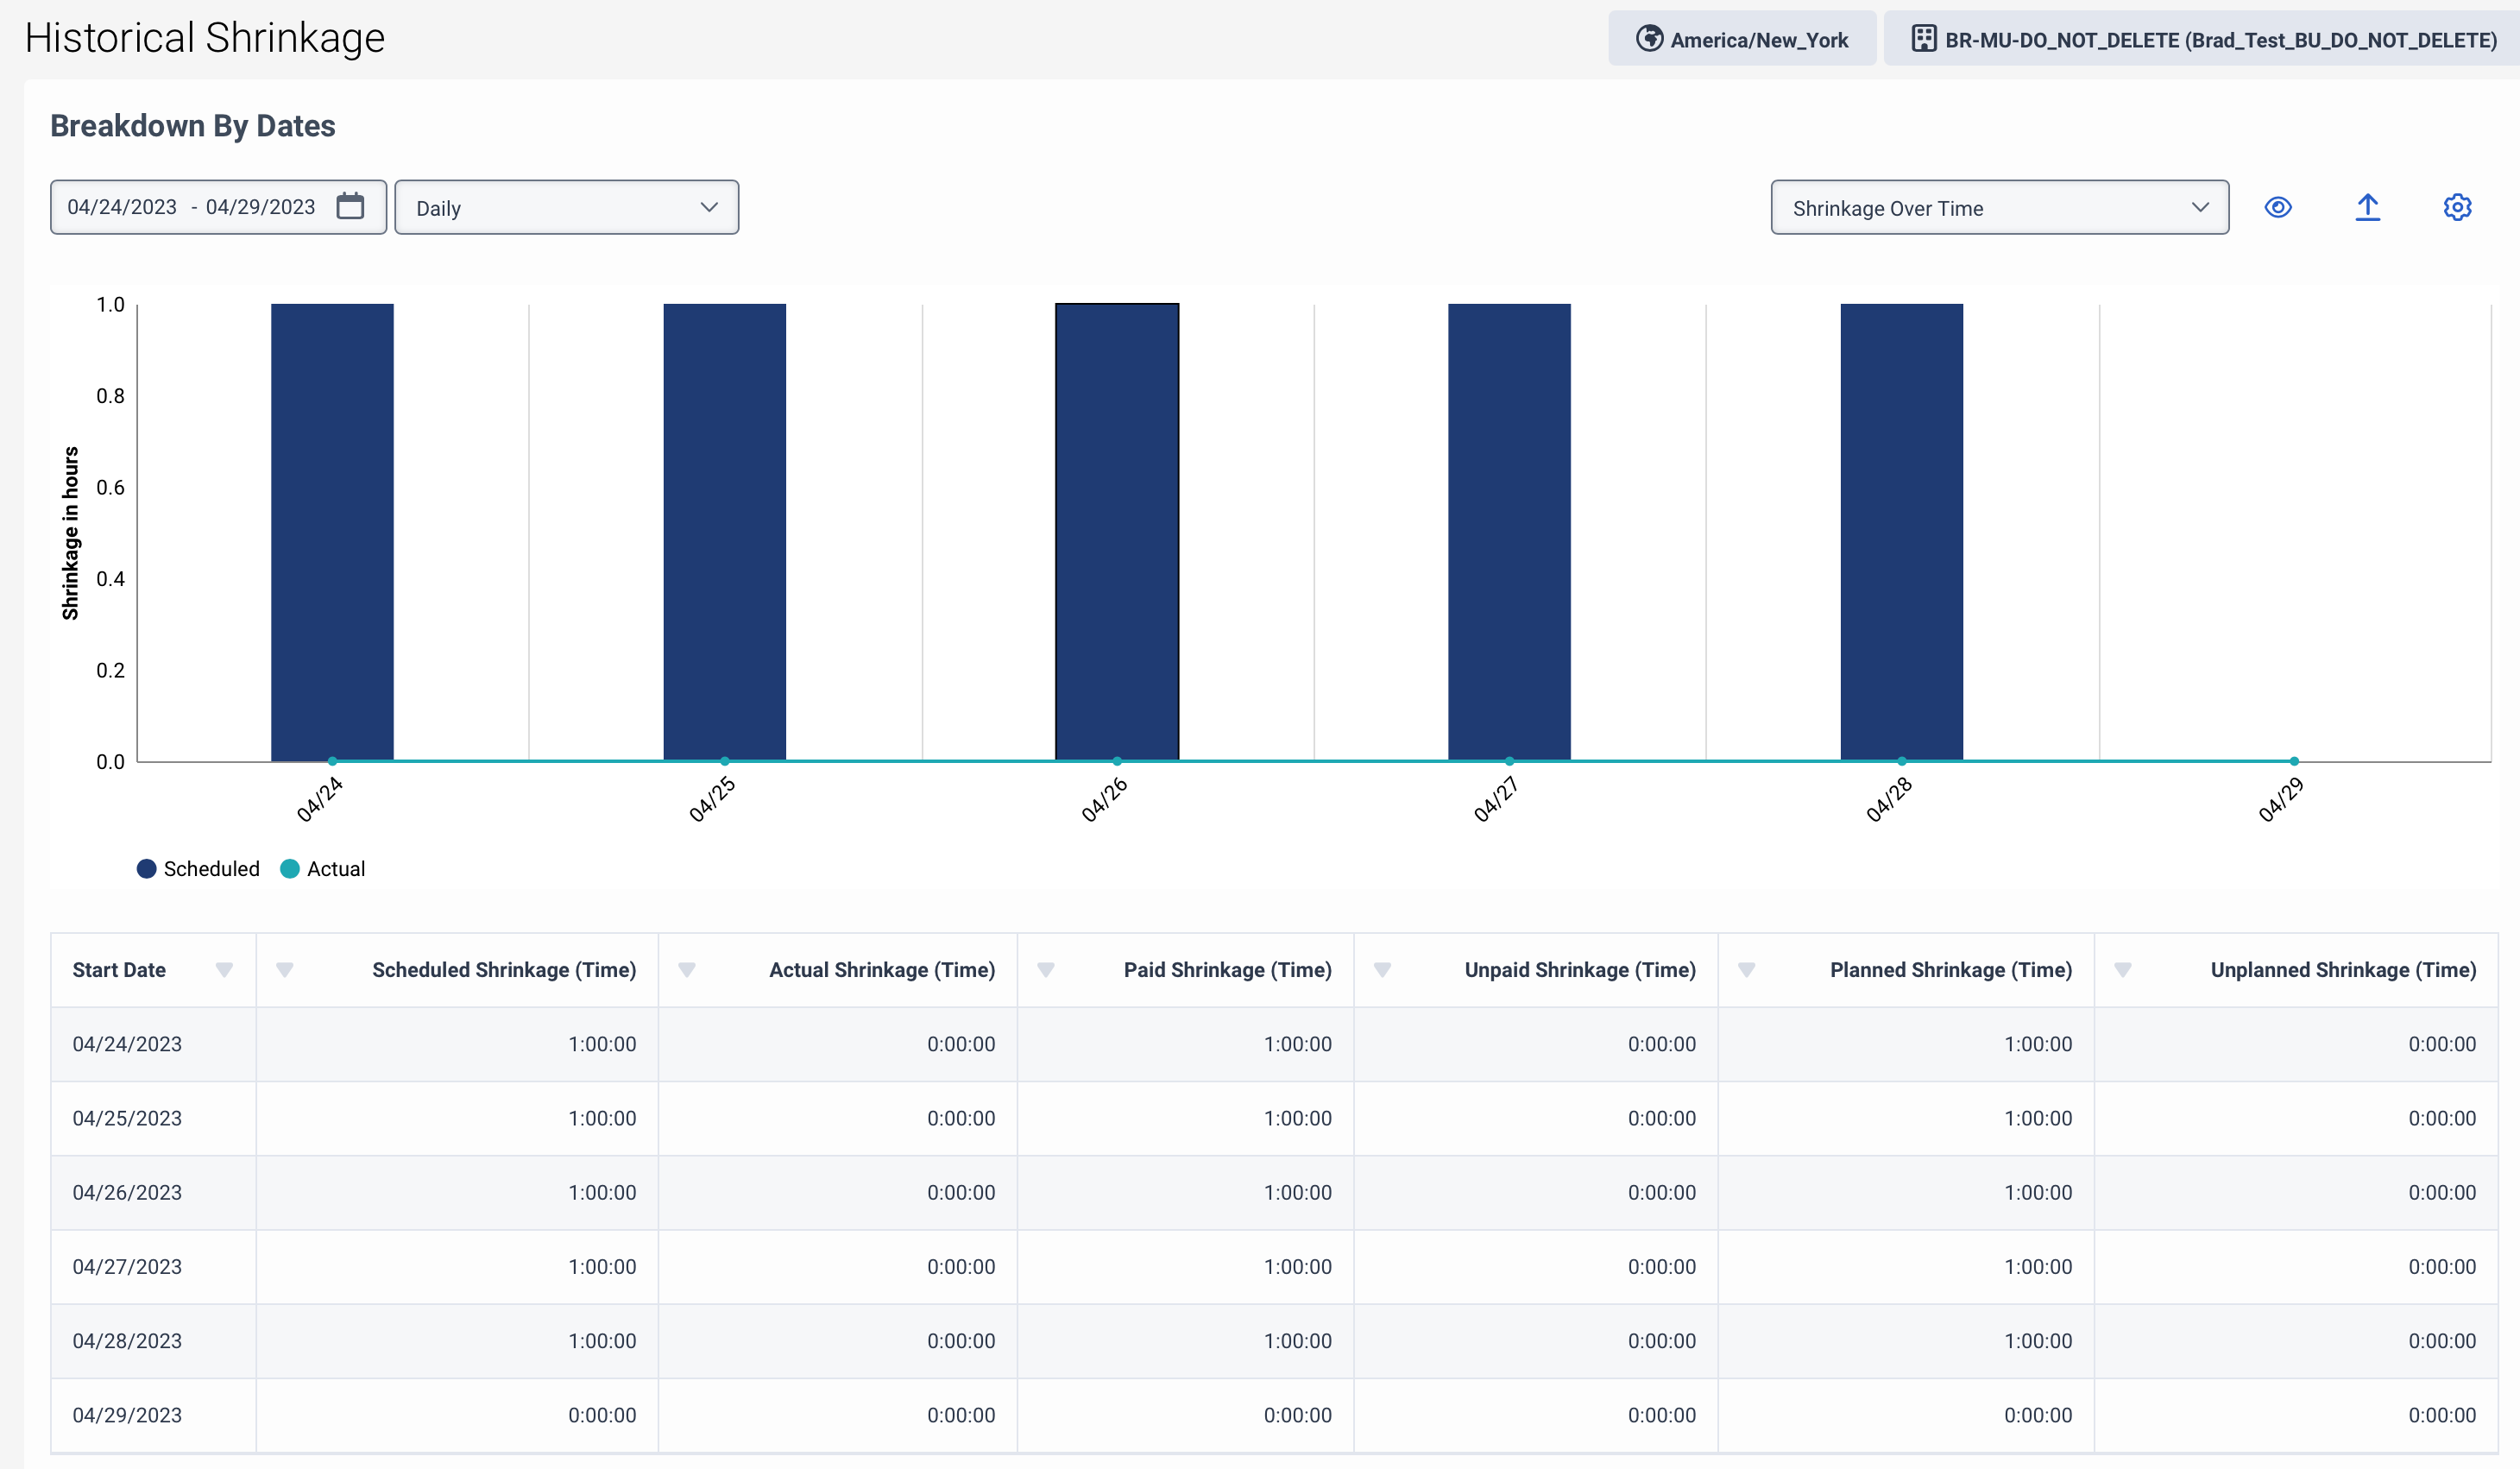
The table below the graph displays the data that you see in the graphs. You can sort the columns; however, if all zeros exist in any column, sorting does not occur. Click the preset option to view data for a select day. If no data exists, then a blank table appears.
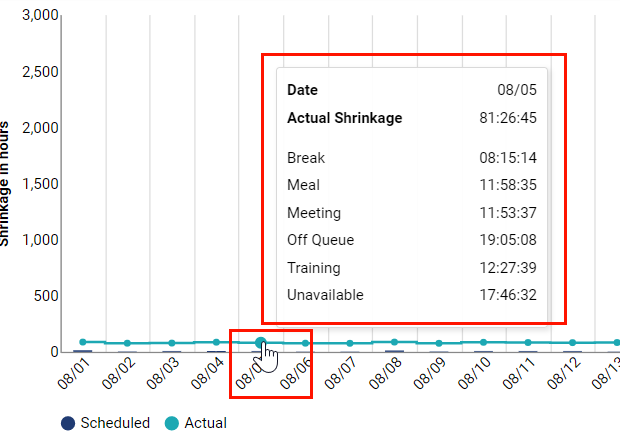
When you hover over the bar or date in the line in the graph, you can view the shrinkage over time details for scheduled and actual shrinkage. Click the image to enlarge.
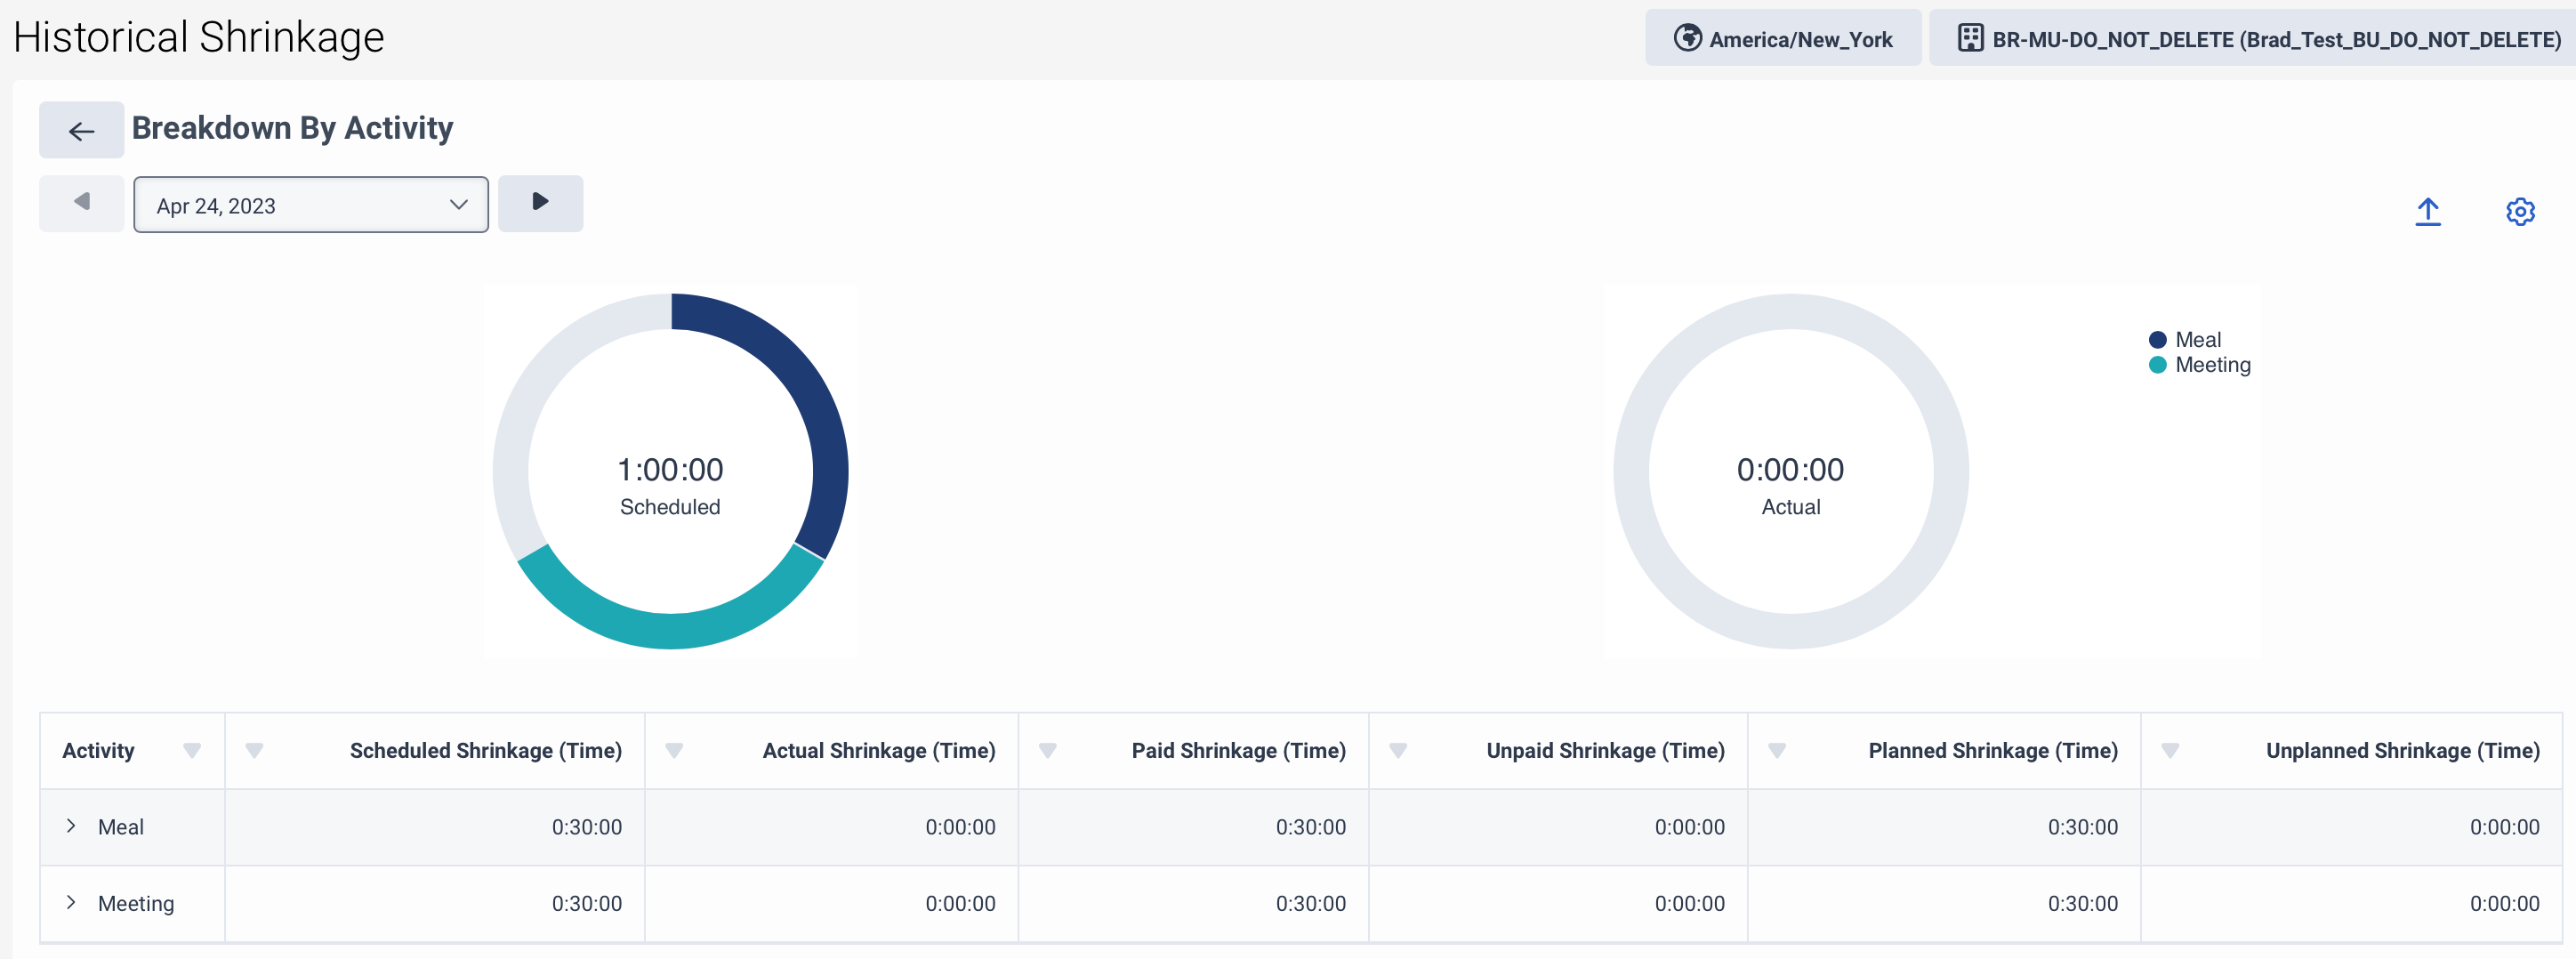
When you click any of the bars or dots in the line of the graph, you can view a more detailed view of the breakdown data by activity for the particular day or week based on the granularity that you select. You can toggle forward and backward to move between days and view the corresponding data. For more information on configuring activity codes, see Configure activity codes. Click the image to enlarge.
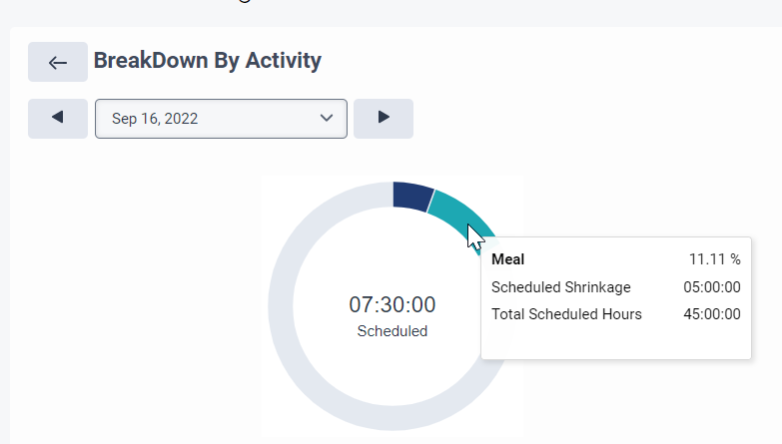
To navigate to this view from the Shrinkage Over Time view, click a bar or dot in the graph.
The following sections explain the fields and corresponding descriptions on the Historical Shrinkage view and the fields in the table that follows the graphs.
The following table lists the fields and its corresponding descriptions on the Historical Shrinkage view.
| Area | Description |
|---|---|
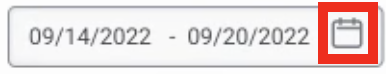
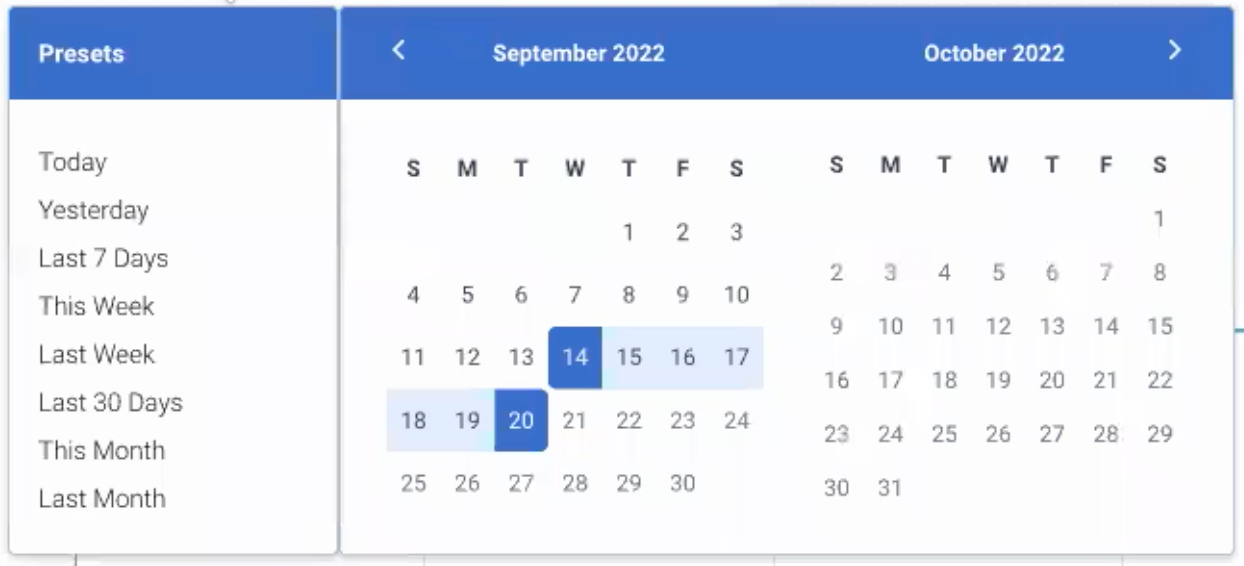
| Date picker |
Select the required date range. By default, shrinkage data for the last seven days appears. You can choose the required date from this selection. Click the image to enlarge. |
| Data granularity picker |
View the data on two granularity levels.
|
| Shrinkage type |
Select the shrinkage type based on the corresponding data for scheduled and actual shrinkage. The data displays with legends indicating the activity and the time spent alongside every category. Click anywhere in the graph to view the data. Toggle to the required day by clicking the front and back arrows or select the required date by clicking the list and view corresponding shrinkage information. The shrinkage types available for selection are:
|
|
Switch to breakdown view |
View the day view donut representation. This icon appears only to support key events on the graph. View the data for the day and can click the back arrow available next to the Breakdown by Activity header to go back to the breakdown by dates page. This icon appears when you select the Shrinkage Over Time option. |
|
Export data |
Export one of the following views:
The data displayed in this view and in the exported spreadsheet are the same. |
|
Settings |
Change the unit of measure displayed on the charts and tables. You can also compare the data available. Click this icon to view the available options. Click the image to enlarge.
You can view the information selected in the bar chart and also in the table below the chart. |
The following table lists the fields and its corresponding descriptions in the table that displays below the Shrinkage graph. The data that displays in each column is for activities that are configured as shrinkage activities.
| Field | Description |
|---|---|
| Start Date | Displays the date corresponding to which the shrinkage information is displayed in the other columns. |
| Scheduled Shrinkage (Time) | Shrinkage duration as per the scheduled activity. |
| Actual Shrinkage (Time) | Shrinkage duration as per the present activity. |
| Paid Shrinkage (Time) | Scheduled shrinkage duration configured and paid. |
| Unpaid Shrinkage (Time) | Scheduled shrinkage duration, which is configured and unpaid. |
| Planned Shrinkage (Time) | Scheduled shrinkage duration, which is configured and planned. |
| Unplanned Shrinkage (Time) | Scheduled shrinkage duration, which is configured and unplanned. |
For information about checking shrinkage calculation logic, see Historical shrinkage overview. For information about activity configuration of full day time off requests for planned/unplanned and paid/unpaid, see Configure activity codes.