
View current and historical activity in interaction journey cards
Journey cards organize customer journey data so that you can see current and historical activity. Each card represents what the customer did during a particular period, called a session. When you click an interaction to view its details, a journey card displays.
If an interaction was transferred between different queues and agents, details of the last queue and agent appear.
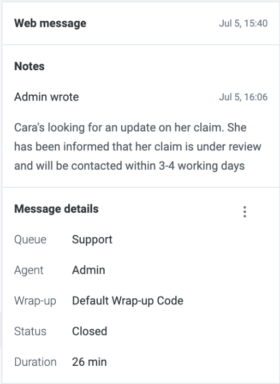
Web message card
The Web message card displays information about a messaging interaction between an agent and a customer. The card includes any notes from the last 60 days that agents add and also details about the messaging interaction. To view the details of past interactions during the conversation, click More > Interaction details.
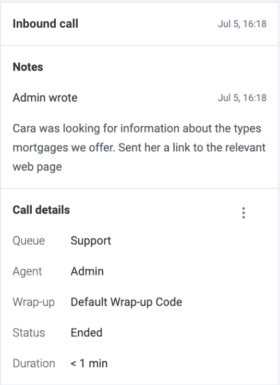
Inbound call card
The Inbound call card displays information about an inbound call from a customer that an agent answered. The card includes any notes from the last 60 days that agents add and also details about the phone call. To view the details of past interactions during the conversation, click More > Interaction details.
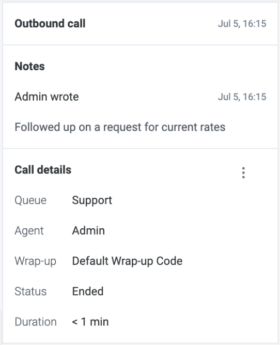
Outbound call card
The Outbound call card displays information about an outbound call that an agent placed to a customer. The card includes any notes from the last 60 days that agents add and details about the phone call. To view the details of past interactions during the conversation, click More > Interaction details.
Web/App visit card
If your organization has Genesys Predictive Engagement, the Web or App visit card is also available. Single customer view offers the ability for you to track web visits across different mobile, desktop, and tablet browsers, which enables a web ID/cookie identifier to stitch the web visits on the various devices. For example, if a customer provides their email address on a desktop and then interacts on a web message by providing their email address from their tablet, then these two web visits are saved under one profile. Similarly, if the customer visits your company through your app, the App visit card provides the various screens that the customer accessed.
Web/app visits are only saved for 60 days.
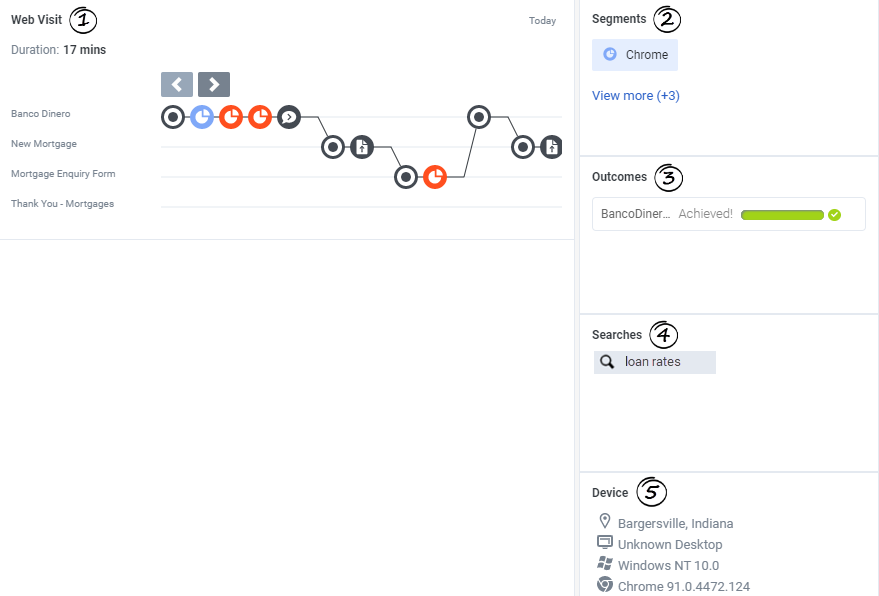
- Journey map: Displays a graphical representation of a visitor’s activity on your website or mobile app during a specific visit. For an active website or app visit, the journey map updates in real time as the visitor moves around your website or app, responds to interaction requests, and matches segments. For more information about the journey map icons, see Journey map icons.
- Segments: Displays segments that the visitor matched, such as a geographic region or browser type. A segment represents a group of visitors who share similar behavior or characteristics. For example, a segment might include all visitors who use the same browser or are from the same geographic region. Segments appear in the order that Genesys Predictive Engagement assigns them to the visitor.
- Outcomes: Displays the outcomes that your organization wants to achieve and the visitor’s progress toward those outcomes. For example, if the desired outcome is for the visitor to purchase a product, the visitor’s progress moves toward that goal when the visitor puts an item in their shopping cart. These bars update in real time as the visitor’s progress changes.
- Searches: Terms and phrases that the visitor searched for on your website or app. Knowing what visitors searched for on your website or app prepares you to answer their questions.
- Device: Information about the visitor’s device, such as geographic location, device type, operating system, and browser. For more information about the icons used to represent the device information, see Device icons.