
View telephony metrics
- Telephony > Plugin > All permission
Genesys Cloud allows you to create a custom dashboard of live metrics to monitor the performance of your Genesys Cloud telephony network. There is a set of metrics that are specific to the BYOC Premises telephony connection option and there are metrics that apply to all the telephony connection options: BYOC Premises, BYOC Cloud, and Genesys Cloud Voice. You can select the metrics you want to track and customize the appearance of the graphs. The dashboard allows you to show multiple graphs and move them around the screen using drag and drop. You can also select various preconfigured layouts.
BYOC Premises metrics
| Metric type | Metric | Description |
|---|---|---|
| Edge metrics | Bandwidth | The bandwidth usage on each edge expressed as either a percentage or bytes of available bandwidth. |
| Call counts | The current number of calls passing through the selected edges. | |
| CPU | The CPU usage on each edge. | |
| Memory | The memory usage on each edge. | |
| QoS mismatches | Total number of QoS mismatches on the edge. The statistic is measured during a 24-hour sliding window. | |
| Storage | The storage capacity of each edge. |
BYOC Premises, BYOC Cloud, and Genesys Cloud Voice metrics
| Metric type | Metric | Description |
|---|---|---|
| Trunk metrics | Call counts | The current number of calls passing through a trunk. |
| QoS mismatches | Total number of QoS mismatches on a Trunk. The statistic is measured during a 24-hour sliding window. |
Add a metric
- Click Menu > Digital and Telephony > Telephony > Metrics.
- Click Add Widget.
- Under Choose a metric type, click a tile and choose a metric.
- Click Next Step.
- Use the information in the following sections to configure the settings for your metric.
Edge metrics
Bandwidth usage source
Under Edges, choose either All Edges in premises sites or Edges.
-
- If you choose All Edges in premises sites, then use the drop-down to select one or more sites.
- If you choose Edges, then use the drop-down to select one or more Edges.
Under Display options, select the type of usage metric that you want to show and the unit of measurement that you want to display that metric.
- Show
- Usage per Edge
- Usage per network interface
- Units
- Percent
- Bytes sent/received
Call count source
Under Edges, choose either All Edges in premises sites or Edges.
- If you choose All Edges in premises sites, then use the drop-down to select one or more sites.
- If you choose Edges, then use the drop-down to select one or more Edges.
Under Display options, select the trunk type you want to monitor and the types of calls you want to monitor.
- Trunks type
- External
- Phone
- Calls
- All inbound and outbound
- Inbound
- Outbound
CPU usage source
Under Edges, choose All Edges in premises sites or Edges.
- If you choose All Edges in premises sites, then use the drop-down to select one or more sites.
- If you choose Edges, then use the drop-down to select one or more Edges.
Under Display options, select how you want to display the CPUs.
- Average of all CPUs
- CPUs
Memory usage source
Under Edges, choose either All Edges in premises sites or Edges.
- If you choose All Edges in premises sites, then use the drop-down to select one or more sites.
- If you choose Edges, then use the drop-down to select one or more Edges.
Under Display options, select the type of memory that you want to monitor.
- Physical memory
- Physical and virtual memory
QoS mismatches source
Under Edges, choose either All Edges in premises sites or Edges.
- If you choose All Edges in premises sites, then use the drop-down to select one or more sites.
- If you choose Edges, then use the drop-down to select one or more Edges.
Under Display options, select the trunk type you want to monitor and the types of calls you want to monitor.
- External
- Phone
Storage usage source
Under Edges, choose either All Edges in premises sites or Edges.
- If you choose All Edges in premises sites, then use the drop-down to select one or more sites.
- If you choose Edges, then use the drop-down to select one or more Edges.
Under Display options, select the type of storage device that you want to monitor.
- All storage devices
- Recording storage
- Recovery storage
Trunk metrics
Under Trunks, choose either External trunks or Phone trunks.
- If you choose External trunks, then use the drop-down to select one or more external trunks.
- If you choose Phone trunks, then use the drop-down to select one or more phone trunks.
Under Display options, select the metric you want to show and the types of calls you want to see.
Show metric
- Per trunk
- Per edge interface
Calls
- All inbound and outbound
- Inbound
- Outbound
Under Trunks, choose either External trunks or Phone trunks.
- If you choose External trunks, then use the drop-down to select one or more external trunks.
- If you choose Phone trunks, then use the drop-down to select one or more phone trunks.
Under Display options, select the metric that you want to show.
Show metric
- Per trunk
- Per edge interface
- Under Timeframe, use the drop-down and select a time period. Note: Choosing Current only shows the current value, which may appear as a gauge or bar chart, but choosing a specific time period always creates a line graph.
- Click Next Step.
- Under Title, type a name for your widget in the Widget title box. Note: While each widget is assigned a default title that is based on how you configure it, you can create a custom title.
- Click Add Widget.
Layout
After you choose your metrics and configure the settings, each metric widget appears on the Metrics page in the order in which you add them. However, you can edit and customize your Metrics page layout.
- Click Edit Layout and drag a metric widget to a location on the Metrics page you prefer.
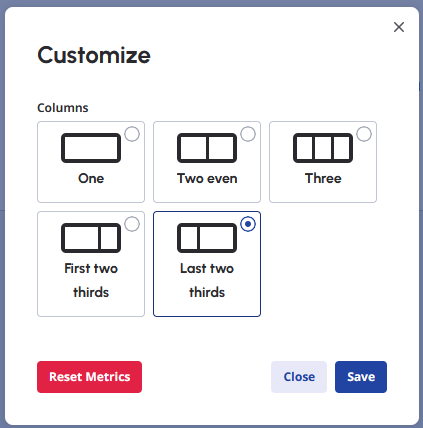
- Click Customize to choose and save the column layout for the Metrics page.
Genesys Cloud allows you to create a custom dashboard of live metrics to monitor the performance of the BYOC Premises Edges and trunks in your Genesys Cloud telephony network. You can select the metrics you want to track and customize the appearance of the graphs. The dashboard allows you to show multiple graphs and move them on the display using drag and drop. You can also select various preconfigured layouts.
| Metric type | Metric | Description |
|---|---|---|
| Edge | Bandwidth Usage | The bandwidth usage on each Edge expressed as a percentage of available bandwidth |
| CPU Usage | The CPU usage on each Edge | |
| Call Counts by Edge | Current number of calls passing through an Edge | |
| Memory Usage | The memory usage on each Edge | |
| Storage Usage | The storage capacity of each Edge | |
| QoS Mismatches by Edge | Total number of QoS mismatches on the Edge. The statistic is measured during a 24-hour sliding window. | |
| Trunk | Call Counts by Trunk | Current number of calls passing through a trunk |
| QoS Mismatches by Trunk | Total number of QoS mismatches on a Trunk. The statistic is measured during a 24-hour sliding window. |
Add a metric
- Click Admin.
- Under Telephony, click Metrics.
- Click Menu > Digital and Telephony > Telephony > Metrics.
- Click Add Metric.
- Under New Graph, type a name for your graph in the Name box. Note: If you leave the Name box blank, Genesys Cloud automatically creates a name based on the selections you make.
- From the Metric list, choose your metric and then configure the associated options.
- Under For, choose All Edges in Sites or Edges.
- If you choose All Edges in Sites, use the Select Sites list to select one or more sites.
- If you choose Edges, use the Select Edges list to select one or more Edges.
- Choose from the options associated with the Edge-based metric you selected:
| Edge-based metric | Options |
|---|---|
| Bandwidth Usage |
How to graph
|
| CPU Usage |
How to graph
|
| Call Counts by Edge |
Trunk Type
What to graph
|
| Memory Usage |
How to graph
|
| Storage Usage |
How to graph
|
| QoS Mismatches by Edge |
How to graph
|
- Under For, choose External Trunks or Phone Trunks.
- If you choose External Trunks, use the Select External Trunks list to select one or more external trunks.
- If you choose Phone Trunks, use the Select Phone Trunks list to select one or more phone trunks.
- Choose from the options associated with the trunk-based metric you selected:
| Trunk-based metric | Options |
|---|---|
| Call Counts by Trunk |
How to graph
What to graph
|
| QoS Mismatches by Trunk |
How to graph
|
- Click Save and you'll see your new metric graph.
As the graph is running, you can hover your mouse pointer over the graph to see a measurement point.
Modify the graph
Once the graph is up and running, you can modify the graph's display:
Hide/Show the legend
To remove the legend, click hide legend . To display a hidden legend, click show legend .
Edit the graph
To change the type of metrics or the trunks or Edges selected, click Edit .
Change the time period of a graph
To change the time period for the metric, click Zoom and choose a time period.
Expand the display
To increase the size of the graph's display, click Expand . To decrease the size of the graph, press [Esc] or click Close .
Change the dashboard layout
To change the dashboard layout, click Layout
and choose a view option.
Delete a graph
To delete a graph, click Edit and then click Delete