
Review Scheduled, Required and Performance results, and daily summaries
- Workforce Management > Schedule > Edit and View permission
- Workforce Management > Short Term Forecast > View permission
- Workforce Management > staffingRequirement > View permission
When you generate a forecast-based schedule, the schedule editor provides the scheduled, required staff, difference counts, and performance results, which help you analyze and plan schedules.
In the chart at the bottom of the schedule editor, select Scheduled, Required, and Performance from the list. To the right of the Scheduled, Required, and Performance drop-down, click to open the Required and Performance display options.
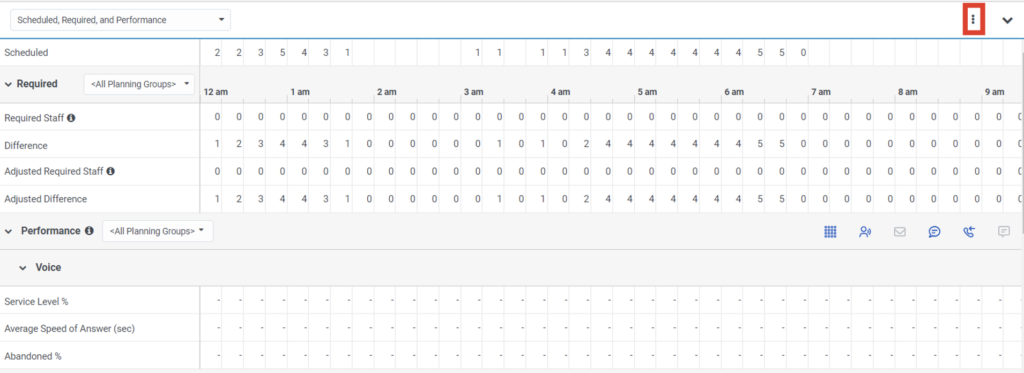
Available in View by Day, the Scheduled, Required, and Performance information includes the following rows:
Required metrics include the following rows:
- The Required Staff row displays the number of full time-equivalent agents required during that time period. This value is the total of all required values for the time period, and does not include shrinkage. The Required Staff row displays when you generate a schedule and automatically updates when a reschedule is run.
- The Difference row displays the difference between the Scheduled row and the Required Staff row, and does not include shrinkage.
- The Required Staff with Shrinkage row displays the number of full time-equivalent agents required during that time period. This value is the total of all required values for the time period, and includes shrinkage.
- The Difference with Shrinkage row displays the difference between the Scheduled row and the Required Staff with Shrinkage row, and includes shrinkage.
- The Adjusted Required Staff row displays the number of full-time-equivalent agents required during that time period based on the most recent Volume and AHT forecast. This value is the total of all required values for the time period and does not include shrinkage. The Adjusted Required Staff row values updates, whenever the linked forecast is modified and saved.
- The Adjusted Difference row displays the difference between the Scheduled row and the Adjusted Required Staff row and does not include shrinkage.
- The Adjusted Required Staff with Shrinkage row displays the number of full-time-equivalent agents required during that time period based on the most recent Volume and AHT forecast. This value is the total of all required values for the time period and includes shrinkage.
- The Adjusted Difference with Shrinkage row displays the difference between the Scheduled row and the Adjusted Required Staff with Shrinkage row and includes shrinkage.
Performance metrics include the following rows. These rows appear by media type. To show or hide a media type, click the Media Type icon on the upper right corner of the Performance header row.
- The Service Level % row displays the forecasted service level based on the most recent volume and AHT forecast and the allocated agent FTE for the selected Planning Groups.
- The Average Speed of Answer (sec) row displays the forecasted ASA based on the most recent volume and AHT forecast and the allocated agent FTE for the selected Planning Groups.
- The Abandoned % row displays the forecasted abandoned percentage based on the most recent volume and AHT forecast and the allocated agent FTE for the selected Planning Groups.
Available in the View by Week mode, daily summaries provide totals for:
- The number of agents that have shifts for the day.
The agent's total number of paid hours for the currently displayed week.
The agent's total number of paid hours for the currently displayed day.
Multi-contact type and multi-staff type environments are complex and so the forecast staffing requirement is not a simple calculation (for example, base staffing requirements) and does not use a simple formula such as Erlang-C.
Instead, the system uses a proprietary process that uses mathematical modeling, mathematical optimization, linear programming, discrete event simulation, and heuristics. The scheduling engine attempts to produce a realistic, minimal set of agents based on actual agents that could handle the specified load–the number shown is how many agents, including shrinkage, were needed to meet service performance goals.
The agents used are similar to existing agents (for example, with the same queue associations, media type handling abilities, and skills), but with some flexibility that allows it to also include up to one clone of each of the agents.