Navigate the forecast
Forecasts show information about the number of interactions that are expected in future weeks. Forecast data includes metrics such as pattern, volume (number of interactions), and average handle time (composed of average talk time, average hold time, and average after call work time). You can also export forecast and source data, create and manage forecast modifications, and filter information by metrics, days, queues, media types, and skill set.
View from a different time zone
By default, this view uses the business unit’s time zone. Users with administrator permissions can change the displayed time zone by selecting from the list in the upper right corner of the view. This option is helpful for administrators who access the view from a different time zone.
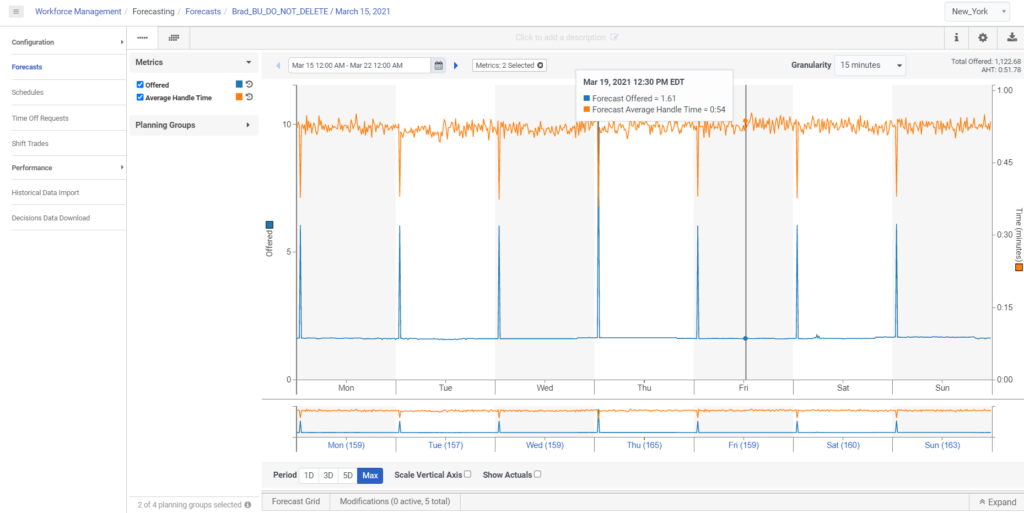
The graph view displays selected metric variables for calculating the forecast. On the left side of the page, expand the categories and display filtering options by clicking the headers. Adjust the forecasting calculations by selecting or clearing the check boxes. Collapse views by clicking the headers again. In the graph area, notice the following:
In the Display Options dialog box, you can:
- Change the forecasting time zone. The default is the business unit's time zone.
- Select to view modification projection.
- Specify whether actual values appear for intervals in the past. The default is to show actual values, which appear as dotted lines.
- Specify whether to display data in either seconds format or time format (for example, "d hh:mm:ss"). The default display is seconds format (for example, 243 seconds or 4:03).
To change display options:
- Click Admin.
- Under Workforce Management, click Forecasts.
- Create a new forecast, or click an existing forecast to open it for editing.
- Click Settings . The Display Options dialog box opens.
- Do any of the following:
- To display modification projection, enable Show Modification Projection.
- To include empty planning groups in the forecast view, enable Show Empty Planning Groups.
- To change the format in which the system displays data, next to Offered Metric Data Format, enable Bar or Line.
- To specify whether to display data in seconds format, click Seconds. Or to select time format, select Digital. The default is time format.
- Optionally edit snap interval and time snap interval.
- Click OK.
The view contains the following information:
| Area | Description |
|---|---|
| View | Choose from short-term or long-term forecast views. |
| Forecast date boxes | Use the date boxes to narrow the time frame currently displayed in the forecast graph. |
| Forecast filter tags | Select the planning groups to display in the forecast graph. |
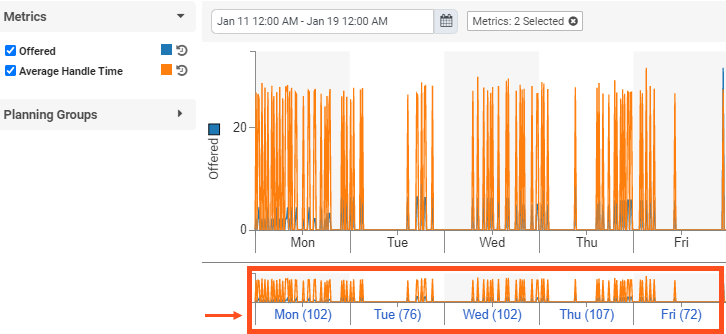
| Forecast metrics | Select the metrics to include in the forecast. The colored box next to each metric corresponds to the colored line on the forecast graph. Click the arrow in the Metrics header to expand or collapse this view. |
| Forecast days |
Short-term forecast view only: Click each individual day to filter the view for a specific day. |
| Period |
Use the options and check boxes in this area to:
|
| Planning groups | Search for planning groups associated with the forecast. |
| Forecast graph and editor |
The graph view displays selected metric variables for calculating the short-term forecast. On the left side of the page, expand the categories and display filtering options by clicking the headers. Adjust forecasting calculations by selecting or clearing the check boxes. Collapse views by clicking the headers again. In the graph area, notice the following:
|
| Forecast grid and modifications list | View the forecast in grid form. View and edit or modify the list of forecast modifications. If you select any metric and then check a specific year or week, the system appends that data to the forecast grid. |